The typical remittance, the last mile, and the effects of remittances on recipient communities

 Updates to Geo-Mexico  Comments Off on The typical remittance, the last mile, and the effects of remittances on recipient communities
Dec 262011
 

What are the characteristics of a “typical” remittance? The average remittance amount has remained fairly stable in the past decade. Migrants sending remittances do so about once every month, and send between $280 and $370 each time. Remittance amounts tend to decrease over time; migrants who have lived in the USA for a long time send fewer dollars back home than those in their first year or two. Some migrants continue to send funds back home even after living for 20 years or more in the USA. [This post is based on the World Bank Working Paper by Raúl Hernández-Coss, entitled The U.S.–Mexico Remittance Corridor: Lessons on Shifting from Informal to Formal Transfer Systems.]

The recipients

Remittance payments do not only go to Mexico’s poorest families. Recent surveys show that the there is very little difference between the monthly income of recipients of remittances in Mexico and the national average monthly income. The educational level of recipients is also close to that of the overall population.

The last mile: how do recipients receive remittances?

Depending on how they are sent, remittances can be collected by recipients in Mexico in several different places. These include banks, some department stores, post offices, casas populares (akin to credit unions), microfinance institutions, neighborhood stores and currency exchange outlets.

Effects of Remittances on Recipient Communities

These effects can be examined at a variety of scales.

At the household level, remittances are believed to have an overall positive effect on the recipient economy. Some studies have reported that remittances from the USA account for 20% of the capital invested in micro-enterprises in Mexico. The spending of remittances has a multiplier effect in local communities. On the other hand, remittances may also have some negative effects on households. Some families may become overly dependent on regular remittance payments and lose the incentive to work or improve labor skills.

At the community level, remittances from the USA are often used for community projects in the migrants’ “home” towns and villages in Mexico. This implies a much greater degree of organization (than for household-level impacts) and carries socio-political implications. There are dozens of “Home Town Associations” in the USA, each linking migrants to their home community. In many cases, these give migrants an on-going, increasingly effective, voice in the decisions taken in their home communities.

On the flip side, remittances have inflated the price of land and property in some communities, as many migrants use remittances to purchase property in their native community with the intention of eventually returning to live there. In some villages, the large houses they have built remain empty most or all of the year, too expensive to rent at local rates.

Migrants have acquired some political power. This has been recognized by the Mexican government which has introduced mechanisms allowing Mexican migrants to register and vote in presidential elections.

Case study: remittances received by Tlacolula (Oaxaca).

The city of Tlacolula, in Oaxaca, has about 13,500 inhabitants and is a marketing center for surrounding municipalities. Remittance funds sent back to Tlacolula is first used to pay off any debts incurred in financing the trip to the USA. Most of the remainder is then used to build houses. In the past decade, the value of land and building materials has risen extremely rapidly. For instance, it is reported that a 400-square-meter building plot that cost $10,000 (dollars) a decade ago now costs about $60,000. Returning migrants do not always bring savings back with them, but do bring new skills, and possibly tools, such as those required to be an electrician or plumber.

Active participants in globalization

As the World Bank study states, “The families and communities affected by remittances are active participants in globalization. In addition to exchanging funds, they maintain ties between migrants and their origins, as people move north, and money moves south. The exchange does not stop with personal family remittances. Links between communities on either side of the border are also fostered through home town associations (HTAs).” We will look more closely at HTAs in a future post.

Related posts:


The widening income gap in Mexico; the rich earn 26 times more than the poor

 Updates to Geo-Mexico  Comments Off on The widening income gap in Mexico; the rich earn 26 times more than the poor
Dec 202011
 

A recent OECD (Organisation for Economic Cooperation and Development) study – “Divided We Stand: Why Inequality Keeps Rising” – shows that in the last 25 years, the “real” (adjusted for inflation) income of the richest 10% of Mexican households has risen by 1.7%, compared to only 0.8% for the poorest 10% of  households.

The gap between rich and poor for OECD members is at its highest for 30 years. Mexico has the dubious distinction of being the OECD member with the second largest gap in household incomes, exceeded only by Chile. The average income of the richest 10% of households in Mexico is now a staggering 26 times higher than the average income for the poorest 10% of households.

To quote the OECD report: “The income gap has risen even in traditionally egalitarian countries, such as Germany, Denmark and Sweden, from 5 to 1 in the 1980s to 6 to 1 today. The gap is 10 to 1 in Italy, Japan, Korea and the United Kingdom, and higher still, at 14 to 1 in Israel, Turkey and the United States.” The mean value for all OECD members is slightly less than 9.

In 2008, the richest homes in Mexico had an average income of 228,900 pesos (about 20,800 dollars at the then exchange rate), compared to just 8,700 pesos (790 dollars) for the poorest 10% of homes.

Looking at some of the factors likely to have caused the widening gap, the OECD report points out that, “Societal changes – more single people and single-parent households, more partners marrying within the same earnings classes – explained more than 70% of the increase in household earnings inequality. In other OECD countries, this factor was much less important. At the same time, women’s higher employment rates helped reducing household earnings inequality considerably.”

Full 400-page report:

Related posts:


Rapid Improvements in housing, especially for Mexico’s poorest

 Updates to Geo-Mexico  Comments Off on Rapid Improvements in housing, especially for Mexico’s poorest
Dec 152011
 

The 2010 census provides many indicators of minimal housing quality such as sanitary drainage (indoor drains and toilets), electricity, piped water, overcrowding, and dirt floors. A previous post discussed the rapid expansion of household electricity, especially in remote areas. This post focuses on the other measures of housing quality, and considers three different scales: national, state and municipality.

The national situation

All measures of minimal housing quality improved significantly between 2000 and 2010. The proportion of Mexicans living in houses without sanitary drainage went from 9.9% in 2000 all the way down to 3.6% in 2010, a decline of almost two-thirds. Those without piped water went from 11.2% to 8.6%. It is interesting that many Mexicans that have indoor toilets do not have piped water. The reason for this is that sanitary drainage needs only pipes and gravity while piped water requires pressure-holding plumbing, and pumps driven by either electric or diesel power. Those without piped water must carry water into the house either by bucket or take delivery from a pipa (water truck).

The availability of both sanitary drainage and piped water are extremely important to health, particularly infant health. When a household has piped water, it uses far more water for bathing and mopping, as well as for cleaning food, utensils, clothing etc. This results in far less contamination and disease.

The number of Mexicans living in houses with dirt floors declined by over half, dropping from 14.8% down to 6.6%. Dirt floors are also associated with greater contamination and disease. Overcrowding, defined as more than two persons a room, is still an issue in virtually all areas of Mexico. The proportion living in homes with more than two persons a room went from 45.9% in 2000 to 36.5% in 2010. This is a significant improvement, but more than a third of Mexicans still live in overcrowded housing.

Comparisons between states

Chiapas and Oaxaca made spectacular progress in providing sanitary drainage. The proportion without sanitary drainage was cut by about three quarters. In Chiapas it went from 19.3% down to 5.1%. In Oaxaca, it dropped from 18.1% to only 4.0%. Other states with very impressive improvements include Zacatecas (19.7% to 6.7%), Hidalgo (17.2% to 6.0%), Puebla (11.9% to 3.1%), Michoacán (11.4% to 3.8%) and Veracruz (10.2% to 2.6%). The state with the highest proportion without sanitary drainage is Guerrero with 19.6% (down from 35.2% in 2000). The second highest is Yucatán at 12.6% (down from 24.0%). The lowest rates are in the Federal District (0.1%), followed by Nuevo León and Baja California (each with 0.4%).

Mexican housingProgress in providing piped water was far less impressive. The situation is worst in Guerrero where the proportion without piped water actually increased from 29.5% to 29.8%. The situation also deteriorated in Morelos (7.3% to 8.2%), Baja California Sur (6.3% to 7.1%), Quintana Roo (5.3% to 6.2%) and the Federal District (1.5% to 1.8%). These states experienced the expansion of low quality informal housing without piped water.

Progress in reducing the proportion living with dirt floors was considerably better, especially in the poorest states: Oaxaca, from 41.6% 2000 down to 19.3% in 2010; Chiapas, 40.9% to 15.7%; Guerrero, 40.0% to 19.6%; Veracruz, 29.3% to 12.4%; Puebla, 24.1% to 9.9%; San Luis Potosi, 23.7% to 9.1%; and Michoacán, 19.9% to 11.0%.

Like the other housing measures, overcrowding (more than two persons a room) is worse in the poorer states. The proportion is highest in Chiapas at 53.9% (down from 65.0% in 2000). Other states with high levels are Guerrero (50.2%), Oaxaca (46.5%), Campeche (46.0%) and Puebla (44.6%). All Mexican states reduced overcrowding by about 25%. Even in wealthy states, overcrowding is significant with the Federal District registering 26.1%, Baja California 29.1% and Nuevo León 29.8%.

The situation in Mexico’s poorest municipalities

Housing is particularly bad in Mexico’s 100 poorest municipalities, which tend to be rural communities occupied by indigenous groups. On average, 21% of the 1.5 million residents of these municipalities do not have sanitary drainage, 47% lack piped water, 64% live in overcrowded housing, 33% have dirt floors and 19% lack electricity.

On a positive note, many of these municipalities have made outstanding progress since 2000. For example, several communities reduced the proportion without sanitary drainage from over 40% to less than 5%. Others increased the percentage with piped water from less than 30% to over 60%. The proportion with dirt floors in several municipalities went from over 60% to less than 20%.

Some of these poor communities now score quite high on some housing variables. For example, in 20 of the 100 municipalities, 98% have sanitary drainage; however in 10 of these 20, over half the people lack piped water. On the other hand, in five of the poorest 100 municipalities, over 90% of the people have piped water. In nine of the 100, less than 15% live with dirt floors. These data reveal that poor housing in Mexico is characterized by a variety of different deficiencies. However, one conclusion is clear: overcrowding remains a problem in all the poorest 100 municipalities. In only seven of the 100 is overcrowding less than 60%; it is over 80% in 78 of Mexico’s 100 poorest communities.

Source of data:

CONAPO, “Índice de marginación por entidad federativa y municipio, 2010” México D.F., October 2011.

Related posts:


The rapid expansion of literacy and education in Mexico

 Updates to Geo-Mexico  Comments Off on The rapid expansion of literacy and education in Mexico
Nov 282011
 

Data from Mexico’s 2010 census indicate that considerable progress has been made in the recent past. Literacy of those over age 15 has increased from 87.6% in 1990 to 90.5% in 2000 and 93.1% in 2010. This is to be expected since literacy varies with age. As the older people, many of whom are illiterate, die off, they are replaced by younger, more literate, Mexicans. For example, in 2010, 34% of those over age 75 were illiterate, compared to under 2% for those aged 15 to 29.

Literacy is highest in the Federal District (97.9%) and lowest in Chiapas (82.2%), Guerrero (83.3%) and Oaxaca (83.7%). In future decades, illiteracy will continue to decline significantly, especially in the poorer southern states. However, with life expectancy increasing and older people living longer, illiteracy will not decline as fast as it might.

Preschool, primary schools (primaria) and junior high schools (secundaria)

educationAbout half of Mexican children aged 3 to 5 attended preschool in 2010. Basic education begins with primary schools (primaria) with grades 1 to 6 for children generally between the ages of 6 and about 12. Junior high schools (secundaria) cover grades 7 to 9 and focus on 12 to 15-year-olds. In Mexico primaria and secundaria are compulsory; however, in the past, many children dropped out for a wide variety of reasons (the need to work and support the family being a major one). Mexico’s telescundaria system brings junior high school lessons to students in remote areas via satellite.

In 2010, an impressive 95% of those aged from 6 to 14 attended school, compared to 91% in 2000 and 86% in 1990. The majority of the 5% not attending school in 2010 did attend school previously and had acquired basic literacy. The rather poor state of Hidalgo had the highest attendance rate in 2010 with 96.4% (tied with Tlaxcala and the Federal District). The lowest levels were in Chiapas (90.8%), Michoacán (92.4%) and Guerrero (93.1%).

The rather small difference between the highest and lowest rates suggests that most Mexicans throughout the country have relatively equal access to basic education. Even in the poorest 125 of Mexico’s 2442 municipalities 88% of 6 to 14-year-olds were in school, according to the 2010 census.

High or senior high schools (preparatoria)

Senior high school education (prepatratoria) offers grades 10 to 12 and is not compulsory. Students generally are aged between 15 and 18. Some of these schools focus on preparing students for university while others focus on vocational training. In some rural areas, students must travel considerable distances to the nearest senior high school, and some have to live away from home during term time.

Teaching hours and the quality of education

Unfortunately, school attendance is not a reliable indicator of the number of teaching hours. Students receive only 2.8 hours of real instruction per day according to a new study by Mexicanos Primero, a citizens’ group focused on improving the quality of education. The study indicates that Mexican students get 562 hours of instruction per year, compared to 710 hours in the USA, 875 in France, 1172 in Finland and 1195 in South Korea. Mexicanos Primero complains that too much real instruction time is lost due to preparation for parades and festivals, teacher absenteeism and school closures.

There are also issues concerning the quality of education. According a recent Organisation of Economic Cooperation and Development (OECD) Mexico is doing a poor job of educating its youth. Only 1% of Mexican 15-year-olds have the knowledge and skills needed for full participation in modern society, compared to 30% in Hong Kong and 26% in South Korea.

Higher education has made impressive gains. In 2010 over 40% of those aged 15 to 24 were attending school compared to 33% in 2000 and 30% in 1990.

temporary classroom

Temporary classroom while a new school is being built. (Jungapeo, Michoacán, mid-1980s). Photo: Tony Burton.

Years of schooling

The “average years of schooling” figure has increased about one year a decade, from 6.5 years in 1990 to 7.5 in 2000 and 8.6 in 2010. The Federal District is the most educated with an average of 10.5 years of schooling, compared to 6.7 in Chiapas and 6.9 in Oaxaca. Given historical trends, older adults have significantly fewer years of education than younger adults.

There are still some serious urban-rural differences. The best educated municipality is Benito Juárez in the Federal District with 13.9 years, compared to levels between 2.3 and 3.4 years for the ten lowest municipalities, which are all in the rural south and are predominately indigenous language speakers. In these poor indigenous rural municipalities, most of the elderly have virtually no schooling even if the majority of children are now attending school and learning Spanish.

Source:

Many states in Mexico badly affected by drought

 Mexico's geography in the Press, Updates to Geo-Mexico  Comments Off on Many states in Mexico badly affected by drought
Nov 232011
 

Much of Mexico is currently affected by some degree of drought (see map below). The National Meteorological Service (SMN) reports that September was one of the driest months in some 70 years. All the signs suggest this is the worst year for drought since 1941. The worst affected states are Sonora, Chihuahua, Coahuila, Durango, Nuevo León and Zacatecas. (Paradoxically, some parts of southern Mexico, especially in the states of Oaxaca and Tabasco, have experienced serious flooding in recent months).

In the drought zones, emergency programs are getting underway to provide temporary work for many rural dwellers and to supply potable water to the worst affected settlements. In addition to crop losses, up to one million head of cattle will have been put down by year-end in northern states as a direct result of the drought, since farmers do not have sufficient fodder available to feed them as usual.

While some cattle have been exported to the USA, local meat prices will be driven down by the increase in supply, making many farmer’s livelihoods even more precarious. Many farmers will need federal assistance to overcome this latest crisis.
Areas suffering from drought, October 2011

Areas suffering from short-term and long-term drought, October 2011. Click map to enlarge

Durango faces the worst drought for 100 years

In Durango, water has been provided to 32,691 residents in 10 municipalities, with another 36 municipalities to be supplied in the current phase of emergency assistance. Officials in Durango say it is the state’s worst drought for 100 years, with most larger reservoirs in the state now holding between 20% and 40% of their capacity; one reservoir is already down to less than 10% of its.

Irregular rains over the past few months have done little to replenish reservoirs, leaving farmers in despair. The long-range forecast does not appear to offer them much consolation, with the drought expected to last well into next year.

By mid-September, some parts of Durango had received less than 140 mm of precipitation so far ths year, well below the 425 mm registered for the same period in 2010.  The only hope for local farmers appears to be if late season hurricanes bring far more rain than expected to this region.

The drought news from other states

In Chihuahua, 589 tankers have delivered water to settlements housing 62,000 in 15 different municipalities: Guazapares, Janos, Manuel Benavides, Morelos, Moris, Ocampo, Ojinaga, Urique, Uruachi, Aldama, Balleza, Bocoyna, Guachochi, Guadalupe and Calvo.

In Zacatecas, a “state of emergency” has been declared for 52 of the state’s 58 municipalities. More than 150 communities are seriously affected, especially smaller communities in the municipalities of Fresnillo, Jerez, Guadalupe, Tlaltenango, Nochistlán, Atolinga, Villa de Cos, Genaro Codina and Teúl de Gonzalez Ortega.

Drought has affected 288,000 hectares of rain-fed crops in Guanajuato. The greatest losses are of corn, beans, wheat, sorghum and other grains, with the worst-hit areas located in the northern part of the state. More than a million liters of potable water have been supplied to 18,000 inhabitants living in 133 settlements in the state, located in the municipalities of Atarjea, Doctor Mora, San Diego de la Unión, San Felipe, Santa Catarina, Tierra Blanca, Victoria and Xichú.

Horticulturalists in Sinaloa growing vegetables, grains and fruit for export want 30 million dollars in emergency funds to restore irrigation to 700,000 hectares of productive land. More than 200,000 seasonal jobs are at risk.

Related post:

Mexico’s water resources and water-related issues are the subject of chapters 6 and 7 of Geo-Mexico: the geography and dynamics of modern Mexico. Ask your library to buy a copy of this handy reference guide to all aspects of Mexico’s geography today! Better yet, order your own copy…


Oct 222011
 

Mexico’s pioneering “telesecundaria” or “television secondary school” system began back in 1968. It now provides junior high school classes in remote areas, serving about one million students in grades 7 to 9, 17% of the total nationwide enrollment in these grades. Many of the telesecundaria lessons are now available on the Internet, and before long, about 4,500 classes will also be available on a DVD collection.

The geographical network of telesecundarias is truly amazing. In the early 1980s, I came across one high in the mountains in a distant corner of the state of Hidalgo, in a remote Huastec village, beyond even Coca Cola’s delivery routes. A visitor was such a surprise that the entire village turned out to inspect me!

Telesecundaria in Ixcatepec, Hidalgo

Telesecundaria in Ixcatepec, Hidalgo (1983) Photo: Tony Burton

It was that experience that made me realize that Mexicans take education very very seriously. The telesecundaria was perched on the hillside overlooking the village. I later discovered this was a fairly typical example, with three classrooms, rustic restrooms in an outhouse, and a small playground. Most telesecundarias also have a science laboratory and a small library.

The students in a telesecundaria do have a teacher, but this teacher teaches every subject, whereas in a regular junior high, each student will have up to twelve different subject specialists. Every telesecundaria classroom has a television set to receive lessons broadcast by the Education Ministry (SEP) in Mexico City.

Professional Programs

In the early days, lessons were very traditional, and the TV programs were little more than continuous shots of a “talking teacher”. Interestingly, almost all those early lessons were broadcast live. Nowadays, the entire process is much slicker and far more professional. The TV programs are 15 minutes long and feature all kinds of material, including animated graphics and video footage. Watching them, you are unlikely to see the “talking teacher” even for an instant! It takes about 20 days to produce each 15-minute module and costs up to 50,000 dollars. Most programs have a useful life of between five and ten years, depending on the timing of significant changes in subject content and teaching methods.

After students have seen the TV broadcast, the classroom teacher then uses the remaining 45 minutes of each hour to explain the lesson in more detail and to monitor students as they complete related tasks from their special telesecundaria textbooks.

Nationwide satellite transmission of programs began in 1994 (EDUSAT), enabling the coverage to spread far beyond those areas previously served by conventional TV stations. Programs are broadcast daily.

On-line samples

With the advent of the Internet, the telesecundarias are now being revamped as one part of SEP’s “On-line educational TV” (“Televisión educativa en línea“) project. That page has links to currently playing segments of material for various levels, including telesecundaria, and for teachers. (This is also a valuable resource for non-native speakers working to improve their Spanish and/or their knowledge of Mexico.)

Telesecundarias have proved to be an extraordinarily effective way of improving access to, and standards of, junior high education across Mexico. While the “costs of delivery” are estimated to be 16% higher in telesecundarias, on a per student basis, than in regular junior high schools, they are significantly cheaper on a per school basis. This means that some of the nation’s 13,000 or so telesecundarias can function cost-effectively even with only 10 or 12 students in each grade level.

The success of telesecundarias

Are telesecundarias successful? It certainly seems so. An estimated 79.4% of telesecundaria students complete grade 9, compared with an equivalent figure of 78.8% for regular junior highs. In addition, one study has shown that telesecundaria students may start Grade 7 significantly behind other students but generally catch up completely in math and reduce the deficit in language.

The program has been adopted by most Central American countries—Costa Rica, El Salvador, Guatemala, Honduras and Panama—and pilot projects are underway in the USA in California, Colorado, Pennsylvania, Oregon and Florida.

So next time you’re traveling in the wilds of Mexico or Central America, play “I spy” and see how many telesecundarias you can find. Bonus marks should be awarded for any that are outside the normal delivery range of Coca-Cola or Sabritas!

The geography of road transport in Mexico

 Excerpts from Geo-Mexico, Updates to Geo-Mexico  Comments Off on The geography of road transport in Mexico
Oct 202011
 

Mexico’s road network is heavily used, accounting for over 95% of all domestic travel.  On a per person basis, Mexicans travel an average of 4500 km (2800 mi) by road each year.

In this post, we try to answer several general questions relating to the geography of road transport in Mexico.

How many cars are there?

On average there are about seven people per car in Mexico, compared to about six in Argentina, ten in Chile and less than two in the USA and Canada. There are far more cars in urban areas with their many businesses, taxis and wealthy residents. In poor rural parts of southern Mexico, private car ownership is quite rare.

Is there an efficient bus system?

Mexico also has an inter-city bus system that is one of the finest in the world. The nation’s fleet of more than 70,000 inter-city buses enables passengers to amass almost half a trillion passenger-km per year.

Where are Mexico’s vehicles made?

Almost all the vehicles on Mexico’s roads were built in Mexico. Mexico’s automobile-manufacturing sector produces about 2.2 million vehicles a year but the majority of production (about 1.8 million vehicles each year) is for export markets. Mexico is the world’s 9th largest vehicle maker and 6th largest vehicle exporter. In recent years, the relaxation of strict import regulations has resulted in more vehicles being imported into Mexico; many of them are luxury models not currently made in Mexico.

The major international vehicle manufacturers with plants in Mexico include Volkswagen, Ford, Nissan, GM, Renault, Toyota and Mercedes-Benz. Mexican companies include Mastretta, which specializes in sports cars, and DINA, a manufacturer of trucks, buses and coaches.

For more information about vehicle manufacturing in Mexico:

Where are Mexico’s vehicles?

Mexico has about 20 million registered vehicles, about one for every five persons (2005). Which areas have the most and least vehicles? It turns out that the northernmost state, Baja California, has the most with 37 registered vehicles per 100 people. The southernmost states, Chiapas and Oaxaca, have about one sixth as many with 6.6 and 6.9 respectively. In fact there is a very strong statistical relationship between latitude and vehicles (see graph). How can this be?

Scattergraph of latitude and vehicle registrationsWe are not suggesting a direct causal relationship. Many factors are interrelated. First, the states in the north tend to be wealthier; the Spearman rank correlation for GDP/person and latitude is 0.58. Vehicle ownership is closely related to GDP/person (rs = 0.59). Both these correlations are significant at the 99% level.

In addition, northern states are close to the USA, a vehicle-oriented society. However, there are some anomalies to the general pattern. The very wealthy Federal District has 50% more vehicles than would be expected from its latitude alone. States with many migrants, such as Jalisco and Michoacán, also have more vehicles than expected given their latitude. An added complication is that more than a million foreign-plated cars in Mexico (imported temporarily by returning migrants or foreigners) are not included in these figures.

How many road accidents are there in Mexico?

Mexico’s National Council for Accident Prevention estimates that there are 4 million highway accidents each year in Mexico. The latest figures (for 2010) show that there were 24,000 fatalities as a result of these accidents, with 40,000 survivors suffering some lasting incapacity. These figures include some of the 5,000 pedestrians struck by vehicles each year. Traffic accidents are currently the leading cause of death for those aged 5-35 in Mexico, and the second cause of permanent injury for all ages.

Why are there so many accidents?

Driver education plays a major role in road safety. Part of Mexico’s problem is the low budget it allocates each year for road safety—just US$0.40 compared to more than $3.00/person in the USA, more than $7.00/person in Canada and up to $40.00/person in some European countries.

It is no surprise that a high percentage of drivers involved in traffic accidents in Mexico have alcohol in their system. This is one of the reasons why accidents are statistically more frequent in the evenings from Thursday to Saturday. One study reported that as many as 1 in 3 of drivers in Guadalajara was under the influence of alcohol while driving, and 1 in 5 of Mexico City drivers.

Driving without insurance is common in Mexico; according to insurance companies, only 26.5% of Mexico’s 30.9 million vehicles have any insurance.

Related posts:

The GINI index: is inequality in Mexico increasing?

 Updates to Geo-Mexico  Comments Off on The GINI index: is inequality in Mexico increasing?
Oct 012011
 

The GINI index, used to quantify the degree of inequality within a population or country (the higher the value, the more inequality), was introduced in a previous post. In this post we report on the change in GINI index for the member countries of the OECD (Organisation for Economic Cooperation and Development). The OECD regularly publishes updated GINI coefficients. Society at a Glance 2011 – OECD Social Indicators includes the following graph which gives a great view of changes in inequality between the mid 1980s and the late 2000s.

GINI coefficients for OECD members
GINI coefficients for OECD members (OECD, 2011) Click image to enlarge

It is no surprise to see that Mexico’s inequality is almost the highest of any OECD member country. However, the right hand side of the graph shows that the increase in inequality in Mexico over the period was actually smaller than the OECD average, and well below the change in the USA, Canada and several European countries. This suggests that Mexico’s economy is becoming increasingly resilient and economic downturns do not necessarily result in raising inequality in Mexico as much as elsewhere.

It will be interesting to see how Mexico’s GINI index changes in coming years. High levels of economic inequality remain one of Mexico’s most-pressing issues, and one which will be central to the upcoming 2012 elections.

Related posts:

Traffic congestion still a serious problem for commuters in Mexico City

 Updates to Geo-Mexico  Comments Off on Traffic congestion still a serious problem for commuters in Mexico City
Sep 242011
 

An IBM survey of 8,042 commuters in 20 cities on six continents shows that more people are now taking public transport rather than driving. In general, people report that traffic has improved over the past three years.

The survey, entitled Global Commuter Pain, found that commuting in Mexico City was the “most painful” of the 20 cities studied; commuting in Montreal, Canada, was the “least painful”. The survey suggests that infrastructure investments in congested cities are repaid with improved travel times. Mexico City’s investments in public transport over the next few years should help move it away from the bottom place in the rankings.

Mexico City traffic

"Welcome to Mexico City"

Two-thirds of drivers in Mexico City said they had decided not to make a driving trip at least once in the last month due to anticipated traffic conditions. Asked about the longest amount of time they had been stuck in traffic over the past three years, the mean time reported by Mexico City drivers was over two hours. (Drivers in Moscow fared even worse, with 30% reporting delays over three hours).

The index is comprised of 10 issues: 1) commuting time, 2) time stuck in traffic, agreement that: 3) price of gas is already too high, 4) traffic has gotten worse, 5) start-stop traffic is a problem, 6) driving causes stress, 7) driving causes anger, 8) traffic affects work, 9) traffic so bad driving stopped, and 10) decided not to make trip due to traffic.

The cities scored as follows: Mexico City: 108; Shenzhen 95; Beijing 95; Nairobi 88; Johannesburg 83; Bangalore 75; New Delhi 72; Moscow 65; Milan 53; Singapore 44; Buenos Aires 42; Los Angeles 34; Paris 31; Madrid 28; New York City 28; Toronto 27; Stockholm 26; Chicago 25; London 23; and Montreal 21.

  • The IBM report on the 2011 Commuter Pain Survey (pdf file).

Update on Mexico and the UN Millennium Development Goals (MDGs)

 Mexico's geography in the Press, Updates to Geo-Mexico  Comments Off on Update on Mexico and the UN Millennium Development Goals (MDGs)
Sep 222011
 

In a previous post, we looked at Mexico and the UN Millennium Development Goals. This post is the text of a press release issued by the President’s Office in September 2011:

As part of the celebrations of the 50th Anniversary of the United Nations Development Program (UNDP), President Felipe Calderón gave the General Administrator of the Program, Helen Clark, Mexico’s report on the progress achieved in the Millennium Development Goals.

He highlighted the influence of UNDP in Mexico which, throughout its existence, has contributed to the alleviation of poverty and inequality, sustainable human development, the prevention of risks from natural disasters, the implementation of environmental policies and the promotion of democracy.

The main achievements highlighted by the president, regarding the fulfillment of the Millennium Goals, were: achieving universal coverage in primary education, eliminating the education gap between men and women, which eradicated the gender gap in education and increased female empowerment, improvements in the population’s living conditions, through the reduction of mortality and child malnutrition, the sustained increase in life expectancy and specialized care for expectant mothers, the expansion of access to the population’s health services, in which he declared that by the end of this year, universal coverage will be achieved, and the expansion of access to basic services such as safe drinking water, information technologies, communication and decent housing.

The main challenges to be met, said the president, were the alleviation of poverty, improvements in the per capita income and the reduction of the inequality gap. However, he also expressed confidence that they would be fully met in a timely fashion, since he confirmed the fact that the authorities are working continuously to achieve the universalization of pre-school and secondary education, improve the quality of education and improve the Human Development Index through successful programs such as Opportunities and the Popular Insurance Scheme.

The president ended by confirming his commitment to enabling Mexico to fully achieve the values, ideals and agenda set by UN in a timely fashion.

[This post is the text of a press release issued by the President’s Office in September 2011)

The reasons why Mexico is fast becoming a key player in aerospace manufacturing

 Updates to Geo-Mexico  Comments Off on The reasons why Mexico is fast becoming a key player in aerospace manufacturing
Sep 172011
 

In a previous post, we looked at why  Querétaro has become a hub of aerospace manufacturing, home to major manufacturing or research plants for such firms as Bombardier and GE.

In this post we take a further look at the aerospace industry in Mexico, which, according to ProMexico,  the Mexican federal agency that promotes trade and investment, has expanded at 17% a year since 2005. Mexico’s aerospace manufacturing, which began as a relatively simple assembly industry, has evolved today into sophisticated aero-parts and fuselage manufacturing, well supported by specialist education and training programs. In the next phase, Mexico is expected to acquire full service airplane assembly meeting all relevant international design and innovation requirements.

Aerospace parts

The shift in aerospace from simple assembly to complex design, manufacturing and research, echoes what has already happened in some other sectors, such as vehicle manufacture.

Today, the aerospace industry employs 32,000 people in 16 Mexican states. the four most important states for the aerospace industry in Mexico are Baja California, Querétaro, Nuevo León and Chihuahua.

Approximately half the jobs in the sector are located in Baja California, mainly in either Tijuana or Mexicali. The first two aerospace companies to locate in Baja California (in the mid 1960s) were Rockwell Collins and Switch Luz. Today, aerospace firms in Baja California make electronic components, air conditioning systems, cable harnesses, hoses and seals, rustless steel bolts, turbine connector assemblies and blankets for commercial and military aircraft. Honeywell International has been influential in developing aerospace in Baja California since 2007, when it opened a testing facility in Mexicali.

How important is the aerospace sector in Mexico?

  • The number of aerospace manufacturing companies in Mexico is expected to grow from 232 in 2010 to more than 350 in 2015.
  • The aerospace sector is expected to provide 37,000 direct jobs in 2015, 28% more than in 2010
  • Exports of aerospace parts were worth $3.1 billion in 2010, a figure expected to jump to $5.7 billion by 2015.

Aerospace firms

The major factors that have helped Mexico set up and develop aerospace manufacturing are:

  • Mexico has the second largest fleet of private aircraft in the world after the USA,
  • Since 2009, it has become one of the world’s largest recipients of aerospace foreign direct investment
  • Mexican firms meet technical requirements and delivery schedules
  • Mexico offers easy access to raw materials for all phases of production
  • The Mexican market is economically, socially and politically stable
  • The government has offered strong support for the aerospace industry in Mexico. Import duties on aeronautics components were abolished in Mexico in 2007, the same year that Mexico and the USA signed a Bilateral Aviation Safety Agreement to facilitate cross-border aviation-related trade and services
  • Several Mexican states, especially those along the northern border have a well-established industrial infrastructure
  • The proximity of Baja California to the established aerospace industry and important aerospace markets in California, has been an important stimulus to aerospace firms in that state
  • Overall, Mexico offers lower production costs
  • Labor costs are not as cheap as India and China, but that is more than compensated by reduced transport costs. Aerospace parts made in Mexico can reach an assembly plant in the USA in 16 hours by road, compared to about 21 days from China by sea.
  • There is a large pool in Mexico of skilled labor, trained for electronics and auto-parts manufacturing.
  • Mexico’s workers are well educated, with sound engineering and technical skills

The available evidence suggests that there are now more engineering courses and graduates in Mexico each year than in the USA. The number of engineering graduates in the USA has not risen in recent years, and the number of engineering courses has actually declined. In Mexico, the numbers of engineering courses and graduates have both continued to grow at a very rapid rate. Specialist courses are already training students for the aerospace industry. For example the private university CETYS,  with campuses in Tijuana and Mexicali, has added aerospace to its graduate and undergraduate curricula and also offers a Master’s in Aerospace Engineering. Undergraduate programs in aerospace have been introduced at two public universities: the Autonomous University of Baja California and the Tijuana Technological Institute. The Tijuana Technological University has started to train technicians in assembling harnesses for the aerospace industry, modeled on a curriculum developed for a technical school in Toulouse, France (the home of Airbus).

Upcoming trade event:

Mexico is hosting an Aerospace Summit in the city of Chihuahua, October 18-20, 2011, in the Chihuahua Convention Center. (Graphics used above come from the trade event site.)

Sources include:

Mexico’s Fair Trade coffee faces an uncertain future

 Updates to Geo-Mexico  Comments Off on Mexico’s Fair Trade coffee faces an uncertain future
Aug 302011
 

An earlier post looked at why Mexico’s coffee harvest was unlikely to meet expectations this year. The 2010-11 harvest, hit by poor weather, totaled a disappointing 4 million 60-kg sacks (240,000 metric tons), almost entirely Coffea arabica and about 70% destined for export. This post looks at some recent trends relating to the production and consumption of coffee in Mexico.

Mexico is the world’s seventh largest coffee producer (after Brazil, Vietnam, Indonesia, Colombia, India and Ethiopia) and one of the leading suppliers of organic, shade-grown coffee. The nation’s 480,000 coffee growers, most working small parcels of land less than 5 hectares (12 acres) in size, are concentrated in the states of Chiapas, Veracruz and Oaxaca.

Mexico’s domestic consumption of coffee

Despite being one of the world’s leading coffee producers,Mexico’s domestic consumption averages only 1.2 kg (2.6 lbs) per person each year. While this figure has doubled since 2000, is is still only about half the equivalent figure for the coffee-growing Central American nations, and way below consumption in wealthier countries such as world-leader Finland (12 kg per person) or the USA (5.5 kg per person). Domestic consumption is rising but remains low.

Yields need to rise

According to Amecafe (Asociación Mexicana de la Cadena Productiva del Café), a major growers’ organization, global climate change is expected to have an adverse long-term effect on prices and on the sustainability of coffee-farming in Mexico. In an effort to raise yields of coffee to at least 12 quintals/hectare (19 bushels/acre) within 3 years and to 20 quintals/ha (32 bushels/acre) eventually, Mexico’s Agriculture Secretariat has announced financing of 16 million dollars for a program to gradually replace aging coffee groves in 12 states.

Fair trade coffee faces uncertain future

Soaring coffee prices might signal the beginning of the end for Fair Trade coffee. Much of the world’s specialty coffee comes from small-scale growers in Latin America, including Mexico, and much of it is marketed as “organic” or “fair trade”. After a decade of depressed prices, wholesale and retail prices for coffee have risen sharply in the past year. US retail prices have risen more than 20%; the price of coffee on international commodity markets has risen almost 60%.

The higher prices should be good news for growers, but as Kevin Hall points out in “Coffee prices being pushed by speculators” this is not necessarily the case. Many co-operative marketing organizations, including those considered socially-responsible or “Fair Trade”, do not have the resources to pay the new higher prices and acquire sufficient coffee to meet their existing contracts. This means they can no longer compete against the well-financed middlemen who specialize in purchasing coffee for regular distribution via commodities markets and major buyers. Farmers want the maximum return they can get on their crop, and they want it on delivery, which makes life difficult for any fair trade co-operative that lacks strong financial resources.

Further statistics:

  • USDA (US Department of Agriculture) June 2011 update on coffee (pdf file).

Related post:

The extraordinary ecological recovery of Mexico’s Cabo Pulmo Marine Park

 Updates to Geo-Mexico  Comments Off on The extraordinary ecological recovery of Mexico’s Cabo Pulmo Marine Park
Aug 152011
 

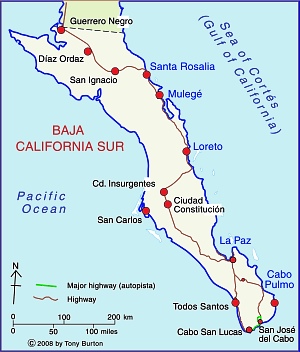
In an earlier post—Can Mexico’s Environmental Agency protect Mexico’s coastline? we took a critical look at proposals for a tourism mega-development near Cabo Pulmo on the eastern side of the Baja California Peninsula. Cabo Pulmo (see map), a village of about 120 people, is about an hour north of San José del Cabo, and on the edge of the Cabo Pulmo National Marine Park (CPNP).

Baja California Sur MapJacques Cousteau, the famous ocean explorer, once described the Sea of Cortés as being the “aquarium of the world.” The protected area at Cabo Pulmo, ideal for diving, kayaking and snorkeling, covers 71 sq. km of ocean with its highly complex marine ecosystem.

Cabo Pulmo is on the Tropic of Cancer, about as far north as coral usually grows. The water temperatures vary though the year from about 20 to 30 degrees C (68 to 86 degrees F).

The seven fingers of coral off Cabo Pulmo comprise the most northerly living reef in the eastern Pacific. The 25,000-year-old reef is the refuge for more than 220 kinds of fish, including numerous colorful tropical species. Divers and snorkelers regularly report seeing cabrila, grouper, jacks, dorado, wahoo, sergeant majors, angelfish, putterfish and grunts, some of them in large schools.

On my last visit to Cabo Pulmo in 2008, local fishermen and tourist guides regaled me with positive comments about the success of the National Marine Park, and the area’s recovery since the area was first protected in 1995. Ever since, I’ve wondered how much their positive take was due to wishful thinking, and how much was due to a genuine recovery in local ecosystems. My doubts have been answered by the publication of Large Recovery of Fish Biomass in a No-Take Marine Reserve in the Public Library of Science (PLoS) ONE journal. The article’s authors present compelling evidence, based on fieldwork, that the area has undergone a remarkable recovery.

Recovery of Cabo Pulmo Marine Park

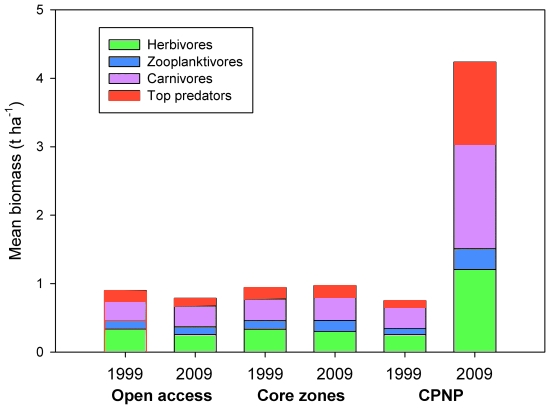
Recovery of fish in the Cabo Pulmo National Marine Park (CPNP). Credit: Aburto-Oropeza et al (2011)

The graph above shows the changes in biomass for three distinct zones of the Sea of Cortés. The open access areas allow commercial fishing. The “core zones” are the central areas of other Marine Parks in the area, including those near Loreto, north of Cabo Pulmo. The CPNP is the Cabo Pulmo National Marine Park, where no fishing is allowed. Clearly, since the CPNP was established, the number and weight of fish inside the park boundaries really have increased rapidly.The total amount (biomass) of fish increased by a staggering 460% over 10 years.

The major reason for the success of the CPNP has been the strength of local residents in undertaking conservation initiatives, and their cooperative monitoring and enforcement of park regulations, sharing surveillance, fauna protection and ocean cleanliness efforts.

The Cabo Pulmo National Marine Park is perhaps the world’s best example of how local initiatives can lead to genuine (and hopefully permanent) environmental protection. The researchers describe it as “the most robust marine park in the world” and say that “The most striking result of the paper… is that fish communities at a depleted site can recover up to a level comparable to remote, pristine sites that have never been fished by humans.”

Here’s hoping that the residents of other parts of Mexico’s coastline threatened by fishing or tourism developments take similar actions and manage to achieve equally positive results for their areas.

Citation:

Aburto-Oropeza O, Erisman B, Galland GR, Mascareñas-Osorio I, Sala E, et al. (2011) Large Recovery of Fish Biomass in a No-Take Marine Reserve. Public Library of Science (PLoS) ONE 6(8): e23601. doi:10.1371/journal.pone.0023601

Further reading:

For an exceptionally informative series of papers (in Spanish) on all aspects of tourism and sustainability in Cabo Pulmo, see Tourism and sustainability in Cabo Pulmo, published in 2008 (large pdf file).

Another valuable resource (also in Spanish) is Greenpeace Spain’s position paper entitled Cabo Cortés, destruyendo el paraíso (“Cabo Cortés: destroying paradise”) (pdf file)

US firms are near-shoring jobs from China to Mexico

 Mexico's geography in the Press, Updates to Geo-Mexico  Comments Off on US firms are near-shoring jobs from China to Mexico
Aug 112011
 

 Near-shoring means “the transfer of business or IT processes to companies in a nearby country, often sharing a border with your own country” (definition from SourcingMag.com). It is closely related to offshoring, now usually limited to similar transfers as near-shoring, but to more distant locations. Among the best examples of near-shoring are the hundreds of US companies that have set up factories and assembly plants in Mexico under the long-running maquiladora program (analyzed in detail in chapter 20 of of Geo-Mexico: the geography and dynamics of modern Mexico).

Maria Elena Rigoli, the President of Collectron International Management Inc., which helps companies make the move from the USA to Mexico, was interviewed about near-shoring for the 20 December 2010 issue of Food Manufacturing News. Despite reflecting her obvious vested interests,  the transcript of the interview is still interesting reading for geographers.

Rigoli first explains how Mexico’s maquiladoras work and then lists the major benefits of moving a company’s operations to Mexico:

  • Extremely fast shipping times offered by such a close location
  • Reduced labor costs
  • Trade agreements with many different countries, including NAFTA
  • Decades of experience in manufacturing and exporting
  • Highly-skilled, well-educated workforce

Quotes from the interview:

“Mexico is one of the world’s five largest developing economies. Global market research firm EuroMonitor International forecasts that Mexico will replace Italy as the 10th largest economy in the world within the next decade.”

“The technology used when producing goods in [Mexico’s] maquilas is the same or superior to that in the United States, as technology is typically transferred by the contracted companies individually. Additionally, the large pool of educated technicians coming out of Mexico’s many technical universities are trained to assemble, package, test and manufacture products in a maquiladora setting. This training is either on par or above the average training manufacturing personnel receive north of the border.”

“The growth of Mexico’s share in the aerospace industry speaks volumes about the craftsmanship and quality of products produced in Mexico. Originally, companies like Boeing and Bombardier only outsourced high volume-low tech operations to Mexico, now entire fuselages are designed and built here.”

How do Rigoli’s claims match up to what is happening today?

Well, among the numerous press reports that US manufacturers have started ‘near-shoring’ work from Asia to Mexico, is this one in Asian Shipper., that quotes figures from a survey conducted by consultancy AlixPartners of 80 big US companies.

The survey found that:

  • 9% have already shifted some or all of their operations from Asia to the Americas (= near-shoring).
  • 33% are considering doing it in the next three years

Is Mexico the most attractive location for near-shoring?

  • 63% say, “Yes!”
  • 19% think the USA is better.

What are the major advantages of near-shoring?

  • 30% said lower freight costs
  • 25% said speed-to-market
  • 18% claimed lower inventory costs
  • 16% said time-zone advantages such as easier management coordination
  • 11% liked closer cultural ties with North American managers.

What started as a trickle of US firms moving manufacturing back from China to Mexico seems to be becoming a clear trend. Globalization may have expanded the reach of many such US firms, but near-shoring now seems to be pulling some of them back, closer to home.

Related posts:

Aug 062011
 

The 2010 censuses in the USA and Mexico have led to numerous reports on either side of the border. This post looks mainly at recent reports from the Pew Hispanic Center, a project of Pew Research Center, which describes itself as”a nonpartisan ‘fact tank’ that provides information on the issues, attitudes and trends shaping America and the world.”

The total US population in 2010 was 308.7 million. The Pew report entitled U.S. Hispanic Country of Origin Counts for Nation, Top 30 Metropolitan Areas says the the USA had 50.5 million Hispanics in 2010, including 31.8 million of Mexican origin (63% of all Hispanics). [The categories are based on self-described family ancestry or place of birth in response to questions in the 2010 Census and the 2009 American Community Survey.] The population of Mexican-origin grew by 54% (11.2 million) between 2000 and 2010. Mexicans are the dominant Hispanic group in many major metropolitan areas, from Los Angeles to Chicago, and San Antonio to Atlanta, with some exceptions in the East, including Miami (Cubans) and New York (Puerto Ricans).

The report is accompanied by detailed statistical profiles, including Statistical Profile: Hispanics of Mexican Origin in the United States, 2009 that provides a concise summary of all the key data about the Mexican diaspora in the USA.

The Pew Hispanic Center has also updated its interactive maps and database on the USA’s Latino population. Data can be viewed by county for 1980, 1990, 2000 and 2009 and reveal the shifting patterns of residence of the Hispanic population since 1980.

Another Pew report, The Mexican-American Boom: Births Overtake Immigration shows that, since 2000, births have overtaken immigration as the main driver for the dynamic growth of the Mexican population in the USA. This is because:

  • Mexican-Americans are younger (on average) and have higher fertility than other US groups, and
  • The numbers of Mexicans migrating to the USA has fallen. Mexico’s 2010 census revealed that emigration from Mexico to the USA has dropped significantly in recent years, from an average of 480,000/year in 2000—2005 to around 145,000/year for 2005—2010.

Hispanics in the USA lag behind the rest of the population in terms of education. For example, only 9% of Mexicans in the USA aged 25 and over have at least a  Bachelor’s degree, compared with 13% of all Hispanics in the USA and over 20% for the US population as a whole. This is reflected in median earnings, where the average personal earnings for Mexicans in the USA aged 16 and over was $20,000 in 2009, compared to $28.900 for the US population as a whole.

A Presidential Advisory Commission has been formed to look at ways to improve the academic achievement of Hispanics, the largest and fastest-growing minority in the public education system.

The growing number of Hispanics in the USA has meant that Hispanics are now looking to have a greater say in politics. This has led to the formation of the Tequila Party, a nonpartisan movement launched on 5 May (Cinco de Mayo) 2011. Their first political rally, a call to “get out and vote”, accompanied by mariachis, was held in Tucson, Arizona.

How will reduced out-migration impact Mexico’s total population?

 Updates to Geo-Mexico  Comments Off on How will reduced out-migration impact Mexico’s total population?
Jul 192011
 

As described in an earlier post –Is massive Mexican migration to the USA a thing of the past?– we examined a 6 July 2011 New York Times article which indicated that Mexican migration to the USA had slowed to barely a trickle. If this is correct, Mexico’s population will be considerably higher in future years. This post estimates what this impact will be.

In another post –Projecting Mexico’s population: when, if ever, will it stop growing? – we incorporated the results of Mexico’s 2010 census and 2008 migration estimates into the most recent official population projection available from the Mexican Government’s CONAPO (Spanish acronym for National Population Commission). This analysis indicated that Mexico’s population would peak at 140.5 million in 2043, rather than the 130.3 million indicated in the older CONAPO projection.

If net migration becomes zero in the future, as suggested in the New York Times article, Mexico’s population will peak at 149.3 million in 2051. If net migration in future years is between the 2008 estimate of 203,000/year and zero, say 100,000/year, then the Mexican population will peak at 144.9 million in 2049. Clearly, the variation in these projections of almost nine million (149.3 verses 140.5) is quite significant. Given these different projections, our current thinking is that Mexico’s population will probably peak at around 145 million about mid-century.

Though population projections based on birth and deaths rates tend to be fairly accurate, net migration projections are far more precarious. Actual net migration between the two countries will depend on a wide range of future socio-economic variables for both countries. The most obvious of these variables will be fertility rates, growth of the working age population, education opportunities, economic growth, trade regulations and trends, job availability, unemployment rates, and personal preferences of both workers and retired people. There undoubtedly will be surprises such as technology changes or climate change. Some of these may have very profound impacts on migration, and therefore on total population levels.

Migration between Mexico and the USA is the focus of chapters 26 and 27 of Geo-Mexico: the geography and dynamics of modern Mexico. Explore the book using Amazon.com’s Look Inside feature; buy your copy today!

Mexico’s GDP/person reaches all-time high

 Updates to Geo-Mexico  Comments Off on Mexico’s GDP/person reaches all-time high
Jul 132011
 

According to the National Statistics agency (INEGI), Mexico’s GDP/person broke all records in the first quarter of 2011 to reach 9,985 dollars/person, 15% higher than the equivalent period of 2010. The rise is due to continuing economic growth, coupled with the strength of the Mexican peso against the US dollar and other major currencies.

Mexico maintains its position as the world’s 11th largest economy. Mexico’s total GDP reached 13.588 trillion pesos (about 1.680 trillion dollars) in the past 12 months, 62.2% of which came from the tertiary (services) sector, 35.9% from manufacturing and 3.7% from primary activities.

Is massive migration of Mexicans to the USA a thing of the past?

 Updates to Geo-Mexico  Comments Off on Is massive migration of Mexicans to the USA a thing of the past?
Jul 122011
 

Many people in the USA continue to blame undocumented Mexican immigrants for the country’s unemployment problems. These complainers do not seem to realize that the flow of undocumented Mexicans across the border has slowed to barely a tickle.

The total number of Mexican immigrants peaked at about 550,000 in 2006 [see chapter 26 of Geo-Mexico: the geography and dynamics of modern Mexico). That year over one million entered the USA and just under half a million returned to Mexico. With the economic recession and higher unemployment, the figure dropped to 203,000 by 2008. According Dr. Douglas S. Massey, co-director of the Mexican Migration Project at Princeton University, the flow of undocumented immigrants from Mexico may have stopped altogether. He states in a July 6, 2011 article in The New York Times by Damien Cave that, “For the first time in 60 years, the net traffic has gone to zero and is probably a little bit negative.”

While there are no hard data to back up Dr. Massey’s claim, the Pew Hispanic Center and most other experts think that net immigration of Mexicans, particularly undocumented migrants, to the USA has declined dramatically in recent years.

The New York Times article cited above suggests that the most important reasons for this observation are improved employment and educational opportunities in Mexico, rising border crimes, and reduced fertility levels in Mexico. It also mentions stricter US border enforcement, the greater danger and expense of illegal crossing, and tougher state immigration laws such as those in Arizona and Georgia.

The article also points out that the US Consulate in Mexico has changed its procedures, making it significantly easier for Mexicans to get temporary work visas (H-2A) as well as tourist visas. While this might reduce the number of undocumented immigrants, it undoubtedly has increased the number of both legal and total immigrants. Obviously some of those entering the USA with a temporary work or tourist visa might overstay their visa and become undocumented.

Scattergraph of US unemployment and net Mexican migration

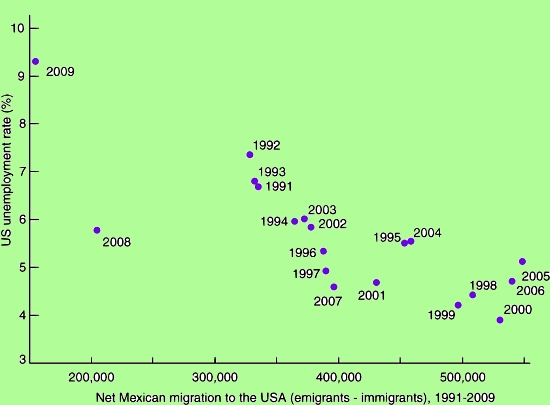
Scattergraph of US unemployment and net Mexican migration Credit: Geo-Mexico; all rights reserved

It is interesting to us that The New York Times article says very little about the impact of very high US unemployment rates on the rate of immigration. Our analysis of data between 1990 and 2009 indicates that there is a strong negative correlation between the US unemployment rate and net Mexican immigration to the USA (see graph, r = -0.8, significant at the 95% level). While the reasons for reduced immigration cited in the article are all valid factors, it still remains to be seen if immigration will jump back up to about half a million a year when, and if, jobs in the USA become plentiful again and unemployment rates drop to the relatively low levels of 1998–2006.

Migration between Mexico and the USA is the focus of chapters 26 and 27 of Geo-Mexico: the geography and dynamics of modern Mexico. Explore the book using Amazon.com’s Look Inside feature; buy your copy today!

Less water available each year in Mexico as population increases

 Updates to Geo-Mexico  Comments Off on Less water available each year in Mexico as population increases
Jul 052011
 

Data from the National Statistics Institute (INEGI) show that Mexico’s available water has fallen to 4,263 cubic meters/person/year. Water availability depends on the amount of rainfall received each year and on total population. Mexico’s water availability has declined rapidly since 1950, when it was 18,053 cubic meters/person/year. Of 177 countries analyzed by the Food and Agriculture Organization (FAO), Mexico ranked 90th in terms of water availability.

According to INEGI, Mexico’s total current demand for water nationwide is 78.4 billion cubic meters/year, 11.5 billion more than natural replenishment rates. The drainage basins facing the most severe shortfalls are the Lerma basin in central Mexico, and the Río Grande in northern Mexico.

On the positive side, Mexico reached its UN Millennium Development Goal target for access to water 10 years early, by reducing the percentage of population without access to water in their homes from 25% in 1990 to less than 8% in 2010.

Mexico has also already met its target for improving access to wastewater drainage, where the proportion of the population lacking access to sewage systems has fallen from 37% in 1990 to 10% in 2010.

Mexico’s water resources and water-related issues are the subject of chapters 6 and 7 of Geo-Mexico: the geography and dynamics of modern Mexico. Ask your library to buy a copy of this handy reference guide to all aspects of Mexico’s geography today! Better yet, order your own copy…


Key geographic indicators from Mexico’s 2010 Census

 Updates to Geo-Mexico  Comments Off on Key geographic indicators from Mexico’s 2010 Census
Jun 202011
 

This post summarizes some important characteristics of Mexico’s population and households, as revealed by the definitive results of the 2010 population census.

Literacy

5.3 million Mexicans over the age of 15 are unable to read and write a simple message (i.e. they are functionally illiterate). The highest rates of illiteracy are in Chiapas (17.0%), Guerrero (16.7%) and Oaxaca (16.3%), with the lowest rates in Mexico City (2.1%), Nuevo León (2.2%) and Baja California and Coahuila (both 2.6%).

Average Age

The average age of Mexico’s population has risen from 22 years in 2000 to 26 years in 2010. In 2010, 29% of the population was under the age of 15 (compared to 34% in 2000) and 6.3% was in the 65+ age group (compared to 5.0% in 2000).

Dependency ratios

The dependency ratio of a population is worked out by comparing the number of people of working age (normally taken to be 15-64 years old) with the number of young people (under age 15) and elderly (65+ years old). The dependency ratio has shifted from 64 dependents in every 100 people (64/100) in 2000 to 55/100 in 2010. More significantly, of the 64 dependents in 2000, 56 were children and 8 were elderly, whereas of the 55 in 2010, 45 were children and 10 were elderly. This is a clear shift towards an “elderly-dependent” population.

Fertility and education

The 2010 census shows that women of child-bearing age (15-49) have had an average of 1.7 children each, compared to 2.0 children in 2000. The averages mask enormous differences in rates. For example, women with a senior high school (preparatoria) education have 1.1 children on average, compared with 2.5 children for women who only completed secondary school, 3.3 children for those who completed primary education, and 3.5 children for those without any formal education.

Household possessions

Almost all (93%) of Mexico’s 35.6 million households have at least one TV, 82.1% have refrigerators, 65% cell phones, 45% have a vehicle, 43% a fixed telephone line, 29% a computer, and 21% have Internet access.

Wildlife trafficking in Mexico: how many wild parrots are illegally captured each year?

 Mexico's geography in the Press, Updates to Geo-Mexico  Comments Off on Wildlife trafficking in Mexico: how many wild parrots are illegally captured each year?
Jun 142011
 

In this post we return to The thorny issues of plant and animal trafficking and biopiracy in Mexico. We highlight several recent news items related to wildlife trafficking, as well as an important survey of the illegal parrot trade in Mexico.

Mexican police launched dozens of raids on stores and markets in March 2010, looking for illegally-traded plants and animals. They collected more than 4500 live specimens, representing more than 110 different species, ranging from cacti and orchids to tropical fish, parrots, reptiles and puma cubs. The mortality rate while transporting illegally-traded animals is more than 90%, according to wildlife experts.

The following month, Mexican federal police rescued 10 tigers and jaguars held captive in Cancún as a tourist attraction, while in June 2010, police at Mexico City’s international airport arrested a Mexican traveler who arrived from Peru with 18 tiny endangered monkeys strapped around his waist. Anyone convicted in Mexico of the illegal trafficking of animals can be sentenced to up to nine years in prison.

The scale of Mexico’s animal-trafficking problem is staggering. For example, according to the Defenders of Wildlife Mexico Program, “It is estimated that between 65,000 to 78,500 parrots are caught illegally every year.” (“The Illegal Parrot Trade in Mexico: A Comprehensive Assessment“)

The states with the worst records for numbers of parrots taken in the wild are Oaxaca and Chiapas (15,000 parrots a year each), Nayarit (12,500), Campeche (10,000) and Guerrero (5,000). Most of these parrots are thought to stay in Mexico, though up to 9,000 a year taken across the border into the USA.

Thick-billed Parrot in captivity

Thick-billed Parrot in captivity

Most of the trafficking in wildlife is carried out by organized international crime networks. Mexico is a major hub for the international trade in wildlife, both because of its rich biodiversity, and because of its proximity to the USA, one of the world’s largest markets for exotic plants and animals. The global trade in illegal wildlife is thought by Interpol to be worth $20 billion a year.

Related posts:

Chapter 5 of Geo-Mexico: the geography and dynamics of modern Mexico focuses on ecosystems and biodiversity.  Chapter 30 analyzes environmental issues and trends including the impact of Old World species imported by the Spaniards, current environmental threats, and efforts to protect the environment.  Buy your copy today to have a handy reference guide to all major aspects of Mexico’s geography!


Marriage declining among Mexican couples

 Updates to Geo-Mexico  Comments Off on Marriage declining among Mexican couples
May 312011
 

Mexican couples still prefer marriage over the alternatives, but not as strongly as in the past. According to the 2010 census, 40.5% Mexicans age 12 and over were married, down from 44.5% in 2000 and 45.8% in 2009. The 11% decline since 1990 does not sound like much, but is significant when the data are investigated more deeply.

Because the data include all Mexicans over age 12, it is not surprising that 35.2% were single in 2010, compared to 37.2% in 2000 and 40.6% in 1990. The 13% drop since 1990 in the percentage for singles is mostly a result of the relative decline in the total number of teenagers, most of whom are unmarried, as a consequence of the decline in fertility over the past few decades.

The most impressive growth was for “free union” couples, those living together but not married. In terms of population, the proportion went from 7.4% in 1990 to 10.3% in 2000 and 14.4% in 2010, almost double the 1990 level. If we compare married couples with those in free union, we get an even clearer picture of the trend. In 1990, 13.9% of all couples lived in a “free union”; this figure increased to 18.8% in 2000 and 26.2% in 2010.

While roughly three of every four couples in Mexico are married, this varies significantly from state to state. It is not surprising that the least Catholic state—Chiapas— has the most couples living in “free union” – 38.8%. Chiapas also is one the most heavily indigenous states. But even in Chiapas, over six in ten couples are married. Other states with high rates of “free union” couples are Baja California (35.5%), Nayarit (34.5%), Baja California Sur (34.4%) and Quintana Roo (34.4%), a state with relatively few Catholics and a substantial indigenous population. The most Catholic state of all—Guanajuato—has the fewest “free union” couples, only 13.4%. Other states with relatively few unmarried couples are Yucatán (14.1%), Zacatecas (15.3%), Nuevo León (15.6%) and Aguascalientes (16.0%).

The census also includes three additional categories which all have increased rather rapidly since 1990. Those widowed went from 3.6% in 1990 to 4.3% in 2000 and 4.4% in 2010. This probably is a function of increasing life expectancy and people living longer on their own after their spouse dies, especially if the death resulted from an accident or violence. Separation, though still rather rare, is becoming more common, increasing from 1.2% in 1990 to 2.6% in 2000 and 3.7% in 2010. Divorce is also quite uncommon but increasing, from 0.7% in 1990 to 1.0% in 2000 and 1.5% in 2010.

Religious diversity is increasing in Mexico

 Updates to Geo-Mexico  Comments Off on Religious diversity is increasing in Mexico
May 282011
 

Mexico is still considered to be a Catholic country, but it is slowly becoming less Catholic. In the 2010 census 82.7% said they were Catholics compared to 88.0% in 2000 and 89.7% in 1990. In a recent report, Sociologist Roberto Blancarte, who specializes in research into religions, claims that for each day of the last decade, more than 1,000 Mexicans left the Catholic Church. He concludes that Catholicism is “destined to be abandoned” in Mexico.

Conversely, the percentage of the population who declared themselves non-Catholic went from 12.0% to 17.3% in 2010, almost a 50% increase.

The percentage of Protestants or Evangelicals increased to 9.7% in 2010 from 5.2% in 2000 and 4.9% in 1990. The proportion following “Other Religions” was 2.5% in 2010, 2.4% in 2000 and 1.5% in 1990. While the percentages in these latter two groups are rather low, Mexicans in non-Catholic religions tend to be far more religiously active than the majority of those who consider themselves Catholics. A total of 4.6% indicated that they had no religion in 2010, compared to 3.5% in 2000 and 3.2% in 1990.

Women tend to be more religious than men and more apt to have specified religions. About 5.5% of males indicated that they had “No Religion” compared to 3.9% for women. Women were a bit more likely to indicate they were Catholics (83.1% versus 82.3%) or Protestants or Evangelicals (10.2% versus 9.2%).

Western Mexico is still the most Catholic area of the country, though other religions are gaining converts. The state with the highest proportion of Catholics is Guanajuato with 93.8% followed closely by Zacatecas with 93.5%. Other states with over 90% Catholics are Querétaro, Jalisco, Michoacán, and Tlaxcala.

The least Catholic states are in Southern Mexico, led by Chiapas where only 57.8% are Catholic. Over 27% in Chiapas are Protestants or Evangelicals and 12% indicated that they had “No Religion.” Other states with under 65% Catholics include Campeche, Quintana Roo and Tabasco. The percentage Catholic in Oaxaca is just over 80% which seems surprisingly high given that Oaxaca is a southern state and has the largest proportion of indigenous-language speakers.

Related posts:

The geography of Mexico’s religions is discussed in chapter 11 of Geo-Mexico: the geography and dynamics of modern Mexico. Ask your library to purchase a copy today!

Two examples of trans-border air pollution on the Mexico-USA border

 Excerpts from Geo-Mexico, Updates to Geo-Mexico  Comments Off on Two examples of trans-border air pollution on the Mexico-USA border
May 262011
 

Poor air quality is known to have significant economic and social impacts, including adverse health risks and a lower quality of life. In this post, we examine two examples of trans-border air pollution. We analyze the causes of poor air quality, and describe the strategies being adopted on either side of the Mexico-USA border to improve air quality.

Does air pollution from maquiladoras in Ciudad Juárez affect people’s health?

The worst air pollution along the USA–Mexico border is in Ciudad Juárez in Chihuahua, located across the Río Grande from the city of El Paso in Texas. It is often claimed that this is because of Mexican authorities’ poor enforcement of environmental laws and the high number of maquiladora firms operating in the city.
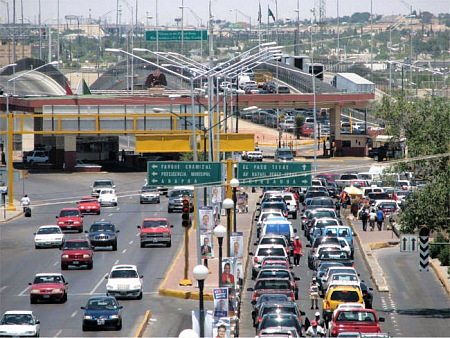
Mexico-USA border traffic in Ciudad Juárez

Mexico-USA border traffic in Ciudad Juárez

Air pollution does adversely affect the health of Ciudad Juárez’s 1.4 million residents, resulting in a higher incidence of respiratory diseases and premature mortality. However, most of the pollutants related to these health issues do not come from the 300 or so maquiladora factories but from dirt roads, vehicles and family-run brick kilns. Industry, including the brick kilns, accounts for only 17% of total sulfur dioxide emissions, and less than 1% of total particulate emissions. Services account for 44% of the sulfur dioxide emissions, and transport a further 38%. Most particulates came from unpaved roads (65% of the total) and from wind-blown soil erosion (31%). Almost all the carbon monoxide (99%) and nitrogen oxide (92%) added to the air came from transportation. (Blackman, A., Batz, M. and Evans, D. 2004 “Maquiladoras, Air Pollution, and Human Health in Ciudad Juárez and El Paso. April 2003, updated July 2004.”)

Socio-economically poor areas are more affected by bad air quality than richer areas, but this is due to the precise location of the small-scale brick kilns, which have no pollution controls, rather than to the locations of maquiladora plants. Most of the city’s 350 brick kilns are in densely populated low-income residential neighborhoods such as Anapra, Division del Norte, Fronteriza Baja and Waterfill.

When the kilns were first built, these areas were on the perimeter of the city, but they have since been enveloped by urban sprawl. The health damages arising from the brick kilns are estimated at almost $50 million a year in Ciudad Juárez and an additional $13.4 million a year in El Paso.

How are the cross-border twin cities of Nogales (Sonora) and Nogales (Arizona) trying to improve their air quality?

Further west, the border cities of Ambos Nogales (Both Nogales) share many of the same air quality issues as Ciudad Juárez. Nogales in Sonora has a population of about 250,000, more than ten times that of its cross-border twin in Arizona. Inevitably (given the size differential) most of the pollution, including dust and vehicle emissions, comes from south of the border. Air quality is also adversely impacted by natural hazards such as wildfires in the region. The air in Nogales, Arizona, regularly fails to meet the US Environmental Protection Agency’s limits for coarse particulate (PM10) pollution.

However, now, according to a recent news report, steps are being taken to ameliorate the air pollution in Ambos Nogales by authorities either side of the border.

On the Mexican side, reliable air quality monitoring systems are being installed, with the financial help of international agencies. The Sonoran state government has started a priority program to pave dirt roads in the vicinity of Nogales, responsible for an estimated 9,000 metric tons of dust each year. In the next phase, tighter controls are needed on factory emissions and on the burning of waste.

On the US side, the Arizona Department of Environmental Quality is trying an innovative approach, using federal funds to pay Mexican truck owners to replace their old, leaky mufflers with state-of-the-art catalytic converters. Each conversion costs about $1600. The program should eventually reduce harmful emissions from the particle-spewing diesel-burning trucks by 30%. The next item on the agenda for the US side should be to reduce the waiting times for all trucks crossing the border, so that emissions are further reduced.

We will look at the success (or failure) of these strategies to ameliorate trans-border air pollution in a future post.
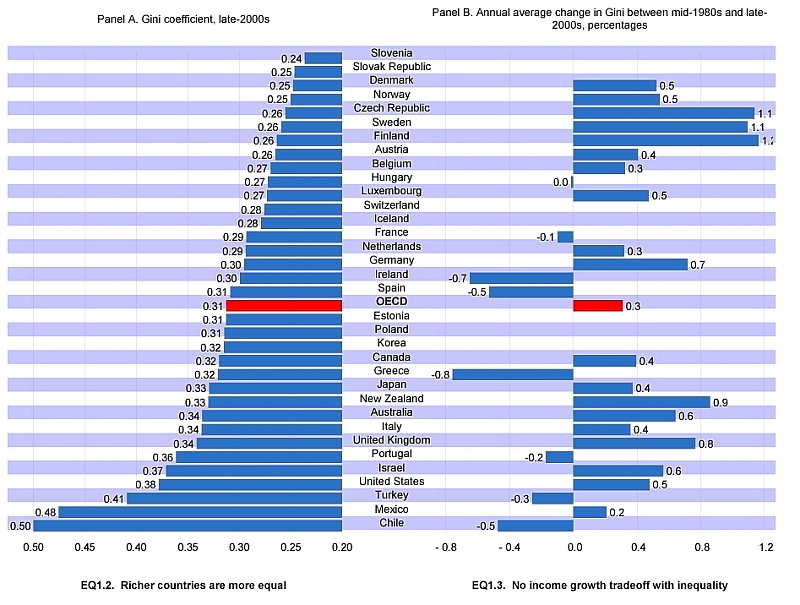
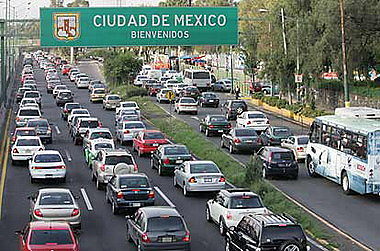
Mexico’s population is aging fast

 Updates to Geo-Mexico  Comments Off on Mexico’s population is aging fast
May 232011
 

Mexico’s population has aged significantly in the past two decades. In 2010, the median age was 26 years meaning that there were equal numbers of people above and below age 26. The median age in 2000 was 22 years while that in 1990 was only 19 years. Obviously, the number of older adults is growing much faster than the number of young adults and children. The Federal District has the highest median age by far with 31, followed by Nuevo León, Tamaulipas and Veracruz with 27. At the other end are Chiapas with 22, Guerrero with 23, and Puebla, Guanajuato, Durango and Aguascalientes with 24.

In 2010, about 29.3% of the Mexican population was under age 15 compared to 34.1% in 2000 and 38.6% in 1990. On the other hand, the 2010 census indicates that 6.3% are over age 65, up from 5.0% in 2000 and only 4.2% in 1990. The proportion in this older age group increased 50% in the past two decades. These changes are quite dramatic and represent major demographic change. The trend is expected to continue and have significant implications for education and elder care systems.

The group in the middle, those between ages 15 and 65, has increased from 57.2% in 1990, to 60.9% in 2000 and 64.4% in 2010. This trend of increasing working age population contributes to greater economic growth as does the proportion of women entering the work force :

Of course, the growth in workforce can only contribute to economic growth if there are sufficient employment opportunities.

Mexico’s current age-sex structure is graphically presented in the 2010 population pyramid depicted in an earlier post:

Projecting Mexico’s population: when, if ever, will it stop growing?

 Updates to Geo-Mexico  Comments Off on Projecting Mexico’s population: when, if ever, will it stop growing?
May 172011
 

Between 2000 and 2010, Mexico’s population grew over 15% from 97.362 million to 112.337 million. While this is less than the 20% growth experienced between 1990 and 2000, it is still relatively fast. Will Mexico’s population ever stop growing? To answer such questions, demographers make population projections based on rates of births, deaths and net migration.

The most recent official population projection available from the Mexican Government’s CONAPO (Spanish acronym for National Population Commission) website estimates the Mexican population from 1990 to 2050. It estimates that the population will peak at 130.3 million in 2044 and decline gradually thereafter. This projection is many years old and does not incorporate the data from the 2010 Mexican census nor the impact on immigration of the employment recession in the USA.

In an attempt to get a better handle on Mexico’s future population dynamics until 2050, we conducted a simplified update of the CONAPO projections by using the 2010 census figures, more current net migration figures and adjusted natural population growth rates. Given the uncertain future of job opportunities in the USA for Mexican immigrants, we make the very simple assumption that net immigration from Mexico in the future will remain at 203,000 per year, the most recent figure available. (Pew Hispanic Center, “Mexican Immigrants: How Many Come? How Many Leave?” July 22, 2009, Washington, D.C.) The Pew numbers are limited to net Mexican migration to the USA, but that migration stream represents almost all Mexican migrants.

To obtain the correct 2010 census figure, the CONAPO values for natural population increase need to be upped by about 10%, an increase of only 0.122 percentage points in 2011 (from 1.222% to 1.344%), and progressively less in subsequent years. Using these two adjustments, we estimate that Mexico’s population will peak at 140.5 million in 2047. This is more than ten million more than the original CONAPO projection on 130.3 million.

With higher net emigration, the population peak will be lower and arrive earlier. For example, if net migration is set at 360,000 per year (the average for 2011 through 2050 used in the CONAPO projection, and about 66% of the net migration in 2005 before the recession), the population will peak at 134.5 million in 2043.

Without a doubt, accurate forecasts of net migration are needed for reliable population forecasting. If the CONAPO rate of natural increase is upped by only 5%, (instead of 10%), to 1.283% in 2011, the population will peak at 135.2 million in 2044. The compounding of this change of about one twentieth of one percent results in a change of over five million in Mexico’s eventual peak population.

Until CONAPO, or some other reputable demographic agency, makes a new population projection for Mexico, we can probably safely say only that Mexico’s population will peak at between 135 and 140 million sometime between 2040 and 2050.

Related posts:

Are Mexican females overtaking males in literacy?

 Updates to Geo-Mexico  Comments Off on Are Mexican females overtaking males in literacy?
May 142011
 

For at least the last century, literacy for Mexican males has been significantly higher than that for females. According to the 2010 census 93.7% of Mexican males aged 15 and over were literate compared to only 91.1% of females. Males have higher literacy levels in all 32 Mexican states except for Sinaloa (males – 94.1%, females – 94.7%) and Sonora (males – 96.2% and females – 96.3%). We introduced the spatial aspects of literacy in Mexico in an earlier post:

The greatest gaps between literacy among males and females are in states with relatively low literacy levels (Pearson correlation = 0.89). For example, in Chiapas male literacy is 86.0% while that for females is only 77.5% for a difference of 8.5%. Other states with large gaps are Oaxaca (87.3% – 79.4%, gap of 7.9%), Guerrero (85.4% – 79.8%, gap of 5.6%), and Puebla (91.7% – 86.8%, gap of 4.9%). The data suggest that as literacy levels in states increase, the gap between males and females should decline.

Will the gap between male and female literacy levels decline in the decades ahead? Date from the 2010 census indicates that both illiteracy rates and the gap between males and females are far greater for older Mexicans. For those over age 75, male literacy is 71.2% while that for females is only 62.3% resulting in a gap of 8.9%. The gap is 8.4% for those between 60 and 74 years of age (83.3% versus 74.9%) and 4.4% for the 45 – 59 age group (93.1 versus 88.7%). The gap for those between 30 and 44 years of age is only 1.1% (96.4% versus 95.3%) and for the 15 to 29 age group, males and females are equal at 98.1%.

Does this trend suggest that female literacy will surpass male literacy in the future? The answer to this question appears to be yes. Data from the 2010 census on children between ages six and 15 indicates female literacy (87.32%) is already 1.33% higher than male literacy (85.98%). These levels seem rather low because literacy levels for children below age ten, particularly males, are generally lower. For example, among children age seven, literacy for females is 3.06% higher than that for males (73.91% versus 70.85%). That nearly 30% of seven-year-olds are illiterate suggests a problem; but most of these will become literate by age 15. Among children between age 14 and 15, female literacy is 98.40% compared to 98.09% for males.

The census provides data on the literacy of children for each age between age six and 15 for all 32 Mexican states. Literacy rates for female children are higher than those for males in all 288 observations (9 age groups times 32 states), expect for five (ages 11, 12, 13 & 14 in Chiapas and age 12 in Tlaxcala).

The largest gap between females and males is 4.6% for six-year-olds in Zacatecas (females – 43.51%, males – 38.91%). Other large gaps exist for seven-year-olds in Zacatecas (4.41%), six-year-olds in Querétaro (4.37%), seven-year-olds in Tamaulipas (4.34%), and seven-year-olds in Tabasco (4.33%). These findings are consistent with other evidence indicating that females develop language skills at younger ages than males. The data clearly indicate that female literacy is surpassing male literacy. Perhaps more importantly, both males and females are now approaching universal literacy.

We assume that the literacy gap between female and male children will continue in future decades. After a decade or two, we expect adult literacy rates for females to catch and surpass those for males. On the other hand, this gap will be very small because Mexico is quickly approaching universal literacy. When data become available we will analyze the gap in total years of education between females and males. We expect the situation in Mexico to move slowly towards the pattern in the USA, where females now have more years of education and more university degrees than males.

Literacy rates are, of course, only one of the many aspects of gender inequality in Mexico.

Why did CONAPO underestimate Mexico’s population by almost two million people? Mexico’s changing population dynamics

 Updates to Geo-Mexico  Comments Off on Why did CONAPO underestimate Mexico’s population by almost two million people? Mexico’s changing population dynamics
May 122011
 

Making population projections is risky business. Birth and death rate trends can change unexpectedly. Perhaps more difficult to forecast accurately, in Mexico’s case, are international migration rates. The most recent official population projection available from the Mexican Government’s CONAPO (Spanish acronym for National Population Commission) website estimates that the Mexican population will peak at 130.3 million in 2044, before declining gradually thereafter. However, this projection is many years old, and does not incorporate the data from the 2010 Mexican census, nor the impact on immigration of the employment recession in the USA.

CONAPO projected that Mexico’s total population in 2010 would be only 110,619,340, about 1.7 million fewer than the 2010 census figure of 112,336,538. Their estimate for net migration for 2005 to 2009 was 2,012,904, which is quite close to the more recent Pew Hispanic Center figure of 2,036,000 (“Mexican Immigrants: How Many Come? How Many Leave?” July 22, 2009). The Pew numbers are limited to net Mexican migration to the USA, but that migration stream represents almost all Mexican migrants.

However, the two sources have very different values for individual years. The CONAPO net migration projection gradually increased from 400,000 in 2005 to 405,000 in 2009, peaking at 406,000 in 2011 and gradually declining to 303,000 in 2050. The more current Pew estimates reached 547,000 in 2006-2007, before declining to 374,000 for 2007-2008 and only 203,000 for 2009-2009. Current evidence and continued lack of real job opportunities for Mexicans in the USA suggests that net migration has stayed at about this level for the past few years.

The CONAPO projection forecasts that the Mexican rate of natural population increase would decline gradually from 1.39% per year in 2005 to 0.06% per year in 2050. The average of the values they used for 2005 to 2010 was 1.313% per year. Using the actual 2010 census figure and the Pew migration numbers, we calculate that the actual average rate of natural increase for 2005 to 2010 was 1.443%. This suggests that the actual rates of natural increase were about 10% higher than the values used in the CONAPO projection. Apparently, birth rates in Mexico did not decline as fast as expected by CONAPO, consequently their estimate of Mexico’s 2010 population was significantly less than the census figure.

In a later post, we will attempt to update the existing CONAPO projection using the 2010 census figure, more recent net migration values and adjusted natural increase rates.

Access to services is worst in the smallest rural localities of Mexico

 Updates to Geo-Mexico  Comments Off on Access to services is worst in the smallest rural localities of Mexico
May 102011
 

Access to services such as schools, public transport or the internet are better in cities than in rural areas (localities in Mexico with fewer than 2,500 inhabitants). However some rural areas have far better access than others. Perhaps not surprisingly, the number of inhabitants of a rural locality is directly related to its access to services.

The 2010 census indicates that 26.0 million Mexicans (about 23.2% of the population) live in rural areas. A total of 9.0 million live in Mexico’s 5,921 large rural communities (those with 1000–2499 inhabitants) compared to 11.3 million living in the 22,852 mid-sized rural localities (250–999 people) and 5.7 million in the 159,820 small rural settlements (fewer than 250 residents). The average population in the last group is only 36 inhabitants indicating that many Mexicans live in very tiny communities.

The percentage of communities with access to a health center or clinic is 74.9% for the large rural areas, 50.7% for the mid-sized, and only 37.9% for the small rural areas. The percentages for access to either a secondary school or telesecundaria (Mexico’s satellite-fed secondary schools, see Geo-Mexico, page 126) also differ with the size of the community: 79.6%, 51.5% and 27.0%, respectively. Though these percentages are far lower than those for larger, urban communities, they have improved very significantly. The census indicates that rural areas are catching up with the rest of Mexico, especially with respect to education, life expectancy and fertility, three very important, inter-related variables.

In turn, this suggests that government programs such as Oportunidades are achieving something positive in some areas beyond poverty reduction.

The network of roads providing access to rural villages has improved significantly. 81.2% of the smallest localities now are connected by road, compared to 96.7% for the mid-sized and 98.3% for the large rural areas. However, these data indicate that almost 31,000 rural Mexican communities are still not accessible by road. Only 63.5% of the small rural villages are served by public transport, compared to 74.6% of the mid-sixed and 89.3% of the large rural localities. A total of almost 107,000 rural communities do not have any public transport and are consequently quite isolated. This isolation is a very serious constraint to their economic opportunities and quality of life. The people who live in communities without access to a paved road are among Mexico’s poorest; fully 88% are classified as “very marginalized” (see Geo-Mexico, page 184).

Internet access is only beginning to penetrate into rural areas. Only 3% of the smallest rural villages have public access to the internet (via school, cybercafé, etc.). About four times as many (11%) of mid-sized rural localities have public internet access. Almost half (45.6%) of the large rural communities have public internet access compared to 74.3% of larger communities between 2500 and 4999 inhabitants. Current trends suggest that by 2020, virtually all Mexicans will have some type of internet access, perhaps by cell phone.

Fertility decline not as fast as expected, but faster in some areas of Mexico than others

 Updates to Geo-Mexico  Comments Off on Fertility decline not as fast as expected, but faster in some areas of Mexico than others
May 092011
 

Data from the 2010 census indicate that the fertility rate did not decline as fast in the last decade as previously expected. On the other hand, the actual reduction was significant and consistent with Mexico’s demographic transition which will lead it to zero natural population growth by mid-century. See our 15 May 2010 post: Mexico’s demographic transition and flirtation with overpopulation.

At mid-decade Mexico’s National Population Council (CONAPO) projected that the total fertility rate would decline to an average of 2.1 children per women for the 2010 census. The new census data indicate that the fertility rate for 2009 was actually 2.4 compared to 2.9 in 1999. This decline is still significant but not quite as rapid as previously expected.

Fertility rates vary greatly for different areas of the country. Like many other socio-economic variables, fertility is closely related to community size. It declines systematically with increasing community size. Rural areas (localities of less than 2,500 population) had the highest rate of 2.9 in 2009, equal to the national level in 1999. If this ten year lag relationship continues, we might expect the fertility rate in rural areas in 2019 to be equal to the 2009 national rate of 2.4. The fertility rate in rural areas declined the fastest in the past decade, a full 24% from their 3.8 rate in 1999.

Towns between 2,500 and 15,000 dropped 16% from 3.1 to 2.6. Small cities between 15,000 and 100,000 declined by 14% from 2.8 to 2.4, the national average. For cities of over 100,000 the 2009 rate was 2.1 (the theoretical replacement level), compared to 2.4 in 1999.

The Federal District has the lowest fertility rate by far, for example women between age 35 and 40 have had an average of 1.8 children compared to the national average of 2.5. Using this measure, other states with low fertility levels include Nuevo León with 2.3, followed by Baja California Sur, Colima, State of Mexico, Morelos, Quintana Roo and Yucatán with 2.4. The highest fertility rates are in Chiapas and Guerrero where women between age 35 and 40 have had 3.2 children on average, followed by Oaxaca with 2.9.

The demographic transition model and its application to Mexico is described in depth in chapter nine of “Geo-Mexico; the geography and dynamics of modern Mexico”.