admin

The geography of renewable energy from wind power in Mexico

 Other  Comments Off on The geography of renewable energy from wind power in Mexico
Dec 162010
 

According to the World Association of Wind Power, Mexico grew its wind power sector faster than any other country during 2009, and now has more than 500MW of installed windpower capacity.

Mexico’s goal is to have an installed capacity of 2,500 MW of wind energy by 2012, and to have 26% of the nation’s installed capacity coming from clean energy sources (solar, geothermal, wind, nuclear and large-scale HEP). The Federal Electricity Commission, responsible for the national power grid, is installing two “wind corridors” in Oaxaca to connect several different windpower plants into the grid.

Mexico’s Energy Secretariat recently announced the publication of a new resource of interest to planners and geographers. The Atlas of Wind and Solar power potential is designed to inform investors of the necessary meteorological and climatic background prior to taking significant investment decisions.

According to the Atlas, Mexico’s wind potential is estimated at 71,000 MW. This figure comfortably exceeds the nation’s current installed capacity for all forms of power of 51,000 MW.

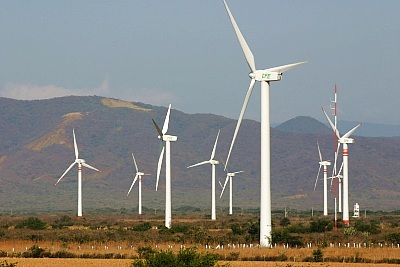
The most important single wind-power region in Mexico, and also one of the most important at the global scale is the Isthmus of Tehuantepec, the narrow belt of relatively low-lying land that links the Gulf coast (straddling the Veracruz-Tabasco state boundary) to the Pacific coast in the state of Oaxaca.

La Ventosa wind farm, Oaxaca

La Ventosa wind farm, Oaxaca

Several major wind farms have already been developed in the La Venta section of the Isthmus. Others are being constructed or on the drawing board. For example, Grupo Bimbo (which, with the acquisition of Sara Lee, has become the world’s largest bread- and pastry-maker) announced it is building a wind farm in association with Desarrollos Eólicos Mexicanos (Demex), a subsidiary of Spanish renewable energy firm Renovalia Energy. The “Piedra Larga” wind farm is under construction in Unión Hidalgo, Oaxaca. Costing $200 million, it will have an installed capacity of 90 MW when the first phase is complete, rising to 227 MW when the project is complete. This is sufficient energy to power all Bimbo’s producing and distribution needs in Mexico during the next 18 years at least. The first power will be generated early next year.

Two mining companies are also installing wind farms in Oaxaca, each with an installed capacity of 300MW.

Elsewhere, in Baja California, California-based Cannon Power Group plans is constructing a 1,000MW wind farm in Baja California. The 500 turbines of the 1-billion-dollar Aubanel Wind Project will be located southeast of the town of La Rumorosa, in the mountains between Tijuana and Mexicali. The turbines will supply power to both the USA and Mexico and are a separate project to the 1000MW wind farm planned by Energía Sierra Juárez, a subsidiary of Sempra, for an area north of La Rumorosa.

Currently, Mexico is developing wind power much more quickly than solar power, but this may change in the future, given that much of the country receives between 5 and 6kw/hr/square meter/day in solar energy, which is considerably more than most of the European countries which are now undertaking solar power development.

Related earlier post:

Energy is analyzed in chapter 16 of Geo-Mexico: the geography and dynamics of modern Mexico. and concepts of sustainability are explored in chapters 19 and 30.  Buy your copy today, so you have this handy reference guide to all aspects of Mexico’s geography available whenever you need it.
How much longer will Mexico be an exporter of oil?

 Other, Teaching ideas  Comments Off on How much longer will Mexico be an exporter of oil?
Dec 152010
 

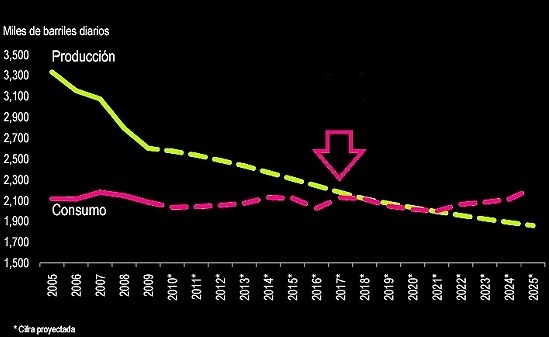
This interesting graph comes from a report published earlier this year by the Mexican Institute for Competitiveness (Instituto Mexicano para la Competitividad, IMCO). The purple line shows Mexico’s oil consumption in thousands of barrels/day from 2005 to 2009, with predicted values for the period 2010 to 2025. The yellow line shows Mexico’s oil production for the same period.

Graph of Mexico's oil production and consumption

Mexico's oil production (yellow) and consumption (purple), 2005-2025. Graph: IMCO.

Discussion questions:

  • In which year is Mexico’s consumption of oil predicted to equal its production?
  • What effects is this likely to have on Mexico’s economy?
  • What factors might cause this date to occur earlier than predicted?
  • What factors might cause this date to occur later than predicted?

A national map and summary of the methodology behind these rankings are provided in an earlier post:

For full details of the study:

Mexico’s economy and workforce are analyzed in chapters 14 to 20 of Geo-Mexico: the geography and dynamics of modern Mexico. Ask your library to buy a copy of this handy reference guide to all aspects of Mexico’s geography today! Better yet, order your own copy, which will still arrive in time for Christmas…

Updates on the geography of Mexico City

 Mexico's geography in the Press  Comments Off on Updates on the geography of Mexico City
Dec 132010
 

We start this periodic round-ups of news items related to the geography of Mexico City with an update on Mexico City’s population. The preliminary results of the 2010 census show that the Mexico City Metropolitan Area (MCMA) has a population of 20,137,152. This includes the Federal District with its 8,873,017 inhabitants. The Federal District has grown only slowly since 2000, but the State of Mexico, much of which is included in the MCMA, grew five times as quickly (its growth was 1.59%/yr between 2000 and 2010).

New electric Nissan taxis

Several hundred all-electric taxis will soon be circulating in Mexico City. In the second half of 2011, 500 Nissan “Leaf”s (Leading, Environmentally friendly, Affordable, Family cars) will be added to the city’s massive taxi fleet. When fully charged, the Leaf has a range of up to 160km, with zero emissions of CO2. Nissan is reported to be installing recharging stations in locations such as supermarket and restaurant parking lots. The Leaf is expected to go on sale to the public in 2012.

Fines for using non-biodegradable plastic bags

Mexico City authorities have dropped the possibility of  jail time, but kept stiff fines for anyone using plastic bags that are not bio-degradable. Store owners and employees are no longer allowed to give away non-biodegradable plastic bags. Repeat offenders will face fines of up to 9,250 dollars.

Levies on excess garbage

Watch out big business! Mexico City authorities have announced a crack-down on the solid wastes generated by large commercial enterprises, including shopping centers. About 2,000 places will be inspected; they currently pay about 1.2 million dollars (15 million pesos) a year in excess waste fees, but the city believes many are abusing the system, which is based on self-reporting. Mexico City’s solid waste regulations classify anyone disposing of more than 50 kg a day as a “high volume waste generator.” Anyone in this category must pay for every kilogram of waste beyond the basic 50 kilos. The current rates (per kilogram) are 0.50 pesos for construction materials, 1.00 pesos for urban waste, 1.83 pesos for plant-related waste and 2.20 pesos for wastes requiring special handling. Businesses will be audited by city inspectors to ensure that the amount of waste they produce matches what they officially report, and fines will be levied for non-compliance.

The geography of Mexico City is analyzed in chapters 21, 22 and 23 of  Geo-Mexico: the geography and dynamics of modern Mexico. Ask your library to buy a copy of this handy reference guide to all aspects of Mexico’s geography today! Better yet, order your own copy…

Dec 122010
 

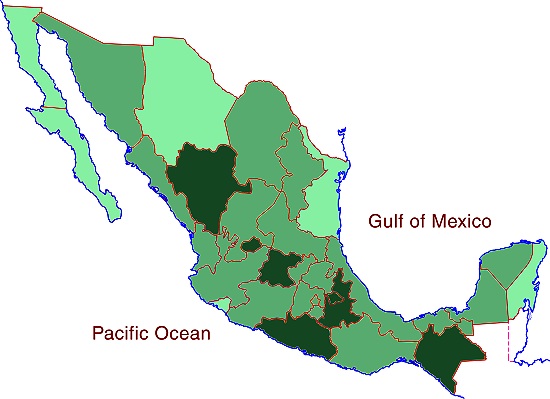
The map below shows the average number of inhabitants per household (“household size”) for each of Mexico’s states.

The national average household size is 3.9 persons. The middle band on the map shows those states with household size between 3.7 and 4.0 inclusive. The darkest shade shows states with a household size of 4.1 or greater; the lightest shade shows those with a household size of 3.6 or smaller.

Average household size in Mexico, 2010

Average household size in Mexico, 2010. Cartography: Tony Burton; all rights reserved.

Discussion questions:

  • Compare this map with the maps of:
  1. potable water,
  2. GDP/person
  3. infant mortality
  • Discuss the possible reasons for any connections you note between household size, potable water, GDP/person and infant mortality.
  • What other factors might also affect household sizes?
  • What are the drawbacks to using any of these measures (household size, potable water, GDP/person, infant mortality) on their own as a development indicator?

Development indices of various kinds are discussed in chapters 29 and 30 of Geo-Mexico: the geography and dynamics of modern Mexico. Ask your local library to purchase a copy today!

Dec 102010
 

Mexico’s economy, the world’s 11th largest, is growing rapidly and predicted by many analysts to become the world’s fifth largest by 2050. It is not, therefore, surprising that, according to a recent report on key emerging markets from Spanish bank BBVA, investments in emerging markets are assuming more and more importance. However, the all-encompassing term “emerging market” covers a multitude of countries whose individual economies are incredibly diverse. It includes not only major economies such as those of China, India and Mexico, but also a host of tiny island states such as Grenada, Vanuatu and the Seychelles.

BRICs or EAGLE

BRICs or EAGLE?

Economists have suggested various sub-groupings of emerging markets. One of the most commonly used in geography is BRIC, an acronym formed from the initial letters of Brazil, Russia, India and China. The term BRIC was first coined by  Jim O’Neill in a 2001 paper entitled “The World Needs Better Economic BRICs”. The concept of BRICs has become outdated as the four countries’ economies have diverged over the past decade. Any term comprised of country names will inevitably date fairly quickly, and become much less useful.

Now, BBVA has proposed the use of the term EAGLE to cover the world’s Emerging and Growth-Leading Economies. The member states of this exclusive EAGLEs club are:

  • China
  • India
  • Brazil
  • Russia
  • South Korea
  • Indonesia
  • Mexico
  • Turkey
  • Eqypt
  • Taiwan

These ten countries are each expected to contribute more to global economic growth than the average of G7 members. Combined, the ten EAGLEs are  expected to account for 50% of all global growth in the next 10 years.

A further eleven countries—Nigeria, Poland, South Africa, Thailand, Colombia, Vietnam, Bangladesh, Malaysia, Argentina, Peru and the Philippines—are identified by BBVA as having the potential to join the EAGLEs if their economies grow more than expected.

The BRIC is dead! The EAGLEs are rising! Long live the EAGLEs!

Mexico’s economy and workforce are analyzed in chapters 14 to 20 of Geo-Mexico: the geography and dynamics of modern Mexico. Ask your library to buy a copy of this handy reference guide to all aspects of Mexico’s geography today! Better yet, order your own copy…

Mexico’s major metropolitan areas and cities, 2010

 Updates to Geo-Mexico  Comments Off on Mexico’s major metropolitan areas and cities, 2010
Dec 092010
 

The table shows the population figures for Mexico’s 14 largest metropolitan areas, according to the preliminary results of the 2010 census. Mexico currently has 11 metropolitan areas with a population in excess of one million inhabitants. Three other cities have over 900,000 inhabitants, and look set to join the million-plus club within the next few years. A further seven cities—Saltillo, Chihuahua, Acapulco, Morelia, Cuernavaca,Tampico and Veracruz—have populations between 800,000 and 900,000.

1Mexico City (Valley of Mexico)20,137,152
2Guadalajara4,434,252
3Monterrey4,080,329
4Puebla-Tlaxcala2,668,347
5Toluca1,846,602
6Tijuana1,751,302
7León1,609,717
8Cd. Juárez1,328,017
9Torreón-Gómez Palacio (La Laguna)1, 215,993
10Querétaro1,097,028
11San Luis Potosí1,040,822
12Mérida970,495
13Mexicali936,145
14Aguascalientes932,298

Chapters 21 and 22 of Geo-Mexico: the geography and dynamics of modern Mexico analyze Mexico’s 500-year transition to an urban society and the internal geography of Mexico’s cities. Chapter 23 looks at urban issues, problems and trends. To preview more parts of the book, click here and use amazon.com’s “Look Inside” feature; buy your copy today!

Map of population change in Mexico, 2000-2010

 Updates to Geo-Mexico  Comments Off on Map of population change in Mexico, 2000-2010
Dec 072010
 

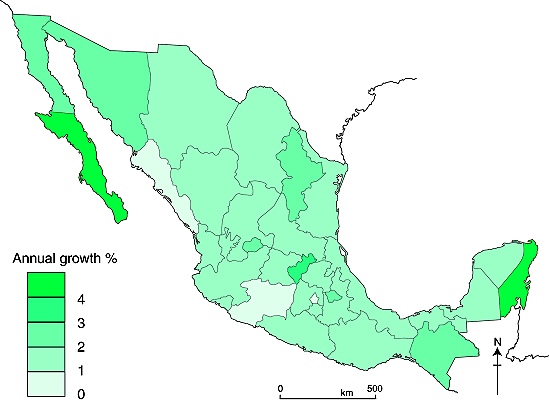
The publication of the preliminary results from this year’s population census has allowed us to update our map of Mexico’s recent population change (Figure 8.3 of Geo-Mexico: the geography and dynamics of modern Mexico). We are delighted to bring you what may be the first map to be published anywhere in the world of Mexico’s population change over the past decade:

Annual % population change in Mexico, 2000-2010

Annual % population change in Mexico, 2000-2010. Cartography: Tony Burton, all rights reserved.

The pattern on this map for 2000-2010 shows that population change over this period has been broadly similar to that for the period 1970-2005 (Figure 8.3 of Geo-Mexico: the geography and dynamics of modern Mexico). Mexico’s total population has grown by an average of 1.52%/yr over the past decade.

Things to note:

The fastest growth rates are in Baja California Sur and Quintana Roo, both states where tourism continues to develop rapidly and attract more migrants.

The slowest rates are in the Federal District (Mexico D.F.), Michoacán and Sinaloa, all of which have rates of less than 1%/yr. Michoacán’s low rate of increase is an anomaly, given the state’s high birth rate, and must be due to out-migration.

In central Mexico, the state of Querétaro stands out as being the most dynamic state in population terms, registering a growth of more than 3%/yr over the last decade.

Discussion Question: How does this map compare to the map of GDP/person?

Several chapters of Geo-Mexico: the geography and dynamics of modern Mexico discuss population issues, including population growth, distribution and density. Buy your copy today to have a handy reference guide to all major aspects of Mexico’s geography!

Dec 062010
 

Cancún is Mexico’s premier tourist destination, attracting more than 3 million visitors a year. A recent Associated Press report by Mark Stevenson highlights the problems faced by the resort due to the erosion of its beaches.

Cancún was developed on formerly uninhabited barrier islands on Mexico’s Caribbean coast. The islands were low-lying sand bars, held together by beach vines and the dense, interlocking roots of coastal mangroves. Hurricanes periodically swept over these small islands blowing loose sand towards the beaches on the mainland. Despite the occasional hurricane, the sandbars survived more or less unscathed until construction of Cancún, Mexico’s first purpose-built tourist resort, began in 1970.

As Cancún has grown, so the damage from hurricanes has become more serious. Category 4 Wilma in 2005 was especially destructive.

Cancún beach erosion

Cancún beach erosion. Photo: Dario Lopez-Mills/AP

Why has hurricane damage increased since 1970? Several factors are thought to play in a part in causing the increased rate of erosion of Cancún’s beaches in recent years:

  • hotels have been built too close to the shore, and too many are high-rise buildings. High-rise hotels deflect some of the wind downwards towards the ground. These wind eddies can stir up any dry surface sand in a process known as deflation.
  • hotels are too heavy. The sheer weight of high-rise hotels compacts the largely unconsolidated sediments beneath them, rendering the sediments less able to store or absorb excess water, and more liable to subsidence and structural problems. Extra weight also increases the load on slopes and leads to a higher incidence of slope failure.
  • coastal mangroves have been destroyed, removing their ability to protect the shoreline during storm events.
  • most beaches have been stripped of their original vegetation. The original beaches were protected by various adventitious vines which were quick to colonize bare sand. They would simultaneously help hold the sand in place, protecting it from wind action, and gradually add to the organic content of beaches to a point where they could support other, larger plants. Native vegetation has been mercilessly eradicated from Cancún’s beaches to create the tourism “ideal” of uninterrupted swathes of white sand.

It also appears that hurricanes and other tropical storms have become more frequent in recent decades, perhaps as a consequence of global climate change. The situation has also been exacerbated by the gradually rising sea level. Sea level on this coast is rising at about 2.2 mm/y.

Why have some of the efforts made to mitigate the beach erosion only made the situation even worse?

Following strong hurricanes (such as Wilma in 2005) Cancún has lost most of its beaches. The first attempt at beach restoration in 2006 cost 19 million dollars. In 2009, an even costlier (70 million dollar) beach restoration was carried out, using sand dredged from offshore. In one sense, the project was a resounding success. A new beach up to 60 meters wide, was created along some 10 km of coastline.

However, this new beach came at a considerable ecological cost. The pumping of sand from offshore disturbed the seafloor and damaged sealife, including populations of octupus and sea cucumbers. Fine sediments raised by the pumping traveled in suspension to nearby coral reefs, where it also had deleterious impacts.

In addition, the new beach is already being eroded away (some estimates are that up to 8% of the new sand has already been washed or blown away), so presumably if Cancún’s beaches are to be maintained in the future, beach restoration will have to become a regular event.

One hotel erected a breakwater or groyne on its beach to retain all the sand being carried along the coast by the process of longshore drift. The Associate Press article ends with a wonderful story of how the beach in front of this particular hotel was cordoned off by marines last year on the grounds that it was stolen property.

Link to 2013 news article: A fortune made of sand: How climate change is destroying Cancun

Tourism is one of Mexico’s major sources of revenue. But tourism, especially high-rise mass tourism such as that characterized by Cancún, comes with a hefty price tag. Policy-makers need to decide whether this price tag, which will only rise further in the future as we continue to damage our natural environment, is really one that is worth the cost.

Chapter 19 of Geo-Mexico: the geography and dynamics of modern Mexico looks in much more detail at Mexico’s purpose-built resorts as well as many other  aspects of tourism, resorts and hotels  in Mexico. Chapter 30 focuses on environmental issues and trends. Buy your copy today!

How good were the 2010 hurricane predictions?

 Other  Comments Off on How good were the 2010 hurricane predictions?
Dec 042010
 

In an earlier post – How many hurricanes are likely in the 2010 Atlantic hurricane season? – we reported on the predictions for this year’s Atlantic/Caribbean hurricane season

How close to reality did those predictions turn out to be?

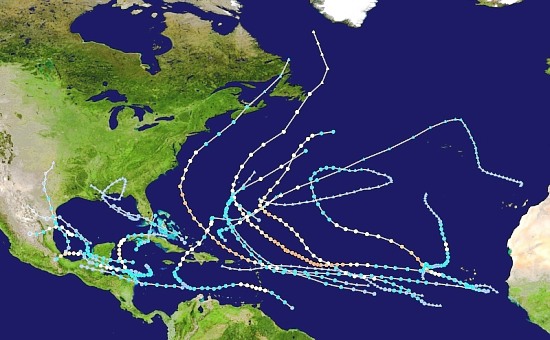
The predictions were for 8 tropical storms, 5 moderate hurricanes (1 or 2 on the Saffir-Simpson scale), and 5 severe hurricanes (3, 4 or 5 on the Saffir-Simpson scale). At the end of the season (30 November 2010), there had been 7 tropical storms, 7 moderate hurricanes and 5 major hurricanes. In total, these storms caused 259 deaths directly, and a further 23 indirectly, with total property damage estimated at US$11.4 billion. (Note that not all of these hurricanes affected Mexico).

Atlantic Hurricane tracks, 2010

Atlantic hurricane tracks, 2010. Created by Cyclonebiskit using Wikipedia: WikiProject Tropical cyclones/Tracks. Author: Cyclonebiskit and Syntheticalconnections

So, all in all, the predictions made before the hurricane season started were pretty close to the mark, and this hurricane season was indeed one of the most active on record.

Previous hurricane-related posts include:

Hurricanes and other climatological phenomena are analyzed in chapters 4 and 7 of Geo-Mexico: the geography and dynamics of modern Mexico. Buy your copy today, so you have a handy reference guide available whenever you need it.
The 2010 United Nations Climate Change Conference in Cancún, Mexico

 Mexico's geography in the Press  Comments Off on The 2010 United Nations Climate Change Conference in Cancún, Mexico
Dec 012010
 

The 2010 United Nations Climate Change Conference is now underway in Cancún, Mexico. It began 29 November and closes 10 December 2010. One of the objectives that Mexico hopes to achieve is the setting up of a Global Green Fund to help nations adversely affected by climate change to finance projects of mitigation and adaptation.

IPCC CancunAt the 2009 round of talks, in Copenhagen, Denmark, the countries present failed to agree any significant actions, choosing instead to sign a non-binding agreement and “agree to disagree”.

Prior to the Cancún meeting, four preparatory rounds of negotiations have already been held in 2010. The first three rounds were in Bonn, Germany:  April 9-11;  June 1 – 11; and August 2 – 6. After the August meeting, UN Secretary-General Ban Ki-Moon publicly doubted that member states would reach any new agreement on global warming at the Cancún Conference.

The fourth preparatory round of talks, held in Tianjin, China, also made minimal progress as the USA and China could not agree on key issues. However, following that meeting, Christiana Figueres, Executive Secretary of the UN Framework Convention on Climate Change (UNFCCC), said, “This week has got us closer to a structured set of decisions that can be agreed in Cancún … This is the greatest societal and economic transformation that the world has ever seen.” Other commentators have also spoken of a positive spirit of negotiation, which will hopefully pave the way for an agreement to be reached in Cancún.

We will have to wait until the conclusion of the Cancún Conference before assessing its success or lack thereof, but let us hope that the delegates can this year come to some meaningful, and binding decisions.

Previous posts about global warming:

Mexico’s environmental trends and issues are examined in chapter 30 of Geo-Mexico: the geography and dynamics of modern Mexico. Ask your library to buy a copy of this handy reference guide to all aspects of Mexico’s geography today! Better yet, purchase your own copy…

Subsidence incident leads to demolition of 31 homes in the State of Mexico

 Mexico's geography in the Press  Comments Off on Subsidence incident leads to demolition of 31 homes in the State of Mexico
Nov 302010
 

Thirty-one homes have been demolished due to structural damage resulting from subsidence in the colonia Benito Juárez. The subsidence, on 28 October 2010, occurred close to the Neza II garbage tip and affected more than 200 homes in total.

Temporary accommodation has been found for the families affected, who will have their rents of up to 2,000 pesos a month paid for the first six months. The compensation to be paid to the affected families from government coffers is still being decided.

Geologists and engineers from the Universidad Nacional Autónoma de Mexico (UNAM) y el Instituto Politécnico Nacional (IPN), are currently assessing the risks of alternative sites for rebuilding the 31 homes. Several areas of Nezahualcóyotl are known to be vulnerable to subsidence or to the sudden appearance of surface cracks (superficial faults).

The subsidence is presumed to have occurred because of the filtration of liquids from the Neza II tip through the subsoil, though precise details are still being investigated. To prevent further problems in the area, pipes are being installed to channel all liquid residues away from homes, and vents are being placed to allow the escape of gases emanating from within the garbage tip.

The three settlements of Nezahualcóyotl, Chimalhuacán and Los Reyes La Paz add about 1,000 tons of garbage daily to the Neza II tip. Authorities are now planning to close the tip completely by the end of November 2010.

Elsewhere in Nezahualcóyotl, the structural integrity of a shopping center and sports complex located near the Neza I tip are also being investigated.

The fact that subsidence occurs far more frequently in the eastern part of Mexico City (including Nezahualcóyotl) than elsewhere does not indicate that the solutions must be local. Ramón Aguirre, the director of Mexico City’s Water System (Sistema de Aguas de la Ciudad de México), has repeatedly emphasized the importance of looking at Mexico City’s potable water and drainage problems in the context of the entire metropolitan area (which extends well beyond the boundary of the Federal District). Aguirre fears that climate change and further over-exploitation of the aquifers, which Mexico City shares with the State of México, will only lead to more problems of water supply and more cases of subsidence.

Chapter 23 of Geo-Mexico: the geography and dynamics of modern Mexico looks at urban issues, problems and trends. To preview more parts of the book, click here and use amazon.com’s “Look Inside” feature.

Nov 292010
 

According to the Environment Ministry, Mexico generates 94,800 tons of garbage a day, which equates to 34.6 million tons a year. Of this total, 53% is organic and 28% recyclable (paper and cardboard 14% of total garbage, glass 6%, plastics 4%, metals 3% and textiles 1%). The remaining 19% of total waste is comprised of non-recyclable construction waste, leather, rubber and miscellaneous other items.

Authorities claim that 87% of all wastes are now collected but, unfortunately, only about 60% ends up in authorized landfills.

Previous posts about garbage”

Mexico’s environmental trends and issues are examined in chapter 30 of Geo-Mexico: the geography and dynamics of modern Mexico. Ask your library to buy a copy of this handy reference guide to all aspects of Mexico’s geography today! Better yet, purchase your own copy…

Mexican migrants pay 53 billion dollars a year in US taxes

 Mexico's geography in the Press  Comments Off on Mexican migrants pay 53 billion dollars a year in US taxes
Nov 272010
 

Mexicans migrate to the USA looking for work and higher salaries, but those workers pay 53 billion dollars a year in taxes, according to Ignacio Deschamps, head of the Fundación BBVA Bancomer. (The BBVA Bancomer Foundation has helped 20,000 young people in 143 municipalities complete their high school education.)

Deschamps claims that for every dollar sent home in remittances, Mexican workers will have already paid 2.50 dollars in US taxes. Hence, in 2008, they would have contributed 53 billion dollars to the US Treasury.

Recent figures show that during the economic downturn, unemployment among Mexican migrants is much higher (13%) than for the workforce as a whole (10%).

Previous posts related to Mexican migrants in the USA:

Migration between Mexico and the USA is the focus of chapter 25 of Geo-Mexico: the geography and dynamics of modern Mexico. Ask your library to buy a copy of this handy reference guide to all aspects of Mexico’s geography today! Better yet, order your own copy…

How many Mexicans are there? The preliminary figures from Mexico’s 2010 national population census

 Updates to Geo-Mexico  Comments Off on How many Mexicans are there? The preliminary figures from Mexico’s 2010 national population census
Nov 262010
 

The National Statistics Institute (INEGI) has released the preliminary figures from Mexico’s 2010 national population census. INEGI claims that its 190,000 census workers were able to visit 98.4% of all homes in the country. The lowest response rates were 91.3% and 91.5% respectively in the troubled northern border states of Tamaulipas and Chihuahua.

Update: 2020 – Total population is about 126 million.

The highlights of the preliminary results

The preliminary results of the 2010 census reveal some interesting changes.

First, Mexico’s total population in 2010 is  112,322,757. This is almost 4 million higher than INEGI’s pre-census estimates. The population total means that Mexico remains the world’s 11th most populous country.

Mexico has now become a markedly urban society. Whereas a hundred years ago, in 1910, 71.3% of the then population of 15.2 millions lived in rural areas (defined as municipalities with fewer than 2,500 inhabitants), in 2010, 62.6% of all Mexicans live in one of the country’s 56 largest metropolitan areas (as defined by INEGI). The largest single metropolitan area is the Mexico City Metropolitan Area (which extends into the State of Mexico) with a population of 20.1 million.

The density of population has changed over the last century as well. In 1910, the overall density of population was 8 persons/square kilometer. In 2010, the density of population was 57 persons/square kilometer (with Mexico D.F. having the highest value in Mexico of 5,937 inhabitants/square kilometer!).

Emigration in search of work, and a declining maternal mortality rate have completely changed Mexico’s male/female ratio. Whereas in 1910, there were 102.7 males for every 100 females, in 2010 there are  95.5 males for every 100 females.

As more figures are released in coming months, we will offer further insights into the changing geography of Mexico.

In the meantime, for a comprehensive summary of Mexico’s geography, including several chapters about Mexico’s population, ask Santa Claus, a friend or family member to give you a copy of Geo-Mexico: the geography and dynamics of modern Mexico. What better seasonal gift could there possibly be?

The geography of Thanksgiving: no Thanksgiving feast is complete without pumpkin pie

 Other  Comments Off on The geography of Thanksgiving: no Thanksgiving feast is complete without pumpkin pie
Nov 252010
 

In earlier posts in this Thanksgiving mini-series, we examined how several of the essential ingredients of a Thanksgiving feast—turkey, corn and potatoes—originated in Mexico. We round off this Thanksgiving series with a  look at pumpkin pie.

All varieties of pumpkin, whatever their size and shape, belong to the Cucurbita genus. While there are some doubts about the precise origin of the wild forms of pumpkin, they were certainly being cultivated in Mexico as long ago as 5500 BC and were an integral part of the daily diet of many Indian groups. The use of “pumpkin” in English can apparently be traced back to the year 1547. For many people, pumpkins are eternally associated with both Thanksgiving and with Halloween.

Pumpkin pi

Pumpkin pi

Given that the first Thanksgiving was held in New Spain (Mexico) and that many of the essential ingredients of modern-day celebrations of Thanksgiving are Mexican in origin, when the residents of the USA sit down for their Thanksgiving meal, they really are taking part in an “All-American” celebration.

Many traditional Thanksgiving and Christmas dinners would simply not be the same were it not for a few key ingredients from Mexico!

So, wherever you are this festive season, keep your eyes open for Mexican influences…

¡Happy Thanksgiving, and seasonal greetings to all!

Previous posts in the Thanksgiving mini-series:

Potatoes, yet another Mexican contribution to Thanksgiving…

 Other  Comments Off on Potatoes, yet another Mexican contribution to Thanksgiving…
Nov 242010
 

Alongside turkey and/or corn at Thanksgiving and Christmas, the humble yet versatile potato is often eaten. That, too, was introduced to Europe from Mexico (though the plant appears to have originated in Andean Peru). A previous post delved into the connections between Mexico, the potato, and the Irish migration to North America following the potato famine of the early 19th century.

But did you also know that potatoes were originally sold in Spain on the strength of claims that they could cure impotence, at prices up to two thousand dollars a kilo?

Nowadays, potatoes in one form or another are virtually ubiquitous – from mashed or baked or potato salad, to French fries and the quintessentially Québécois variation of poutine (fries, curds and gravy).

On our Thanksgiving menu, we now have turkey, corn and potatoes, all of which originated in Mexico, but we still have one essential ingredient left… (for next time)

Previous posts in the Thanksgiving mini-series:

Geo-Mexico: the geography and dynamics of modern Mexico is your handy reference guide to all aspects of Mexico’s geography! Ask your library to acquire some copies today. Better yet, purchase your own copy…

Corn, another of Mexico’s gifts to Thanksgiving

 Other  Comments Off on Corn, another of Mexico’s gifts to Thanksgiving
Nov 232010
 

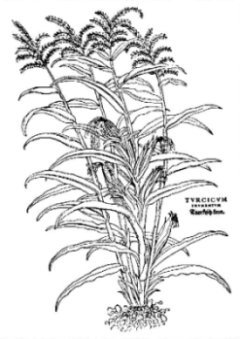
According to Ernst and Johanna Lehner in their Folklore and Odysseys of Food and Medicinal Plants, corn (which originated in Mexico) was misnamed as Turkish corn at the same time as turkey acquired its name, and for much the same reason. Europeans first saw corn, called maize or mahiz by the indigenous people, when Columbus and his followers arrived in the New World. They took samples back to Spain at the very end of the 15th century.

Turkish corn from Fuchs' De Historia Stirpium; Basle 1542

Turkish corn from Fuchs' De Historia Stirpium; Basle 1542

It quickly became an important crop, successfully cultivated throughout the continent. 16th century herbalists in Europe called the new plant by various names, including Welsh corn, Asiatic corn, Turkish wheat and Turkish corn. The latter name was the most usual, since they believed that the grain had been brought into central Europe from Asia by the Turks, who had introduced dozens of other products from the east into Europe at about the same time.

The Turks themselves called the crop “Egyptian corn”; the Egyptians called it “Syrian sorghum”… The German botanist Hieronymus Bock, in his New Kreüterbuch or herbal in 1546, remained on the fence, calling it “foreign corn”. Given the confused terminology, perhaps it is not surprising that, to quote Ernst and Johanna Lehner, “It took Spanish botanists more than 50 years to convince other European herbalists that corn was American.” Corn was given its botanical name, Zea mays, by Carl von Linné in the 18th century.

Previous posts in the Thanksgiving mini-series:

Geo-Mexico: the geography and dynamics of modern Mexico is your handy reference guide to all aspects of Mexico’s geography Ask your library to acquire several today! Better yet, purchase your own copy…

The geography of Thanksgiving: why a Mexican bird came to be called turkey

 Other  Comments Off on The geography of Thanksgiving: why a Mexican bird came to be called turkey
Nov 222010
 

Geographers who are Hungary like to eat Turkey, provided it does not have too much Greece.

The first in this Thanksgiving series of posts looked at how the first Thanksgiving was actually held in Mexico, and not the USA as more commonly claimed.

Many of the essential ingredients of the modern Thanksgiving feast also originated in Mexico. In this post, we take a look at the origins of the Thanksgiving (and Christmas) turkey.

How did the turkey eaten at Thanksgiving and Christmas acquire the same name as a European country? Or was it the other way around?

Modern day turkeys (the edible kind) are the direct descendants of the wild turkeys (Meleagris gallopavo) still found in many parts of Mexico.

Wild Turkey, Meleagris gallopavo Painting by John James Audubon, 1830

Wild Turkey, Meleagris gallopavo. Painting by John James Audubon, 1830

So, how is it possible that a Mexican bird acquired the name turkey? The most likely explanation derives from the fact that the merchants who traded in the Middle Ages between the Middle East and England were based in the Turkish Empire and hence known as “Turkey merchants”. Turkey merchants are also believed to have introduced the guinea fowl, a native of Madagascar, to European dinner tables.

Later, the larger New World bird, the present-day turkey, was brought back to Spain by the conquistadors. The rearing of New World birds gradually spread to other parts of Europe and North Africa. The Turkey merchants capitalized on the new opportunity, and began to supply the new birds instead of the guinea fowls to the English market, and the rest is history.

The first use in English of the word “turkey” to describe the bird dates back to 1555. By 1575 , turkey was already becoming the preferred main course for Christmas dinner. Curiously, the Turkish name for the turkey is hindi, which is probably derived from “chicken of India”, perhaps based on the then-common misconception that Columbus had reached the Indies.

Mexico’s wild turkeys had been domesticated by pre-Columbian Indian groups long before the Spanish conquistadors arrived. Several archaeological sites provide tantalizing clues as to precisely how turkeys were reared. One such site is Casas Grandes in the northern state of Chihuahua, an area where modern, large-scale turkey-rearing is still an important contributor to the local economy.

Previous posts in the Thanksgiving mini-series:

Geo-Mexico: the geography and dynamics of modern Mexico is your handy reference guide to all aspects of Mexico’s geography. If you have enjoyed this post, please consider gifting a copy of Geo-Mexico to someone this holiday season.

Nov 212010
 

If you live anywhere near Plimoth Plantation, Massachusetts, you may wish to stop reading right now…

For the benefit of our many non-US readers, Plimoth Plantation, Massachusetts is commonly cited as the “birthplace of Thanksgiving”. The first  Thanksgiving is said to have been held there way back in 1621.

Well, has Geo-Mexico got news for you

Several years ago, Don Adams and Teresa Kendrick wrote a compelling account of how the very first Thanksgiving celebration held by Europeans in North America was actually held on April 30, 1598.This is fully 23 years earlier than Plimoth Plantation.

From our Geo-Mexico perspective, even more important is the fact that they provide ample evidence to prove that this very first Thanksgiving was not held in the USA at all, but actually took place  in New Spain (Mexico)! So, Thanksgiving is actually of Mexican origin. Before we know it, the USA will be claiming tacos, tequila, and mariachis as well…

Incidentally, one curious feature of the original 1598 feast is that it apparently did not include either turkey or potatoes! We will continue this mini-series on the geography of Thanksgiving next time.

Happy Thanksgiving!

Geo-Mexico: the geography and dynamics of modern Mexico is your handy reference guide to all aspects of Mexico’s geography. If you have enjoyed this post, please consider gifting a copy of Geo-Mexico to your friends in the coming holiday season.

How important are remittances to Mexico’s economy?

 Updates to Geo-Mexico  Comments Off on How important are remittances to Mexico’s economy?
Nov 202010
 

There are millions of Mexican workers in the USA who send a sizable portion of their wages back to their families in Mexico. On a per person basis, Mexico receives more worker remittances than any other major country in the world.

States receiving the most remittances (highest value)

The ten states receiving the most remittances (by value). All rights reserved.

An estimated 20% of Mexican residents regularly receive some financial support from workers abroad. Such remittances are the mainstay of the economies of many Mexican communities, such as many rural areas in Durango, Zacatecas, Guanajuato, Jalisco and Michoacán. Studies suggest that the funds sent as remittances are mostly spent on housing, food, clothing and durable consumer goods. A growing portion is being invested in education and small businesses. The corollary is that only a small percentage goes towards savings.

In 2008, remittances flowing back to Mexico exceeded $25 billion.The value of remittances fell slightly in 2009, according to World Bank figures, but are forecast to increase again this year. Only India and China, both with far higher populations than Mexico, have larger sums of remittances entering their economies.

According to figures published in The Economist (13-19 November 2010), remittances in Mexico are equivalent to 2.5% of the nation’s GDP. Mexico’s degree of reliance on remittances is greatly exceeded by the comparable figures of 22.4% of GDP for Lebanon, 11.8% for Bangladesh, 11.7% in the Philippines, 7.0% in Vietnam, 6.0% in Pakistan and 3.9% for India. (In China, remittances account for only 1.0% of GDP).

Related posts on this bog:

Migration between Mexico and the USA is the focus of chapter 25 of Geo-Mexico: the geography and dynamics of modern Mexico. Ask your library to buy a copy of this handy reference guide to all aspects of Mexico’s geography today! Better yet, order your own copy…

Where in Mexico do people still lack access to potable water?

 Maps, Teaching ideas  Comments Off on Where in Mexico do people still lack access to potable water?
Nov 162010
 

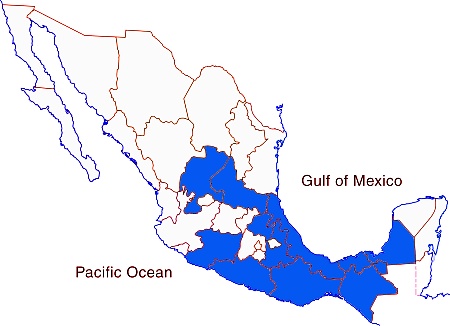
The map shows the 14 states in Mexico where less than 90% of the population has potable water in their homes.

map of potable water in Mexico

The 14 states with poorest potable water access in Mexico

How does the distribution of state with relatively poor access to potable water compare with maps of:

Development indices of various kinds are discussed in chapters 29 and 30 of Geo-Mexico: the geography and dynamics of modern Mexico. Ask your local library to purchase a copy today!

Mexico and USA agree to talk about oil rights in the Gulf of Mexico’s “Western Doughnut Hole”

 Books and resources, Mexico's geography in the Press  Comments Off on Mexico and USA agree to talk about oil rights in the Gulf of Mexico’s “Western Doughnut Hole”
Nov 152010
 

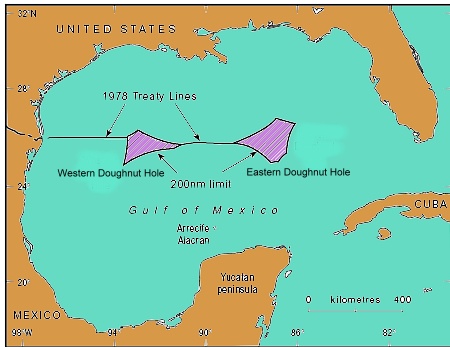
In 1970, the UN Law of the Sea Convention formally awarded each country the right to natural resources in its 200-mile (322 km) Exclusive Economic Zone (EEZ). Where claims overlapped, the Law of the Sea requires the competing countries to negotiate separate bilateral or multilateral agreements.

By 1979, the US and Mexico had agreed a treaty governing the basic delimitation of their respective EEZs. However, the treaty was never ratified by the US Senate. While the treaty had fixed seven points on the boundary, there were still two areas where the countries’ claims overlapped. The two portions were called the Western and Eastern Polygons (or Gaps), but were quickly nicknamed the Doughnut Holes. Together they straddle about 200 km of border.

The Western Doughnut Hole has a surface area of 17,467 square kilometers (6,744 square miles). The Eastern Doughnut Hole is about 20,000 square kilometers (7,720 square miles) and partially overlaps with the EEZ of Cuba.

location of doughnut holesTo date, no deposits of hydrocarbons have yet been found which straddle the maritime boundary, even though the Western Doughnut Hole is thought to hold untapped reserves of oil and gas. However, oil wells on one side of the boundary would likely extract some oil from the other side, hence the potential for conflict. In a parody of US politician Ross Perot’s famous 1992 line about the likely impact of the North American Free Trade Agreement (NAFTA) which would cause “a giant sucking sound” as US jobs moved south to Mexico, Mexican journalists have described the likely result of drilling in the Doughnut Hole as a “giant sucking sound” as US firms used their superior deep-water technology to suck up Mexican oil from the other side of the border.

Presidents Calderón and Obama agreed in May 2010 to extend the moratorium on any oil exploration drilling in the Western Polygon until January 2014, giving both sides time to hold joint discussions towards a permanent agreement.

The major oil spill from Deepwater Horizon has helped drive both governments to prioritize joint regulations governing oil and gas activities close to their shared border. Discussions are expected to cover not only deep water oil extraction, but also shallow water activities, including resources other than oil and gas.

For more details, see these two articles by Javier H. Estrada Estrada, Analitica Energética S.C.:

The changing political frontiers of Mexico are the subject of chapter 12 of Geo-Mexico: the geography and dynamics of modern Mexico. Oil reserves and exploitation are discussed in chapter 15.  If you have enjoyed this post, please consider purchasing a copy of Geo-Mexico so that you have your own handy reference guide to all aspects of Mexico’s geography.

The nondescript city of Zitácuaro, Michoacán, is the unhappy star of a New Yorker article

 Mexico's geography in the Press  Comments Off on The nondescript city of Zitácuaro, Michoacán, is the unhappy star of a New Yorker article
Nov 132010
 

The city of Zitácuaro in the state of Michoacán had played an important part in Mexican history (hence its full official name of Heróica Zitácuaro) but was largely ignored by tourists until the early 1980s. Things changed, and tourists started coming, when the locations of the Monarch butterfly overwintering sites were first published. The Monarchs had been undertaking their amazing annual migration from Canada and the USA to the rugged mountains close to Zitácuaro for hundreds, possibly thousands of years, but it was only in the early 1980s when articles in newspapers and science journals first provided locational details.

The Monarch butterflies have since become one of the major ecotourist attractions in this part of Mexico. On a single day in February, more than 5,000 tourists enter the main Monarch reserve El Rosario, accessed from either Angangueo or Ocampo, about 40 minutes driving time from Zitácuaro. Hotels in this area have done well out of the annual November-March “butterfly season”. Indeed, the demand led to the construction of several new hotels in the area, some of them more than large enough to handle tourist groups arriving by the coachload.

In 1980, I began leading regular fieldtrips to Zitácuaro and its surrounds, the major attractions being wonderful scenery and an interesting mix of settlement types, covering everything from 4-hut hamlets to the medium-sized city of Zitácuaro, which had a population at the time of about 100,000.  Over the years, I’ve watched Zitácuaro grow into a much larger city. When the bypass was first built, and federal Highway 15 rerouted around the town instead of along Avenida Revolución, it was ignored by most motorists, who preferred to drive through the city, often stopping for gas or food before continuing their journey. Within a few years, services had begun to spring up, as if by magic, alongside the bypass. Today, the city has spread well beyond the confines of the bypass.

In recent years, violence related to drug trafficking has reached the city. This is perhaps somewhat surprising, given its location far from the USA border, and far from the traditional territories of the main drug cartels. But, as we saw in an earlier post (The geography of drug trafficking in Mexico),  Zitácuaro is very close to the edge of the “territories in dispute” immediately to the west of Mexico City. Violence in these areas is growing as rival groups seek to control the lucrative drug trade. The La Familia crime group is responsible for most drug-related violence in Michoacán.

An article in the New Yorker earlier this year described in detail how La Familia has increasingly threatened the rule of law in  Zitácuaro. The article serves as a good introduction to how an ordinary Mexican city – in this case Zitácuaro – can be dramatically changed by a committed and ruthless criminal group.

An overview of the geography of drug trafficking in Mexico forms part of chapter 20 of Geo-Mexico: the geography and dynamics of modern Mexico. Buy your copy today!

Related post about drug cartels in Mexico:

Which states in Mexico have the highest infant mortality rates?

 Maps, Other, Teaching ideas  Comments Off on Which states in Mexico have the highest infant mortality rates?
Nov 122010
 

Infant mortality is the number of deaths of infants (aged less than 1 year old) for every 1,000 live births. It is widely regarded as a very useful development indicator, and is one of the statistics used when calculating compound (multifactor) development indices. The Federal District has the lowest infant mortality rate in the county – 13.8, ahead of Nuevo León (14.0), Coahuila (14.8) and Baja California (14.9).

RankStateInfant mortality rate
22Michoacán20.0
23Campeche20.1
24Zacatecas20.3
25San Luis Potosí20.5
26Tabasco20.9
27Puebla20.9
28Hidalgo21.3
29Veracruz21.6
30Guerrero24.4
31Oaxaca24.6
32Chiapas25.3

The table lists the 11 states in Mexico which have the highest rates of infant mortality. No other state has an infant mortality rate of 20.0 or higher. The map clearly reveals that these states are mostly in the south of Mexico, a long way from the USA border.

Map of infant mortality

The eleven states with the highest infant mortality rates

Compare this map with the map of GDP/person. Are there any states which appear to be anomalies to the general rule that GDP/person and infant mortality rates are inversely related?

Development indices of various kinds are discussed in chapters 29 and 30 of Geo-Mexico: the geography and dynamics of modern Mexico. Ask your local library to purchase a copy today!

Job recovery in the USA for foreign-born workers

 Updates to Geo-Mexico  Comments Off on Job recovery in the USA for foreign-born workers
Nov 102010
 

Recent data indicate that between June 2009 and June 2010 foreign-born workers in the USA gained 656,000 jobs while native-born workers lost 1.2 million jobs. Foreign-born Hispanics gained 392,000 new jobs, but their pay declined by 5.8%. The majority of foreign-born Hispanics are from Mexico. Assuming Mexicans obtained a big share of these employment gains, we can expect that immigration from Mexico is increasing from the relatively low numbers observed in 2008 and 2009.

During the deepest part of the recession, between June 2008 and June 2009, jobs held by foreign-born workers in the USA fell by 1.1 million. Looking at the two year period between June 2008 and June 2009, foreign-born workers lost about 400,000 jobs while native-born workers lost 5.7 million jobs. Apparently, employers prefer to hire lower paid, temporary foreign-born (Mexican) workers than native-born workers who are more apt to demand higher pay and benefit packages.

Source

R. Kochhar, C.S. Espinoza, and R. Hinze-Pifer, “After the Great Recession: Foreign Born Gain Jobs; Native Born Lose Jobs”, Pew Hispanic Center, Washington DC, Oct. 29, 2010 (pdf file).

Migration between Mexico and the USA is the focus of chapter 25 of Geo-Mexico: the geography and dynamics of modern Mexico. Ask your library to buy a copy of this handy reference guide to all aspects of Mexico’s geography today! Better yet, order your own copy…

Nov 092010
 

In an earlier post, we looked at why ground subsidence has become such as serious problem in Mexico City.

The uneven subsidence poses a major challenge for engineering projects such as constructing (and maintaining) the city’s metro system.Mexico City metroThe Mexico City metro has 11 lines linking 175 stations, with a total length of 201 km (125 miles); an additional line is under construction. The metro is used by 5 million passengers a day. Some parts of the system are overground, but 56% of the network is underground. The deepest station is 35 m below street level. The Mexico City metro is the 7th most widely used in the world, after the metros in Tokyo, Moscow, Seoul, New York, Paris and Beijing.

  • many archaeological finds, including a pyramid, were made during the excavation required for Mexico City’s metro
  • Pino Suárez station was built around an ancient pyramid unearthed during metro construction
  • stations are named, but are also identified by simple glyph-like logos designed for easy use by people who have difficulty reading or writing
  • a single trip between any two stations on the network costs $3 pesos (about 25 cents US).; the metro is free for the elderly and physically-challenged
  • during peak hours, the Metro reserves some carriages for women and children only (no men)
  • almost all Mexico City metro cars run on rubber tires, making for a smooth, quiet ride

When the first line was built in 1969, one of the strategies adopted by engineers to limit damage from subsequent subsidence was apparently to build the metro tunnels and stations in such a way that their total weight was very similar to the weight of the mud and sediments removed during construction. Presumably, if the weights were identical, at least the tunnels would be likely to remain in the same relative positions over time, even if the subsoil contracted and sank. To a large extent, the engineers were successful, and the metro has experienced  amazingly few structural problems in its 41 years of operation. In the devastating 1985 earthquakes, Mexico City’s metro system sustained no serious damage despite the widespread destruction and loss of life above ground.

Mexico City’s metro network is administered by the Metro Transportation System (Sistema de Transporte Colectivo Metro, STCM). STCM ackowledges several recent problems related to small-scale earth movements on five of its eleven lines: Lines 4, 5, 9, A and B. For example, the maximum permitted velocities for metro trains were reduced for the section of Line A between Pantitlán and La Paz while repairs costing 36 million dollars were completed. Even as STCM undertakes the necessary repair work, it is starting to install a state-of-the-art, 1.6-million-dollar fiber-optic monitoring system which will eventually cover the entire network.  The system enables the “real time” detection (with live video feeds) of any subsidence, fissures, inundations or related issues.

Useful link:

Key question, based on the map:

  • Why does the metro system have a much higher density in eastern and southern Mexico City than in the northern and western parts of the city?

Chapters 21 and 22 of Geo-Mexico: the geography and dynamics of modern Mexico analyze Mexico’s 500-year transition to an urban society and the internal geography of Mexico’s cities. Chapter 23 looks at urban issues, problems and trends. To preview more parts of the book, click here and use amazon.com’s “Look Inside” feature; buy your copy today!

What questions were asked in Mexico’s 2010 population census?

 Other  Comments Off on What questions were asked in Mexico’s 2010 population census?
Nov 082010
 

In mid-2010, Mexico held a general census of its population and households. The majority of census respondents were required to complete a “basic questionnaire” of 29 questions, with a smaller number (2.7 million) asked to complete a “full questionnaire” with 75 questions.

The questions asked in the basic questionnaire (with a summary of the options for each response)  included:

Characteristics of the dwelling:

  • What are the floors made of? (earth/cement or concrete/wood, tiles or other)
  • How many rooms are used for sleeping (excluding passages)?
  • How many rooms are there in total, including the kitchen, but excluding passages or bathrooms?
  • Does the dwelling have electricity?
  • What is the water supply? (piped municipal supply/stand pipe/water piped from another dwelling/periodic water trucked in/river, well or lake)
  • Is the dwelling connected to a sewage system or septic tank?
  • Does the toilet have running water/water from buckets/no water?
  • Which of the following do the occupants of the dwelling own? – radio/television/refrigerator/washing machine/vehicle/computer/fixed line telephone/cell phone/internet.

Characteristics of each person in the household:

  • Sex, age, relation to head of household
  • Place of birth (state, if born in Mexico, or country, if born elsewhere)
  • Which medical services if any, do the occupants have access to? (IMSS, ISSSTE, Pemex or Armed Services, private provider, other, none)
  • Religion
  • Limitations in daily life? (walking, moving/vision, even when wearing glasses or contacts/speaking/hearing even when wearing a hearing aid/dressing, bathing, eating/learning simple new tasks/any form of mental difficulty/none)
  • Name of any dialect or indigenous language (ie other than Spanish) spoken

Education:

  • Are you currently enrolled in school, college or university?
  • Level of education already completed
  • Can you read and write a simple message?
  • Where did you reside 5 years ago? (state in Mexico, or country if outside Mexico)
  • Civil status (single/married/separated/divorced/widowed)

Employment

  • Last week, did you work at least one hour/have a job, but not work/look for work
  • Are you retired/student/homemaker/unable to work through physical or mental incapacity

Children

  • How many liveborn children have you had?
  • How many of these children have since died?

The first results from the 2010 census should be available from early next year. As results are published, Geo-Mexico will be updating facts and figures to highlight any important changes in Mexico’s geography.

The sustainable management of Mexico’s natural environment, 2006-2008

 Other  Comments Off on The sustainable management of Mexico’s natural environment, 2006-2008
Nov 062010
 

The IMCO report on the competitiveness of Mexico’s states, which we briefly described in an earlier post, includes a significant section devoted to the sustainable management of Mexico’s natural environment.

IMCO’s sustainable management factor incorporates 14 distinct variables. For almost every variable, the average of all 32 state values for that variable has improved between 2006 and 2008. Only 1 of the 14 variables has worsened, and three have remained unchanged.

photo of garbage

Sadly, not all garbage finds its way into regulated landfills...

The variable that worsened was the proportion of energy derived from “clean” sources, which fell from 18.9% of the total energy produced in 2006 to 17.6% in 2008.

The three variables that remained unchanged were:

  • the surface experiencing drought or aridity
  • the area where soil degradation is a problem
  • and the number of species considered endangered.

The following 10 variables all showed a significant improvement between 2006 and 2008:

  • the annual rate of reforestation, up from 1.1% to 1.7%
  • the number of “environmental emergencies”, down from 11.3 to 10.9
  • the total area formally protected (biosphere reserves, national parks, etc), which increased slightly
  • the value of agricultural production compared to groundwater consumed for agriculture, which also increased slightly
  • the over-exploitation of aquifers, which fell by more than 10%
  • the volume of sewage (wastewater) that is treated, which rose from 859 liters/sec per million inhabitants to 962 liters/sec
  • carbon dioxide emissions which fell to 0.3 parts/million
  • the percentage of all waste entering regulated landfills, which increased from 58% of all waste to 62%
  • a fall in the total generation hazardous wastes
  • an increase in the number of companies certified as “clean”

In addition, the gap between the top-performing state for this factor (Aguascalientes) and the bottom-performing states (Chiapas and Oaxaca) has closed significantly.

Mexico’s environmental trends and issues are examined in chapter 30 of Geo-Mexico: the geography and dynamics of modern Mexico. Ask your library to buy a copy of this handy reference guide to all aspects of Mexico’s geography today! Better yet, purchase your own copy…

Why are some parts of Mexico City sinking into the old lakebed?

 Excerpts from Geo-Mexico  Comments Off on Why are some parts of Mexico City sinking into the old lakebed?
Nov 042010
 

Mexico City was built originally (ca. 1325) on an island in the middle of a lake, and eventually became the capital of the powerful Aztec Empire.

The provision of potable water is a problem that has plagued the city for centuries. Deforestation in the 19th century depleted the springs that had supplied the city with fresh water via aqueducts (some dating from precolonial times). The first fresh water well was built in the city center in 1857. By 1900 there were hundreds of wells sucking water from the underground aquifer.

As more and more water was sucked up through the wells, the city began to sink. Some parts have dropped more than seven meters (23 ft) since 1891. Parts of the city center sank more than a meter between 1948 and 1951, and another meter by 1960. The city sank two meters below what remained of Lake Texcoco, posing a serious risk of flooding during the rainy season. In response, engineers sank wells into Lake Texcoco, sucked water from the aquifer, and the lake level dropped below the height of the city center.

Bellas Artes opera house, Mexico City

Rates of subsidence are very uneven. In places the weight of large buildings has caused them to sink into the dried out mud. The city’s magnificent Opera House (Palacio de Bellas Artes, see photo) sank so far that its original ground floor is now a subterranean basement. To slow down the rate of sinking in the city center, in 1950 new wells were drilled south of the city reducing central city sinking to its current rate of about 10 cm (4 in) a year. Of course, areas in the south started sinking more rapidly.

Elsewhere, buildings (including the Cathedral) have tilted and underground sewers and water pipes have cracked and broken. Furthermore, drains in the city center sank below the large drainage canals and pumps had to be added to lift storm water and sewage up to the drainage canals.

These ground movements pose major challenges for the construction and maintenance of the city’s extensive metro network.

This is a lightly edited excerpt from chapter 23 of Geo-Mexico: the geography and dynamics of modern Mexico. If you have enjoyed this post, please consider purchasing a copy of Geo-Mexico so that you have your own handy reference guide to all aspects of Mexico’s geography.

The impact of the economic recession on Mexico-USA migration

 Updates to Geo-Mexico  Comments Off on The impact of the economic recession on Mexico-USA migration
Nov 032010
 

Mexicans have been migrating from Mexico to find better employment for decades. Virtually all of this migration, over 95%, is to the USA. Migration to the USA accelerated rapidly after about 1970. Throughout this period, there has been a strong current of return migration back to Mexico. At present there are about 12 million Mexican-born residents of the USA.

The net flow of migrants peaked at about 550,000 in 2006-07.  That year over one million Mexicans entered the USA and just under 500,000 returned to Mexico. However, the recent economic recession had a strong negative impact on immigration from Mexico.

The net flow 2007-08 was down to about 375,000, with just over 800,000 entering and about 440,000 returning to Mexico. A year later, the net flow was about 200,000, with roughly 635,000 entering and 435,000 returning. Data for 2009-10 are not yet available.

It is interesting to note that in the two year period between 2006-07 and 2008-09 immigration dropped by almost 40%, while return migration declined by less than 10%. Apparently, potential immigrants in Mexico knew that jobs are scarce in the USA and thus they were relatively reluctant to migrate. On the other hand, many Mexicans in the USA appear to be hanging on and making money however possible in an effort to stay in the USA. This is particularly interesting because one might assume that undocumented workers in the USA might be among the first to be laid off.

Source:

J.S. Passel and D. Cohn; “Recession Slows – but Does Not Reverse – Mexican Immigration”, Pew Hispanic Center, Washington DC, July 22, 2009.

Migration between Mexico and the USA is the focus of chapter 25 of Geo-Mexico: the geography and dynamics of modern MexicoAsk your library to buy a copy of this handy reference guide to all aspects of Mexico’s geography today! Better yet, order your own copy…