Geography research in Oaxaca funded by the US military stirred up a storm of protest

 Other, Teaching ideas  Comments Off on Geography research in Oaxaca funded by the US military stirred up a storm of protest
Feb 282011
 

In 2005, a geography research project known as México Indígena, based at the University of Kansas, received 500,000 dollars in funding from the US Defence Department to map indigenous villages in two remote parts of Mexico, in collaboration with the Autonomous University of San Luis Potosí , Radiance Technologies (USA), SEMARNAT (Mexico’s federal environmental secretariat) and partnered with the US Foreign Military Studies Office (FMSO).

Under some circumstances, this might not be a huge problem. After all, the large-scale survey maps of many countries were developed primarily by military engineers with military funding, in the interests of national security. In the past, several countries, including France and the UK, extended their map-making to cover their colonies or dependent territories.

What sets México Indígena apart is that, between 2005 and 2008, under the guise of “community participatory mapping”, US researchers, funded by the US military, collected detailed topographic, economic and land tenure information for several villages in Mexico, an autonomous nation, whose people have long viewed their northern neighbors with considerable suspicion. After all, in the mid-19th century, the USA gained a large portion of Mexico’s territory.

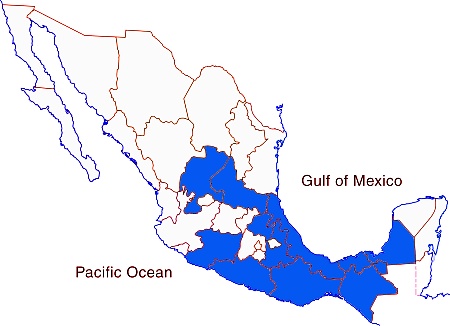
The indigenous villages mapped were in the Huasteca region of San Luis Potosí, and in the Zapotec highlands of Oaxaca, the most culturally diverse state in Mexico. The villages mapped in Oaxaca included San Juan Yagila and San Miguel Tiltepec.

México Indígena is part of a larger mapping project, the Bowman Expeditions. In the words of the México Indígena website:

“The First Bowman Expedition of the American Geographical Society (AGS) was developed in Mexico…  The AGS Bowman Expeditions Program is based on the belief that geographical understanding is essential for maintaining peace, resolving conflicts, and providing humanitarian assistance worldwide.”

“The prototype project in Mexico is producing a multi-scale GIS database and digital regional geography, using participatory research mapping (PRM) and GIS, aiming at developing a digital regional geography, or so-called “digital human terrain,” of indigenous peoples of the country.”

Mexico’s indigenous communities are the poorest in the country, beset by poverty, poor access to education and health care, and limited economic opportunities. Among the common concerns voiced by protesters against the mapping project were that the information collected could be used for:

  1. Counter-insurgency operations
  2. Identification and subsequent acquisition of resources
  3. Biopiracy

Despite attempts at clarification by the project leaders, some communities remain upset, claiming that they were not made aware of the US military’s funding, and have demanded that all research findings either be returned to the community or destroyed (see, for example, this open letter from community leaders in San Miguel Tiltepec).

Choose the conclusion you prefer:

1. Mexico’s indigenous peoples face enough challenges already. Their best way forward is if US military funding for mapping beats a hasty retreat, or

2. Mexico’s indigenous peoples face enough challenges already. Their best way forward is to welcome and embrace offers of help from outside their community.

Further reading/viewing:

The México Indígena controversy is the subject of a short film entitled, “The Demarest Factor: US Military Mapping of Indigenous Communities in Oaxaca, Mexico”. The film investigates the role of Lt. Col. Geoffrey B. Demarest ( a US Army School of the America’s graduate) and the true nature of the mapping project. It discusses parallels between US political and economic interests within the North American Free Trade Agreement (NAFTA) and a US military strategy designed to secure those very interests.

Things to think about:

  • Should academic research in foreign countries ever be funded from military sources?
  • Does the right of self-determination mean that indigenous peoples can refuse to cooperate with academic researchers, even when the research may bring benefits to the community?
  • Should researchers ever be allowed to collect information from a community without the community’s express consent?

The irony about the choice of “Bowman” for the AGS research expeditions.

Isaiah Bowman (1878-1950), born in Canada, was a US geographer who taught at Yale from 1905 to 1915. He became Director of the AGS in 1916, a position he only relinquished when appointed president of Johns Hopkins University in 1935. He served as President Woodrow Wilson’s chief territorial adviser at the Versailles conference in 1919. Bowman’s best known work is “The New World: Problems in Political Geography” (1921). His career has been subject to considerable scrutiny by a number of geographers including Geoffrey Martin (The life and thought of Isaiah Bowman, published in 1980) and Neil Smith who, in American Empire: Roosevelt’s Geographer and the Prelude to Globalization (2003) labels Bowman an imperialist, precisely the claim made by many of its opponents about the México Indígena mapping project.

Feb 222011
 

The Baja California peninsula is one of the most arid areas in Mexico and water shortages are becoming critical, especially along the southern coastline which has matured into one of the most desirable jet-set locations in the world.

Desalination, which involves removing the salts from seawater or brackish water to provide drinking water, is one viable option to ensure future water security for the region. There are already about 70 desalination plants on the Peninsula, though most are very small (25 liters/second or less) and are powered by conventional electricity. Several larger desalination projects on the Baja California Peninsula, some of which will rely mainly on solar power, are currently in the planning stages.

Map of Baja California PeninsulaLa Paz, the capital of the state of Baja California Sur, faces a particularly serious water supply problem. The local aquifer is reported to be already overexploited and suffering from salt water intrusions. Because of its greater density, seawater normally underlies freshwater in coastal areas. Salt water intrusions occur when so much fresh water is pumped out of coastal aquifers that it is replaced by the underlying salt water. The water supply issues have led to water rationing, in which almost half of La Paz’s 250,000 residents receive water only 12 hours or less each day.

Obtaining water from the desalinization of sea water is more expensive than abstracting water from aquifers via wells, but avoids the possibility of salt water intrusions.

A recent Ooska news article provides details of the desalination plants already built or being planned:

Baja California Sur:

Cabo San Lucas, opened in 2007, treats approximately 230 liters a second (60 gallons/s), equivalent to 20 million liters (5 million gallons) a day.

La Paz. Still at the proposal stage is a desalination plant capable of treating 200 liters a second.

Sierra de la Laguna. A Canadian mining company (Vista Gold Corp.) planned a desalination plant to provide water for its proposed Concordia open-pit mine. However, the mining plan was refused an essential permit by the Mexican government.

Baja California:

Ensenada. The 28-million-dollar El Salitral desalination plant is a “highly innovative project that would put the region on the map globally for desalination”. Construction is due to start later this year, and the plant should be operational by the end of 2012, when it will treat 250 liters of seawater a second. The plant would supply 96,000 people with potable water.

Rosarito. Preliminary geological and environmental impact studies are underway for a desalination facility in La Misión large enough to supply the needs of 96,000 people. Still in the concept stage is a second desalination plant  which would supply water across the border to San Diego in California.

San Quintín. Plans exist for a desalination plant with a capacity of 150 liters a second.

Main source: The OOSKA News Weekly Water Report for Latin America and the Caribbean (16 February 2011)

Want to read more?

Feb 192011
 

Tomatoes are one of the many native Mexican plants that have become essential ingredients in the cuisine of many countries. Mexico is the 10th largest tomato producer in the world, after China, USA, India, Turkey, Egypt, Italy, Iran, Brazil and Spain (FAO 2008).

Mexico produces both red tomatoes (tomate or jitomate, depending on the region) which have high yields and account for about 75% of total tomato production, and green tomatoes (tomate verde) which have a lower yield and account for the remaining 25% of production.

The statistics in this post apply to the production and export of red tomatoes only.

The main varieties of red tomatoes in Mexico are:

  • vine-ripe large rounds
  • cherry tomatoes
  • Roma tomatoes, which now account for 54% of all tomato plantings in Mexico, as demand for them has increased at the expense of other kinds
  • greenhouse tomatoes (the collective name for several other varieties)

Greenhouses

The single most significant trend in tomato growing in Mexico is the increasing volume of production coming from greenhouse (including shade house) cultivation. Greenhouse cultivation still represents only a small portion of total tomato production in Mexico, but results in greatly improved yields.

Mexico has around 3,200 hectares of horticultural greenhouses in total. An earlier post analyzed the essential characteristics and advantages of the production of horticultural products in greenhouses.

The major advantages for tomato production are:

  • helps to raise yields
  • enables producers to move away from seasonal production and grow tomatoes virtually the entire year
  • ensures a higher quality and consistency of product
  • facilitates better food safety
  • helps to ensure that production and packing plants meet or exceed international standards

Rising yields

Yields are rising. Open field yields have risen from 23 metric tons/ha in 1990 to 28 mt/ha in 2000 and to 39 mt/ha in 2010. The highest open field yields are about 45 mt/h in Baja California and Sinaloa, due in part to their efficient pest and disease control protocols.

Greenhouse cultivation of tomatoes gets much higher yields, but also requires more capital investment and more expensive inputs of labor, fertilizers and pesticides. Open field cultivation of tomatoes in Sinaloa and Baja California costs between $3,800 and $6,000/ha. Greenhouse and shade house production of tomatoes can cost up to $22,000/ha. (All figures in US dollars.) The costs associated with many imported inputs (agrochemicals, seeds and fertilizers) are high; they are also dependent on the peso/dollar exchange rate.

Greenhouse yields in Mexico are generally about 150-200 mt/ha. Tomato growers in the USA and Canada using greenhouses achieve yields of up to 450mt/ha, so Mexican producers still have plenty of room for continued improvement.

The largest area of greenhouse tomato cultivation is in Spain (20,000 hectares). By comparison, the USA has only around 350 ha of greenhouse tomatoes, Canada has 650 ha and Mexico 730 ha.

Area cultivated and volume of production

The total area (greenhouse and open field) devoted to tomato cultivation in Mexico has decreased in recent years, from 85,000 ha in 1990 to about 60,000 in 2010.

Tomato production in Mexico for the 2010/11 season is forecast to reach 2.2 million metric tons.

Seasonality

There are two major seasons:

1. In the winter season (October-May), growers in Sinaloa are the main producers and exporters of fresh tomatoes. Michoacán, Jalisco, and Baja California Sur also produce significant amounts in the winter season. Sinaloa growers have adopted very modern cultivation methods, selecting varieties with an improved and extended shelf life, employing highly efficient drip irrigation, and using plastic mulch to maintain their high yields. Sinaloa has 15,000 hectares devoted to tomatoes, of which 1,340 hectares are using greenhouses or shade houses.

2. During the summer season (May-October), growers in Baja California are the main producers and exporters of fresh tomatoes, along with growers in Michoacán, Jalisco, and Morelos.

Tomatoes on a stamp

Mexico Exports: Tomatoes

Domestic consumption and the export market

The final consumption figure for the domestic market depends largely on the volume of tomato exports (primarily to the USA), since domestic consumption is essentially restricted to those tomatoes that do not enter the export flow. Volumes of exports, and price/ton depend on numerous factors beyond the control of farmers in Mexico, including, for example, the seasonal weather in Florida which will help determine the volume of tomatoes produced in the USA.

The USA imports tomatoes from both Canada and Mexico. Mexico’s share of USA tomato imports has risen rapidly since 2000 on account of their lower costs. Mexican tomatoes are less expensive for USA buyers than their Dutch or Canadian counterparts, due to Mexico’s cheaper labor rates, lower transport costs, and their modern cultivation and packing systems.

Mexico’s 1.1 million tons a year of tomato exports are worth 1.1 billion dollars. Mexico does import some tomatoes, but the annual value of imports rarely exceeds 65 million dollars.

Potential risks faced by Mexico’s tomato growers

  • extreme heat may make tomatoes ripen earlier than usual, as happened in Sinaloa in December 2009
  • the switch from open field tomato production to protected production (in greenhouses or shade houses) requires an expensive investment in infrastructure and technology.
  • international prices each year are a major determinant of how many hectares of tomatoes are planted the following year

Note on the first GM tomato

The first GM tomato to be commercially cultivated was the Flavor Saver from the Calgene company, planted in 1995 in Mexico, California and Florida. It was marketed as the MacGregor tomato. It was primarily developed because it did not spoil as quickly as previous varieties of tomato. MacGregor tomatoes last at least 18 days without spoiling, from the time they are picked. Conveniently, consumers also preferred their taste to then-existing varieties. Developing the first GM tomato cost Calgene 25 million dollars and took 5 years.

Main source:

Flores, D and Ford, M. Tomato Annual: area planted down but production up. USDA Foreign Agricultural Service GAIN (Global Agricultural Information Network) Report, January 2010


The ten states in Mexico with the lowest population density

 Other, Teaching ideas  Comments Off on The ten states in Mexico with the lowest population density
Feb 172011
 

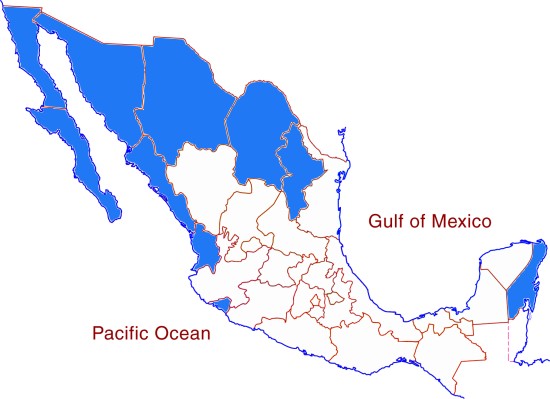
In a previous post we looked at “The ten states in Mexico with the highest population density“. At the end of that post, we suggested that you try to guess which 10 states in Mexico have the lowest population density. In this post, we look at the answer!

Below is a table showing the 10 states in Mexico with the lowest population density.

RankStatePopulation density (people/sq.km)
1Baja California Sur8.6
2Durango13.2
3Chihuahua13.7
4Campeche14.3
5Sonora14.7
6Coahuila 18.1
7Zacatecas19.8
8Quintana Roo29.9
9Nayarit38.9
10Oaxaca40.6

You probably got many of the answers right, since several of the states in the table are among Mexico’s largest states in terms of area. In fact, Mexico’s five largest states (Chihuahua, Sonora, Coahuila, Durango and Oaxaca, are all on the list. However, there are some surprises. For example, both Nayarit and Campeche are smaller than the average Mexican state. Why might this be so? Large parts of each state currently have very few residents. Much of Nayarit is either mountainous terrain or swampy, coastal wetland. A large part of Campeche is sparsely peopled tropical evergreen forest (tropical rainforest).

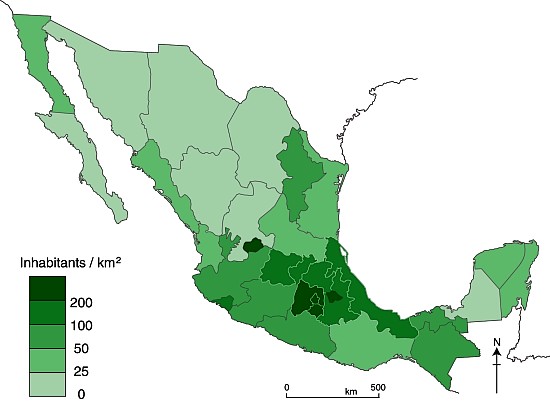
To conclude this brief look at population density, here is a map showing the population density of all Mexico’s 32 states. [For simplicity, we count the Federal District as a state.]

Population density map
Mexico’s population density in 2010

Several chapters of Geo-Mexico: the geography and dynamics of modern Mexico discuss population issues, including population distribution and population density. Buy your copy today to have a handy reference guide to all major aspects of Mexico’s geography!

Feb 162011
 

The commercial greenhouse production of horticultural crops in Mexico started in the 1950s, with floriculture (flower-growing) operations. It then expanded to include some vegetables in the 1980s. During the 1990s, larger, more modern greenhouses were introduced specializing in the growing of vegetables for export markets.

In 1991, Mexico had only 51 hectares of vegetable production in greenhouses. The signing of NAFTA in 1994 stimulated increased investment in Mexico from Israel, Holland, and Spain in greenhouse systems designed to boost vegetable production for the US market.

The area of greenhouses has risen rapidly since then to about 2,400 hectares in 2009, almost double the area recorded for 2005, and including 1,000 hectares devoted to flowers.

What are the advantages of production using greenhouses?

  • possible to control the environment
  • enables a higher quality of product, suitable for international markets
  • improves food safety
  • allows growers to have a tighter control on water quality
  • enables farmers to supply winter markets when fresh food prices are at a premium
  • avoids or offsets weather-related problems, such as cold spells or heavy rain
  • allows farmers to perfect crop timing to match times of highest prices
  • avoids some open-field issues such as weeds and insect pests
  • takes advantage of Mexico’s long days and many hours of strong sunlight

What are the disadvantages of production using greenhouses?

  • construction costs
  • costs to install necessary infrastructure, such as water supply
  • cost of energy required to heat greenhouse in the event that sunshine is insufficient
  • nearby residents may object to the unsightly view of hectares of greenhouses

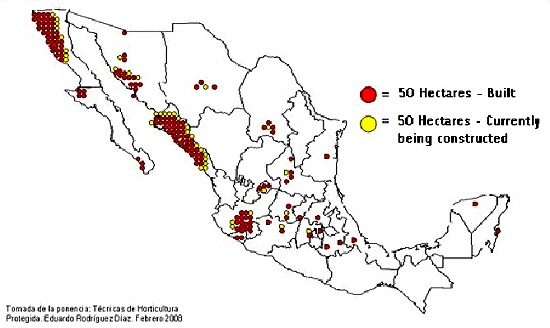
Protected horticultural areas in Mexico

Protected agricultural areas in Mexico (greenhouses and shade houses), 2007. Source: Mexican Association of Protected Horticulture

Where are most of Mexico’s greenhouses located?

Vegetable greenhouse production is highly developed in five states (see map):

  • Sinaloa (26.3% of Mexico’s total production of greenhouse vegetables)
  • Baja California Sur (13.5%) -NB this state’s protected area has increased sharply since 2007, the date of the map
  • Baja California (9.5%)
  • Jalisco (7.4%)
  • Sonora (6.9%).

Combined, these five represent 84% of the total greenhouse production of vegetables.

By area planted, the major crops produced in greenhouses in Mexico are:

  • tomatoes (60% of the total)
  • cucumbers (20%)
  • chiles (10%)

One clear trend is that the area of all these crops is expanding very rapidly. For instance, from 2007 to 2008, the area devoted to the greenhouse production of tomatoes rose 19%, while chiles and cucumbers rose 35% and 29% respectively.

95% of Mexico’s greenhouses are plastic, rather than glass, mainly because the extra insulation afforded by glass is not required in most parts of Mexico given the climate. Many greenhouses are now made in Mexico, but others are imported from Israel, Canada, the Netherlands, Spain, France and the USA. Many of the greenhouses are high-roofed, between 4 and 5 meters tall.

A basic greenhouse structure covering 1 hectare (2.4 acres) costs about $160,000, excluding the cost of any irrigation system. Because financing is difficult to obtain in Mexico, many producers rely on relatively low-cost plastic greenhouses, which do not usually have any heating systems. Some newer models have hot water or gas heating systems which guarantee that crops can be timed to coincide with peak demand during the US winter.

In an effort to hasten the adoption of improved horticultural technology, the Agriculture Secretariat (SAGARPA) has started a shared-risk fund to encourage greenhouse installation, provided it is to grow crops other than tomatoes, including herbs, chiles and lettuce.

Besides initial costs, another major constraint on the expansion of greenhouse systems in Mexico is distance from the main markets north of the border. From some areas, reaching markets in California requires a 36-hour truck ride. Any delay means that the crop will not arrive in optimum condition.

Another limitation which restricts the universal adoption of greenhouses is that they generally need a good supply of water. This is not always easy (or cheap) to obtain, especially in arid areas such as Baja California.

Finally, as with most farmers, greenhouse operators in Mexico face competition from growers in other countries, and also have to contend with market volatility (whether real or perceived).

Sources:

Lopez, J. and K. Shwedel. 2001. The Mexican greenhouse vegetable industry. Industry Note 032-2001, 5 pp.

Cantliffe, D and Vansickle, J. Mexican Competition: Now from the Greenhouse. http://hos.ufl.edu/protectedag/pdf/MexicanGHindustry.pdf [accessed 22 January 2011]

Flores, D and Ford, M. Greenhouse and Shade House Production to Continue Increasing. USDA GAIN report, 22 April 2010. [accessed via link at http://www.freshplaza.com/news_detail.asp?id=62580; accessed 27 January 2011]

The ten states in Mexico with the highest population density in 2010

 Other, Teaching ideas  Comments Off on The ten states in Mexico with the highest population density in 2010
Feb 102011
 

The table below shows the ten states in Mexico with the highest population density (people per square kilometer) in 2010.

Question:

  • Find a blank map of Mexico [click here for a printable pdf map of Mexico] and locate each of these ten states.
  • What do these ten states have in common?
  • Can you suggest a reason or reasons for any pattern you have found?

[the answer appears at the end of this post; no peeping until you have come up with an answer!]

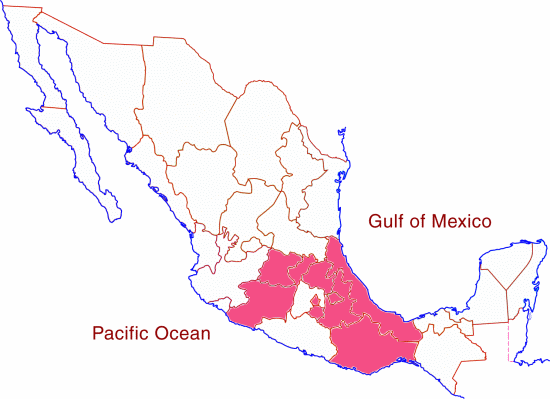
RankStatePopulation density, 2010 (people/square km)
1Federal District5,936.8
2State of Mexico678.9
3Morelos364.2
4Tlaxcala292.6
5Aguascalientes211.0
6Guanajuato179.2
7Puebla168.5
8Querétaro156.2
9Hidalgo128.0
10Colima115.5

Did you suggest that these states are all small in area? If so, well done! The list of the ten states with the highest population density includes the eight smallest states in Mexico in terms of area, and all ten of the states are in Mexico’s twelve smallest states. The other two small  states, neither of which has a very high population density, are Nayarit and Tabasco; they are both smaller than either Puebla or Guanajuato.

Why should small states have higher population densities than large states? The main reason is because it is likely that a higher percentage of their area will be used for villages, towns and cities, and there will be less countryside (where population densities are usually very low) than is likely in large states. Of course, many other factors also play a part, including the location of resources (minerals, soil, water, biodiversity), the opportunities for employment and the relative wealth of the area (people may migrate from poorer areas to areas which they think are richer or offer more opportunities).

In a future post, we will take a look at which states in Mexico have the lowest population density.But, before we do, which states do YOU think will have the lowest population density? Choose your “top ten”, make a list or mark them on your map, and come back to Geo-Mexico next week to see if you are right…

The 10 states in Mexico with the lowest male-female ratios

 Other  Comments Off on The 10 states in Mexico with the lowest male-female ratios
Feb 072011
 

In an earlier post, we looked at the ten states with the highest male-female ratios (ie the most males for every 100 females). This time we turn our attention to the ten states with the lowest male-female ratios (or the most females for every 100 males). Male-female ratios are sometimes referred to as “sex ratios”, though that term does not indicate clearly whether the values are males for every 100 females (the usual interpretation) or females for every 100 males.

States with low male-female ratios

The 10 states with the lowest male-female ratios

Male-female ratios are an important demographic statistic and reflect numerous environmental, economic and social factors. In turn, they influence many aspects of economic and social geography. This Wikipedia entry on Human Sex Ratio offers a general introduction to some of the geography associated with male-female ratios.

The table and map show the 10 states in Mexico with the lowest male-female ratios.

RankStatemale-female ratio (males/100 females)number of females per 100 males
1=Federal District91.8108.9
1=Oaxaca91.8108.9
3Puebla92.1108.6
4Guanajuato92.8107.8
5Hidalgo93.2107.3
6Michoacán93.4107.1
7Morelos93.5107.0
8=Tlaxcala93.7106.7
8=Veracruz93.7106.7
10Querétaro94.3106.0

What do these states have in common?

The short answer would appear to be not very much, apart from forming a band across central Mexico!

The Federal District may offer far more employment opportunities for females than for males. Females who live in other states may be more likely to migrate to Mexico City in search of employment than to attempt the more complicated migration to the USA which has become the preferred option for many young males.

Oaxaca, along with Guanajuato and Michoacán, has a high rate of out-migration. In most situations, demographers consider that males are more more likely to migrate than females. This gender imbalance in migration would leave a low male-female ratio at the place of origin. Out-migration may also explain why Morelos and Tlaxcala, two of the smallest states in Mexico, are on the list.

In conclusion, while male-females ratios are an important population statistic, it is not necessarily always easy to explain them, especially when considering a country as complex as Mexico.

Relevant posts previously published on this blog:

Several chapters of Geo-Mexico: the geography and dynamics of modern Mexico discuss population issues, including population growth, distribution, gender differences and density. Buy your copy today to have a handy reference guide to all major aspects of Mexico’s geography!

Mexico’s ambassador to the UK protests to the BBC

 Other  Comments Off on Mexico’s ambassador to the UK protests to the BBC
Feb 012011
 

Mexico’s ambassador to the UK, Eduardo Medina-Mora Icaza, has written to the BBC, demanding an apology for remarks made in a recent episode of Top Gear, the BBC’s flagship motoring program. Co-presenter Richard Hammond made the remarks during a review of the Mexican sports car, the Mastretta, labeling Mexicans as “lazy, feckless, flatulent and overweight”. The overweight comment might be accurate, but the ambassador is (rightly) outraged at the other words used by Hammond, and by other comments made in the show.

Jeremy Clarkson, Top Gear’s lead presenter, suggested at the time, and on air, that the Mexican ambassador would not complain about the comments because he would be slumped asleep in front of the television. The time has come for the BBC to make Clarkson eat his words, and issue a full apology.

The limited edition Mastretta MXT enters production this year; 150 cars will be made in the first year. It is the first sports car to be entirely Mexican designed and made.

[Uupdate: 2016 – The Mastretta MXT is no longer in production – see Mastretta press release]

Related post:

The 10 states in Mexico with the highest male-female ratios

 Other  Comments Off on The 10 states in Mexico with the highest male-female ratios
Jan 312011
 

Male-female ratios are a useful way of looking at population dynamics. They may reflect, or may influence, many aspects of social and economic geography from employment opportunities to rates and age of civil partnerships (including marriage).

In 2010, only four states in Mexico had more males than females: Baja California, Baja California Sur, Sonora and Quintana Roo (see table).

RankStateMale-Female ratio (males/100 females)
1Baja California Sur104.5
2Quintana Roo103.3
3Baja California101.8
4Sonora101.3
5Nayarit99.5
6Nuevo León99.4
7Sinaloa98.9
8Chihuahua98.7
9Coahuila98.6
10Colima98.4

States with high male-female ratios

The ten states with the highest male-female ratios (2010)

What do these states, at opposite extremes of the country, have in common?

They are among the most economically dynamic states. All except Sonora have a vibrant tourism sector, where employment opportunities in the construction sector (mainly for young males) have offered young people an alternative to migrating north of the border.

Sonora has a more mixed economy,which includes an important mining sector (another predominantly male source of employment), as well as agriculture, manufacturing and some tourism.

In a future post, and to avoid any accusation of gender bias, we will look at the states which have the highest proportion of females (i.e. the lowest male-female ratios, the lowest number of males/100 females).

Several chapters of Geo-Mexico: the geography and dynamics of modern Mexico discuss population issues, including population growth, distribution, gender differences and density. Buy your copy today to have a handy reference guide to all major aspects of Mexico’s geography!

The cultivation of oranges in Mexico

 Other  Comments Off on The cultivation of oranges in Mexico
Jan 242011
 

Oranges are one of the most popular fruits in Mexico. It may come as a surprise, but oranges are not a native fruit.

History of oranges in Mexico

The first oranges were brought on Columbus’ second voyage to the Americas. Early Spanish settlers began to cultivate orange trees almost as soon as they arrived.

For instance, in an early account of the town of Chapala, Father Antonio Tello, wrote that, “In 1562, Father Sebastián de Párraga came to this friary [Chapala] and planted the church’s orange trees.”

A later account describes Chapala in 1586 as having so many fruit trees that “the entire village is like an orchard. The Indians make a lot of orange blossom water and from it a lot of money. It is so fertile for oranges that, in the garden of the friary where there are many of these trees, they took from a sweet orange tree a branch that had eleven good, big, mature, yellow oranges, crammed together on top of each other.”

Aromatic orange blossoms have found numerous uses over the years, from being carried in wedding bouquets, to a cooking ingredient, to use in candies, teas and perfumes.

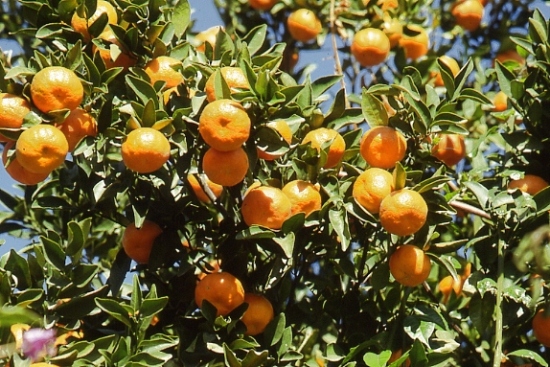
oranges

Production of oranges in Mexico

Orange trees may not be a native plant, but they have certainly thrived in Mexico, which is now the world’s fourth largest producer of oranges. Mexico produces about 4.1 million tons of oranges each year; only Brazil, the USA and India produce more.

The three main varieties grown in Mexico are:

  • Valencia or Valenciana – the prime orange for juice, ripens in May
  • Lane Late Navel oranges, available from February – primarily for eating, not good for juice
  • Navelina oranges, another variety of navel orange, used for juice, but also eaten, harvested from December

Ornamental orange trees, commonly found in Mexico’s towns and cities, are usually bitter oranges.

Areas where oranges are grown

Source: SAGARPA 2010

Where are oranges grown?

Veracruz is by far the leading state for growing oranges. It has 162,000 ha of orange orchards, and produces more than 2 million metric tons a year, about 51% of Mexico’s total production. Other states where orange growing is important include Tamaulipas (13% of national production), San Luis Potosí (10%), Puebla (6.2%), Nuevo León (4.9%) and Sonora (4.1%).

The area of cultivation for oranges (342,000 hectares nationwide) has remained virtually unchanged over the last decade.

The average yield across Mexico for oranges is about 12 tons/hectare, though yields in some states, such as Sonora, are up to twice as high. Yields vary from one year to the next reflecting seasonal weather conditions.

For those states where orange growing is an important rural occupation, the price paid in 2009 to the grower for oranges varied from 1.3 pesos/kg in Tamaulipas to 0.80 pesos/kg in Veracruz.

The market for oranges

Almost all production is for the domestic market. Consumption of oranges in Mexico averages about 38 kg/person/year.

Improving methods of cultivation have increased yields, allowing Mexico to produce a small surplus for export. Exports have more than doubled since 2000. Almost all exports are either to the USA 74.5% or the UK (24.6%), with the small remainder going to other European countries and Japan. Export sales were worth 7.150 million dollars in 2009, equivalent to about 1% of the total value of the orange harvest in Mexico. Imports of oranges in 2009 were worth 3.400 million dollars; they have fallen significantly from the 9 million dollars registered in 2003. The values for imports and exports mean that Mexico has a small favorable balance of trade from oranges of around 3 million dollars a year.

Main sources:

Ciudad Juárez faces economic fallout from the effects of the war on drugs

 Other  Comments Off on Ciudad Juárez faces economic fallout from the effects of the war on drugs
Jan 142011
 

Ciudad Juárez (2010 population: 1.3 million) is regularly in the news for all the wrong reasons. Many factors have combined to increase the insecurity (economic and social) of the city in recent years. They include:

  • the 2008-2010 recession in the USA
  • the ready availability of guns, mainly introduced illegally into Mexico from the USA
  • violence associated with the Juárez cartel in its efforts to control this international drug-smuggling gateway
  • “fund-raising” by the Juárez cartel, which includes the payment of protection money by local businesses, as many as 50% of which are thought to comply with cartel demands
  • violence between members of competing drug gangs
Poster advertising event in Plaza de las Americas, Cd. Juárez

Poster advertising event in Plaza de las Americas, Cd. Juárez

One particular commercial zone has been particularly badly hit. The Pronaf (Programa Nacional de la Frontera) zone is a commercial area in the northern part of Ciudad Juárez, centered on the Plaza de las Americas shopping center, immediately south of the Córdova-Américas International Bridge. The zone offers a mix of restaurants, stores, nightclubs, money exchange outlets, pharmacies and dental offices and even a museum. The customers for the businesses in this area are mainly US tourists and the many daily commuters across the border.

The result of increased levels of violence and unrest is that an estimated 60% of the 400 or so businesses that were open prior to 2008 in the Pronaf zone have now closed. This has caused a large number of job losses, exacerbating the economic difficulties already faced by hundreds of families.

Map of Pronaf zone

Related post about drug cartels in Mexico

Chapters 21 and 22 of Geo-Mexico: the geography and dynamics of modern Mexico analyze Mexico’s 500-year transition to an urban society and the internal geography of Mexico’s cities. Chapter 23 looks at urban issues, problems and trends. An overview of the geography of drug trafficking in Mexico forms part of chapter 20. To preview more parts of the book, click here and use amazon.com’s “Look Inside” feature; buy your copy today!

Jan 102011
 

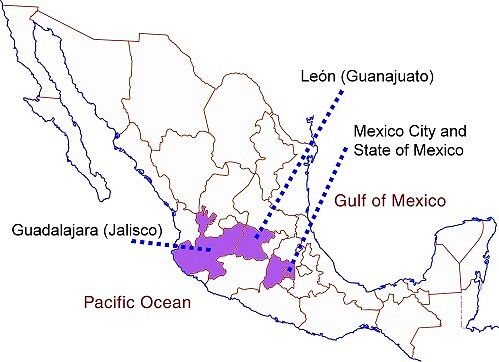
We saw in an earlier post – Mexico’s shoe (footwear) manufacturing industry: regional clustering – that Mexico’s shoe manufacturing is concentrated in three major areas: León (Guanajuato), Guadalajara (Jalisco) and in/around Mexico City.

Shoes are also an important international trade item. Latin America’s largest international footwear trade show is SAPICA (Salón de la Piel y el Calzado), which is held in León twice a year. Each time, it attracts 12,000 buyers from the USA, Canada, Europe, Japan, and Central and South America.

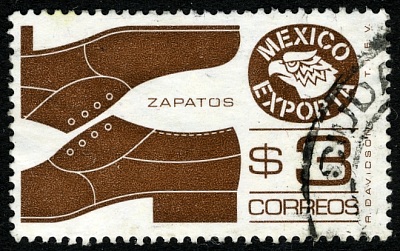
Mexico exports: shoes

Mexico exports: shoes

Exports

  • Export volume: 15 million pairs/yr
  • Value of exports: $250 million (dollars). Exports have risen steadily since 2006, despite the global economic difficulties.
  • Export destinations, by volume: USA 82%, Brazil 5%, Guatemala 2%, Japan 2% and Canada 2%.
  • Export destinations, by value: USA 84%, Japan 4%, Canada 2%, France 1% and Brazil 1%.

Imports

  • Import volume: 45 million pairs/yr
  • Value of imports: $450 million; this figure is rising at 15-20%/yr
  • Sources of imports, by volume: Vietnam 39%, Indonesia 21%, China 11%, Brazil 7%, Malaysia 5% and Thailand 5%.
  • Sources of imports, by value: Vietnam 43%, Indonesia 16%, China 14%, Italy 7% and Spain 6%.

Q. What can you deduce about Mexico’s international shoe imports and exports by comparing the percentages for trade by volume and trade by value? (eg. which countries supply more expensive shoes?)

The threat from China

At first sight, these figures do not suggest that Mexican manufacturers have much to worry about from Chinese shoe manufacturers. However, it is believed that many of the shoes entering Mexico from Vietnam and Indonesia actually originate in China. In addition, some Chinese shoes are thought to be repackaged in the USA for eventual export to Mexico.

Shoe manufacturers’ representatives in Mexico opposed China’s entry into the World Trade Organization (WTO) since they feared it would unleash a flood of cheap Chinese imports into the country. In an effort to help protect national manufacturers, the Mexican government has, for most of the past 20 years, levied a compensatory 35% tariff on shoes originating in China.

Challenges faced by Mexico’s shoe industry

  • Mexico’s shoe industry faces periodic shortages of some raw materials. In addition, the sector’s supply chains and delivery systems need strengthening.
  • The improvement of product quality may require further investment in technology and research.
  • As tariff barriers are lifted, Mexico’s shoe manufacturers will face greatly increased competition from overseas.

Source of statistics: CICEG (Guanajuato Shoe Manufacturers Association) Situación de la industria del calzado en México.

Related posts:

Mexico’s economic geography is analyzed in chapters 14–20 of Geo-Mexico: the geography and dynamics of modern Mexico. Buy your copy of this invaluable reference guide today!

Jan 052011
 

Mexico’s footwear industry is heavily concentrated in three main locations. Manufacturing is focused on the city of León in the state of Guanajuato. Factories and workshops in León account for about 68% of all shoes made in Mexico. The two other important manufacturing areas for footwear are Guadalajara (Jalisco) where about 18% of the national production originates, and Mexico City (together with surrounding parts of the State of Mexico), responsible for 12%.

How has this concentration come about?

León, in Guanajuato, is the center of one of the world’s most complete leather and footwear clusters. The area is a leading supplier and exporter of footwear, saddles and hats.

Footwear has been made in Guanajuato since 1645. The earliest association of shoe makers dates back to 1808. The sector is dominated today by firms with majority Mexican capital. Several of the foreign firms which manufactured shoes here prior to the second world war, changed the focus of their production lines in the early 1940s to specialize in supplying military footwear, leaving the making of consumer footwear to firms with national capital.

Footwear industry in Mexico

Concentration of shoe industry in Mexico.

The advantages of concentration

1. Local raw materials. Local inputs of leather and synthetics reduce the transportation costs (and time) for obtaining raw materials

2. Shared suppliers. Supporting the leather and footwear firms are local suppliers which offer machinery and equipment for tanneries, chemicals, leathers and skins, synthetic materials, dyes and textiles, as well as more specialized shoe-related items such as lasts, soles and heels, accessories and fittings. Shared information and machinery Because the shoe firms are grouped together in a cluster, ideas and information and even specialized machinery can all be shared.

3. Labor. This area has long specialized in footwear and leather products, so all firms benefit from the skilled local labor force.

4. Linkages. Both vertical and horizontal linkages between companies are important in the shoe industry. Vertical linkages occur when one company controls many or all stages in the production line. For instance, a company may make its own accessories and fittings to attach to the shoes it makes, or it may tan its own leather.  Horizontal linkages exist where one company is supplied with components (heels, soles) made by another company.

5. Economies of scale.

6. Educational infrastructure. The León area has a variety of educational, training and research centers all supporting the leather and footwear sector. This increases the chances of technological innovations, and the speed of their adoption.

The major advantages of León as an industrial location:

The position of León is key to its success. It is located in central Mexico, close to the major urban areas of Mexico City, Querétaro and Guadalajara. On a broader scale, it is close to the major export markets of the USA, Canada and Central America.

Market proximity is enhanced by an excellent communications network, including good road and rail links, easy access to several major airports, and to seaports such as Manzanillo.

The basic statistics (2009-2010):

  • Number of footwear-related firms: about 8000, half of them in Guanajuato.
  • Size of firms: 56% micro (fewer than 10 employees), 33% small (10-50 employees).
  • Employment: the footwear sector provides 140,000 direct jobs, and twice as many indirect jobs, for a total of 420,000.
  • Mexico’s largest shoe maker: Emyco, whose 4,500 workers make 6 million pairs of shoes, boots and sandals (various brands) every year. This firm alone introduces 100 new models every three months.
  • Production volume: 250 million pairs/yr, about 1.6% of world total.
  • Domestic market: 285 million pairs/yr (average of 2.5 pairs/person/yr)

The domestic market is focused on low-cost shoes, with a few exceptions, such as the market for “cowboy” boots. The manufacture of hand-crafted, high-priced cowboy boots is dominated by smaller firms such as Botas Je-Ver, Botas Jaca and Rancho-Boots, each of which employs 50-200 workers. Some cowboy boots are made from exotic hides, such as crocodile, cayman, armadillo, iguana, ostrich and snake. They are a much-prized status symbol among the upper echelons of Mexico’s drug cartels!

In future posts, we will examine Mexico’s imports and exports of shoes, and see if it is possible to identify any patterns to the distribution of shoe retailers in some of Mexico’s major cities.

Source of statistics: CICEG (Guanajuato Shoe Manufacturers Association) Situación de la industria del calzado en México.

Related posts:

Mexico’s economic geography is analyzed in chapters 14–20 of Geo-Mexico: the geography and dynamics of modern Mexico. Buy your copy of this invaluable reference guide today!

Expected impact on Mexico of global climate change

 Other  Comments Off on Expected impact on Mexico of global climate change
Dec 222010
 

The overall temperature of the earth is increasing faster now than it has for many millennia. According to a 2007 Intergovernmental Panel on Climate Change (IPCC) paper, the global surface temperature is expected to increase by 1.1 to 6.4 degrees C (2.0 to 11.5 degrees F) during the 21st century. According to the models, global warming will be most pronounced in the Arctic resulting in the melting of glaciers, permafrost and sea ice. Warming is expected to be less pronounced in Antarctic areas.

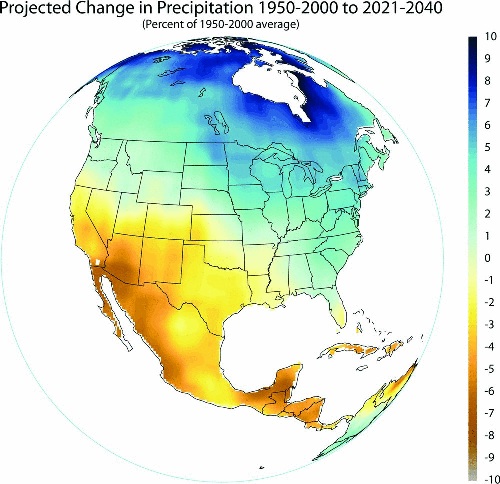
Precipitation change in Mexico, 1950-2000 and 2021-2040

Precipitation change in Mexico, from 1950-2000 to 2021-2040. Image/data: Gabriel Vecchi, Geophysical Fluid Dynamics Laboratory, National Oceanic and Atmospheric Administration.

Given the high average altitude of Mexico, the temperature changes and raising sea level should have less impact on Mexico than most other countries. Still, low laying areas of Mexico will be affected significantly.

Global warming will have profound impacts on the world’s climate. The most severe impacts on Mexico, and perhaps the whole Earth, could very well result more from climate change than global warming per se. In general, the affects will involve significant changes in average annual amounts of precipitation as well as huge year to year variability.

Mexico will experience significantly more severe droughts, floods, and storms including hurricanes. This trend has already started. In the 25 years between 1960 and 1985, Mexico experienced one category five hurricane – Beulah in 1967. In the 25 years since 1985, four category five hurricanes hit Mexico: Gilbert – 1988, Mitch – 1998, Wilma – 2005, and Dean – 2007. Fortunately, no category five hurricanes struck Mexico in 2009 or 2010. Are we due in 2011?

In general, precipitation in Mexico is expected to decline significantly in the next several decades. As you can see on the map, Western Mexico and the Yucatan will get 5% to 8% less rain. This is particularly important to Northwestern Mexico which is the most arid part of the country. Unfortunately, with the expected large increase in year to year variability, this part of Mexico is expected to suffer many very serious droughts. Obviously, less rainfall and greater variability will have gigantic impacts on Mexican agriculture, especially in the drier western areas.

Dec 182010
 

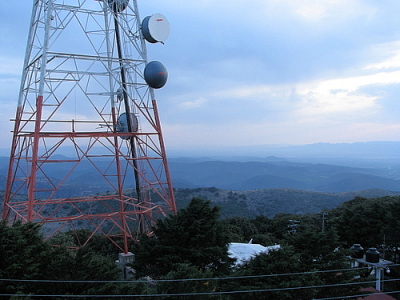
One of Mexico’s best kept travel secrets for people driving their own vehicle is the multitude of road signs all beginning with the word “microondas” (literally “microwaves”). Even visitors with good Spanish and a bilingual dictionary in their glove compartment may puzzle over the meaning of this frequently occurring sign, which invariably seems to lead onto a cobblestone track going, so far as one can tell, absolutely nowhere! There is no distant church tower, no sign of habitation, just a radio mast on the distant skyline. And that (rather than microwave ovens) is precisely what the sign refers to: a short-wave communications post!

One of the numerous benefits for the geographer is that virtually any microondas station offers a short, usually interesting side-trip, ideal for a brief respite from the demands of high speed highway driving. The well maintained, cobblestone tracks that provide access to the communications towers serve not only engineers, but also enterprising tourists. The access roads may follow devious routes but they eventually reach the gates of a fenced enclosure, invariably situated on the highest point for several miles in any direction. While there is no guarantee of an uninterrupted view, most microondas stations afford tremendous vistas over the surrounding countryside.

Microondas at top of Cerro de los Caballos. Photo: Gabriel Chaparro Tre….

View from the Microondas atop Cerro de los Caballos. Photo: Gabriel Chaparro Tre….

Very few vehicles use these excellent side roads, so they are usually safe and convenient places to stop, take a rest, stretch your legs and enjoy a picnic. As the tracks wind upwards, they often traverse successive vegetation zones, going from oak woodland up into pine forest if the mountain is high enough, for instance. This provides botanists and birders a range of habitats and transition zones worth exploring. Of course, some microondas sit on top of small mounds surrounded by a seemingly limitless flat and monotonous plain, home only to an infinite number of cacti. But others, the jewels of their kind, are in the midst of tropical rainforest looking out over canyons where spider monkeys can be seen leaping from branch to branch.

In the volcanic central areas of Mexico, microondas stations are commonly perched on crater rims, making many volcanoes fall in the “drive-in” category, including the Volcán Nevado de Toluca (Xinantécatl).  Full descriptions of the scenic wonders to be encountered on drives up, for example, Ceboruco volcano or Tequila volcano (the former in Nayarit state, the latter in Jalisco) merit a book unto themselves. To anyone who has never seen the legacies of past vulcanicity at close quarters, what more awesome and eye-opening introduction could there possibly be?

Needless to say, though you’re never far from the highway, you mustn’t expect to find any tourist amenities at microondas, not even “microwaved” fast-food. But don’t let that put you off visiting Mexican-style microwaves.

So, next time you spy “microondas” on a road sign (or, if you’re reading this in the depths of northern winter, the next time you press a button on your microwave!), remember – a short detour along one of Mexico’s best-kept travel secrets might well lead you to discover your own favorite stopping place. Someday, somewhere, someone should produce a comprehensive guide to the microondas of Mexico…

Mexico’s volcanic landscapes are discussed in chapters 2 and 3 of Geo-Mexico: the geography and dynamics of modern Mexico. Buy a copy as a seasonal gift today!

The geography of renewable energy from wind power in Mexico

 Other  Comments Off on The geography of renewable energy from wind power in Mexico
Dec 162010
 

According to the World Association of Wind Power, Mexico grew its wind power sector faster than any other country during 2009, and now has more than 500MW of installed windpower capacity.

Mexico’s goal is to have an installed capacity of 2,500 MW of wind energy by 2012, and to have 26% of the nation’s installed capacity coming from clean energy sources (solar, geothermal, wind, nuclear and large-scale HEP). The Federal Electricity Commission, responsible for the national power grid, is installing two “wind corridors” in Oaxaca to connect several different windpower plants into the grid.

Mexico’s Energy Secretariat recently announced the publication of a new resource of interest to planners and geographers. The Atlas of Wind and Solar power potential is designed to inform investors of the necessary meteorological and climatic background prior to taking significant investment decisions.

According to the Atlas, Mexico’s wind potential is estimated at 71,000 MW. This figure comfortably exceeds the nation’s current installed capacity for all forms of power of 51,000 MW.

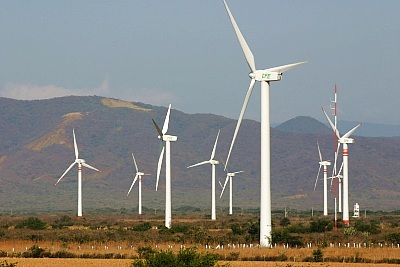
The most important single wind-power region in Mexico, and also one of the most important at the global scale is the Isthmus of Tehuantepec, the narrow belt of relatively low-lying land that links the Gulf coast (straddling the Veracruz-Tabasco state boundary) to the Pacific coast in the state of Oaxaca.

La Ventosa wind farm, Oaxaca

La Ventosa wind farm, Oaxaca

Several major wind farms have already been developed in the La Venta section of the Isthmus. Others are being constructed or on the drawing board. For example, Grupo Bimbo (which, with the acquisition of Sara Lee, has become the world’s largest bread- and pastry-maker) announced it is building a wind farm in association with Desarrollos Eólicos Mexicanos (Demex), a subsidiary of Spanish renewable energy firm Renovalia Energy. The “Piedra Larga” wind farm is under construction in Unión Hidalgo, Oaxaca. Costing $200 million, it will have an installed capacity of 90 MW when the first phase is complete, rising to 227 MW when the project is complete. This is sufficient energy to power all Bimbo’s producing and distribution needs in Mexico during the next 18 years at least. The first power will be generated early next year.

Two mining companies are also installing wind farms in Oaxaca, each with an installed capacity of 300MW.

Elsewhere, in Baja California, California-based Cannon Power Group plans is constructing a 1,000MW wind farm in Baja California. The 500 turbines of the 1-billion-dollar Aubanel Wind Project will be located southeast of the town of La Rumorosa, in the mountains between Tijuana and Mexicali. The turbines will supply power to both the USA and Mexico and are a separate project to the 1000MW wind farm planned by Energía Sierra Juárez, a subsidiary of Sempra, for an area north of La Rumorosa.

Currently, Mexico is developing wind power much more quickly than solar power, but this may change in the future, given that much of the country receives between 5 and 6kw/hr/square meter/day in solar energy, which is considerably more than most of the European countries which are now undertaking solar power development.

Related earlier post:

Energy is analyzed in chapter 16 of Geo-Mexico: the geography and dynamics of modern Mexico. and concepts of sustainability are explored in chapters 19 and 30.  Buy your copy today, so you have this handy reference guide to all aspects of Mexico’s geography available whenever you need it.

How much longer will Mexico be an exporter of oil?

 Other, Teaching ideas  Comments Off on How much longer will Mexico be an exporter of oil?
Dec 152010
 

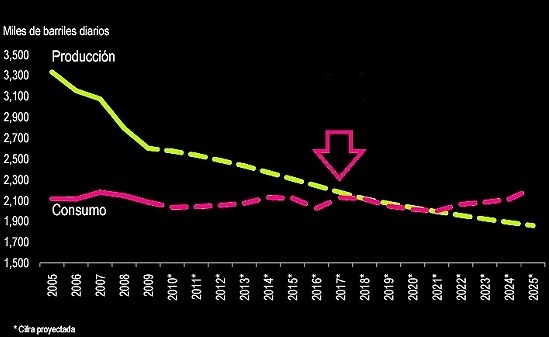
This interesting graph comes from a report published earlier this year by the Mexican Institute for Competitiveness (Instituto Mexicano para la Competitividad, IMCO). The purple line shows Mexico’s oil consumption in thousands of barrels/day from 2005 to 2009, with predicted values for the period 2010 to 2025. The yellow line shows Mexico’s oil production for the same period.

Graph of Mexico's oil production and consumption

Mexico's oil production (yellow) and consumption (purple), 2005-2025. Graph: IMCO.

Discussion questions:

  • In which year is Mexico’s consumption of oil predicted to equal its production?
  • What effects is this likely to have on Mexico’s economy?
  • What factors might cause this date to occur earlier than predicted?
  • What factors might cause this date to occur later than predicted?

A national map and summary of the methodology behind these rankings are provided in an earlier post:

For full details of the study:

Mexico’s economy and workforce are analyzed in chapters 14 to 20 of Geo-Mexico: the geography and dynamics of modern Mexico. Ask your library to buy a copy of this handy reference guide to all aspects of Mexico’s geography today! Better yet, order your own copy, which will still arrive in time for Christmas…

Dec 122010
 

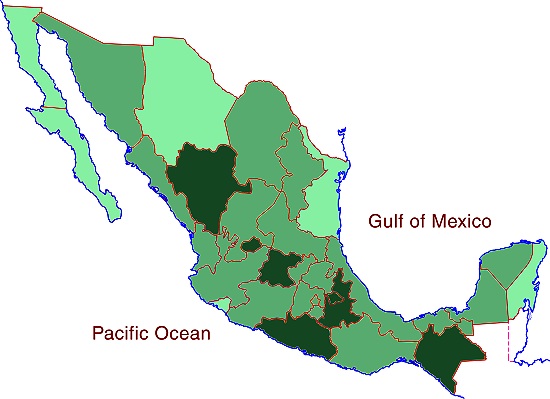
The map below shows the average number of inhabitants per household (“household size”) for each of Mexico’s states.

The national average household size is 3.9 persons. The middle band on the map shows those states with household size between 3.7 and 4.0 inclusive. The darkest shade shows states with a household size of 4.1 or greater; the lightest shade shows those with a household size of 3.6 or smaller.

Average household size in Mexico, 2010

Average household size in Mexico, 2010. Cartography: Tony Burton; all rights reserved.

Discussion questions:

  • Compare this map with the maps of:
  1. potable water,
  2. GDP/person
  3. infant mortality
  • Discuss the possible reasons for any connections you note between household size, potable water, GDP/person and infant mortality.
  • What other factors might also affect household sizes?
  • What are the drawbacks to using any of these measures (household size, potable water, GDP/person, infant mortality) on their own as a development indicator?

Development indices of various kinds are discussed in chapters 29 and 30 of Geo-Mexico: the geography and dynamics of modern Mexico. Ask your local library to purchase a copy today!

How good were the 2010 hurricane predictions?

 Other  Comments Off on How good were the 2010 hurricane predictions?
Dec 042010
 

In an earlier post – How many hurricanes are likely in the 2010 Atlantic hurricane season? – we reported on the predictions for this year’s Atlantic/Caribbean hurricane season

How close to reality did those predictions turn out to be?

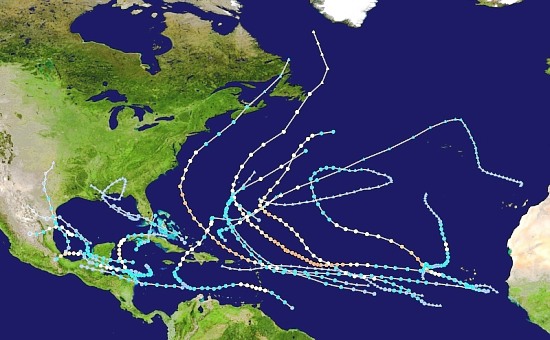
The predictions were for 8 tropical storms, 5 moderate hurricanes (1 or 2 on the Saffir-Simpson scale), and 5 severe hurricanes (3, 4 or 5 on the Saffir-Simpson scale). At the end of the season (30 November 2010), there had been 7 tropical storms, 7 moderate hurricanes and 5 major hurricanes. In total, these storms caused 259 deaths directly, and a further 23 indirectly, with total property damage estimated at US$11.4 billion. (Note that not all of these hurricanes affected Mexico).

Atlantic Hurricane tracks, 2010

Atlantic hurricane tracks, 2010. Created by Cyclonebiskit using Wikipedia: WikiProject Tropical cyclones/Tracks. Author: Cyclonebiskit and Syntheticalconnections

So, all in all, the predictions made before the hurricane season started were pretty close to the mark, and this hurricane season was indeed one of the most active on record.

Previous hurricane-related posts include:

Hurricanes and other climatological phenomena are analyzed in chapters 4 and 7 of Geo-Mexico: the geography and dynamics of modern Mexico. Buy your copy today, so you have a handy reference guide available whenever you need it.

The geography of Thanksgiving: no Thanksgiving feast is complete without pumpkin pie

 Other  Comments Off on The geography of Thanksgiving: no Thanksgiving feast is complete without pumpkin pie
Nov 252010
 

In earlier posts in this Thanksgiving mini-series, we examined how several of the essential ingredients of a Thanksgiving feast—turkey, corn and potatoes—originated in Mexico. We round off this Thanksgiving series with a  look at pumpkin pie.

All varieties of pumpkin, whatever their size and shape, belong to the Cucurbita genus. While there are some doubts about the precise origin of the wild forms of pumpkin, they were certainly being cultivated in Mexico as long ago as 5500 BC and were an integral part of the daily diet of many Indian groups. The use of “pumpkin” in English can apparently be traced back to the year 1547. For many people, pumpkins are eternally associated with both Thanksgiving and with Halloween.

Pumpkin pi

Pumpkin pi

Given that the first Thanksgiving was held in New Spain (Mexico) and that many of the essential ingredients of modern-day celebrations of Thanksgiving are Mexican in origin, when the residents of the USA sit down for their Thanksgiving meal, they really are taking part in an “All-American” celebration.

Many traditional Thanksgiving and Christmas dinners would simply not be the same were it not for a few key ingredients from Mexico!

So, wherever you are this festive season, keep your eyes open for Mexican influences…

¡Happy Thanksgiving, and seasonal greetings to all!

Previous posts in the Thanksgiving mini-series:

Potatoes, yet another Mexican contribution to Thanksgiving…

 Other  Comments Off on Potatoes, yet another Mexican contribution to Thanksgiving…
Nov 242010
 

Alongside turkey and/or corn at Thanksgiving and Christmas, the humble yet versatile potato is often eaten. That, too, was introduced to Europe from Mexico (though the plant appears to have originated in Andean Peru). A previous post delved into the connections between Mexico, the potato, and the Irish migration to North America following the potato famine of the early 19th century.

But did you also know that potatoes were originally sold in Spain on the strength of claims that they could cure impotence, at prices up to two thousand dollars a kilo?

Nowadays, potatoes in one form or another are virtually ubiquitous – from mashed or baked or potato salad, to French fries and the quintessentially Québécois variation of poutine (fries, curds and gravy).

On our Thanksgiving menu, we now have turkey, corn and potatoes, all of which originated in Mexico, but we still have one essential ingredient left… (for next time)

Previous posts in the Thanksgiving mini-series:

Geo-Mexico: the geography and dynamics of modern Mexico is your handy reference guide to all aspects of Mexico’s geography! Ask your library to acquire some copies today. Better yet, purchase your own copy…

Corn, another of Mexico’s gifts to Thanksgiving

 Other  Comments Off on Corn, another of Mexico’s gifts to Thanksgiving
Nov 232010
 

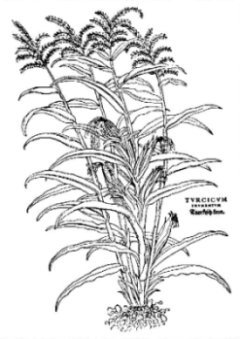
According to Ernst and Johanna Lehner in their Folklore and Odysseys of Food and Medicinal Plants, corn (which originated in Mexico) was misnamed as Turkish corn at the same time as turkey acquired its name, and for much the same reason. Europeans first saw corn, called maize or mahiz by the indigenous people, when Columbus and his followers arrived in the New World. They took samples back to Spain at the very end of the 15th century.

Turkish corn from Fuchs' De Historia Stirpium; Basle 1542

Turkish corn from Fuchs' De Historia Stirpium; Basle 1542

It quickly became an important crop, successfully cultivated throughout the continent. 16th century herbalists in Europe called the new plant by various names, including Welsh corn, Asiatic corn, Turkish wheat and Turkish corn. The latter name was the most usual, since they believed that the grain had been brought into central Europe from Asia by the Turks, who had introduced dozens of other products from the east into Europe at about the same time.

The Turks themselves called the crop “Egyptian corn”; the Egyptians called it “Syrian sorghum”… The German botanist Hieronymus Bock, in his New Kreüterbuch or herbal in 1546, remained on the fence, calling it “foreign corn”. Given the confused terminology, perhaps it is not surprising that, to quote Ernst and Johanna Lehner, “It took Spanish botanists more than 50 years to convince other European herbalists that corn was American.” Corn was given its botanical name, Zea mays, by Carl von Linné in the 18th century.

Previous posts in the Thanksgiving mini-series:

Geo-Mexico: the geography and dynamics of modern Mexico is your handy reference guide to all aspects of Mexico’s geography Ask your library to acquire several today! Better yet, purchase your own copy…

The geography of Thanksgiving: why a Mexican bird came to be called turkey

 Other  Comments Off on The geography of Thanksgiving: why a Mexican bird came to be called turkey
Nov 222010
 

Geographers who are Hungary like to eat Turkey, provided it does not have too much Greece.

The first in this Thanksgiving series of posts looked at how the first Thanksgiving was actually held in Mexico, and not the USA as more commonly claimed.

Many of the essential ingredients of the modern Thanksgiving feast also originated in Mexico. In this post, we take a look at the origins of the Thanksgiving (and Christmas) turkey.

How did the turkey eaten at Thanksgiving and Christmas acquire the same name as a European country? Or was it the other way around?

Modern day turkeys (the edible kind) are the direct descendants of the wild turkeys (Meleagris gallopavo) still found in many parts of Mexico.

Wild Turkey, Meleagris gallopavo Painting by John James Audubon, 1830

Wild Turkey, Meleagris gallopavo. Painting by John James Audubon, 1830

So, how is it possible that a Mexican bird acquired the name turkey? The most likely explanation derives from the fact that the merchants who traded in the Middle Ages between the Middle East and England were based in the Turkish Empire and hence known as “Turkey merchants”. Turkey merchants are also believed to have introduced the guinea fowl, a native of Madagascar, to European dinner tables.

Later, the larger New World bird, the present-day turkey, was brought back to Spain by the conquistadors. The rearing of New World birds gradually spread to other parts of Europe and North Africa. The Turkey merchants capitalized on the new opportunity, and began to supply the new birds instead of the guinea fowls to the English market, and the rest is history.

The first use in English of the word “turkey” to describe the bird dates back to 1555. By 1575 , turkey was already becoming the preferred main course for Christmas dinner. Curiously, the Turkish name for the turkey is hindi, which is probably derived from “chicken of India”, perhaps based on the then-common misconception that Columbus had reached the Indies.

Mexico’s wild turkeys had been domesticated by pre-Columbian Indian groups long before the Spanish conquistadors arrived. Several archaeological sites provide tantalizing clues as to precisely how turkeys were reared. One such site is Casas Grandes in the northern state of Chihuahua, an area where modern, large-scale turkey-rearing is still an important contributor to the local economy.

Previous posts in the Thanksgiving mini-series:

Geo-Mexico: the geography and dynamics of modern Mexico is your handy reference guide to all aspects of Mexico’s geography. If you have enjoyed this post, please consider gifting a copy of Geo-Mexico to someone this holiday season.

Nov 212010
 

If you live anywhere near Plimoth Plantation, Massachusetts, you may wish to stop reading right now…

For the benefit of our many non-US readers, Plimoth Plantation, Massachusetts is commonly cited as the “birthplace of Thanksgiving”. The first  Thanksgiving is said to have been held there way back in 1621.

Well, has Geo-Mexico got news for you

Several years ago, Don Adams and Teresa Kendrick wrote a compelling account of how the very first Thanksgiving celebration held by Europeans in North America was actually held on April 30, 1598.This is fully 23 years earlier than Plimoth Plantation.

From our Geo-Mexico perspective, even more important is the fact that they provide ample evidence to prove that this very first Thanksgiving was not held in the USA at all, but actually took place  in New Spain (Mexico)! So, Thanksgiving is actually of Mexican origin. Before we know it, the USA will be claiming tacos, tequila, and mariachis as well…

Incidentally, one curious feature of the original 1598 feast is that it apparently did not include either turkey or potatoes! We will continue this mini-series on the geography of Thanksgiving next time.

Happy Thanksgiving!

Geo-Mexico: the geography and dynamics of modern Mexico is your handy reference guide to all aspects of Mexico’s geography. If you have enjoyed this post, please consider gifting a copy of Geo-Mexico to your friends in the coming holiday season.

Which states in Mexico have the highest infant mortality rates?

 Maps, Other, Teaching ideas  Comments Off on Which states in Mexico have the highest infant mortality rates?
Nov 122010
 

Infant mortality is the number of deaths of infants (aged less than 1 year old) for every 1,000 live births. It is widely regarded as a very useful development indicator, and is one of the statistics used when calculating compound (multifactor) development indices. The Federal District has the lowest infant mortality rate in the county – 13.8, ahead of Nuevo León (14.0), Coahuila (14.8) and Baja California (14.9).

RankStateInfant mortality rate
22Michoacán20.0
23Campeche20.1
24Zacatecas20.3
25San Luis Potosí20.5
26Tabasco20.9
27Puebla20.9
28Hidalgo21.3
29Veracruz21.6
30Guerrero24.4
31Oaxaca24.6
32Chiapas25.3

The table lists the 11 states in Mexico which have the highest rates of infant mortality. No other state has an infant mortality rate of 20.0 or higher. The map clearly reveals that these states are mostly in the south of Mexico, a long way from the USA border.

Map of infant mortality

The eleven states with the highest infant mortality rates

Compare this map with the map of GDP/person. Are there any states which appear to be anomalies to the general rule that GDP/person and infant mortality rates are inversely related?

Development indices of various kinds are discussed in chapters 29 and 30 of Geo-Mexico: the geography and dynamics of modern Mexico. Ask your local library to purchase a copy today!

Nov 092010
 

In an earlier post, we looked at why ground subsidence has become such as serious problem in Mexico City.

The uneven subsidence poses a major challenge for engineering projects such as constructing (and maintaining) the city’s metro system.Mexico City metroThe Mexico City metro has 11 lines linking 175 stations, with a total length of 201 km (125 miles); an additional line is under construction. The metro is used by 5 million passengers a day. Some parts of the system are overground, but 56% of the network is underground. The deepest station is 35 m below street level. The Mexico City metro is the 7th most widely used in the world, after the metros in Tokyo, Moscow, Seoul, New York, Paris and Beijing.

  • many archaeological finds, including a pyramid, were made during the excavation required for Mexico City’s metro
  • Pino Suárez station was built around an ancient pyramid unearthed during metro construction
  • stations are named, but are also identified by simple glyph-like logos designed for easy use by people who have difficulty reading or writing
  • a single trip between any two stations on the network costs $3 pesos (about 25 cents US).; the metro is free for the elderly and physically-challenged
  • during peak hours, the Metro reserves some carriages for women and children only (no men)
  • almost all Mexico City metro cars run on rubber tires, making for a smooth, quiet ride

When the first line was built in 1969, one of the strategies adopted by engineers to limit damage from subsequent subsidence was apparently to build the metro tunnels and stations in such a way that their total weight was very similar to the weight of the mud and sediments removed during construction. Presumably, if the weights were identical, at least the tunnels would be likely to remain in the same relative positions over time, even if the subsoil contracted and sank. To a large extent, the engineers were successful, and the metro has experienced  amazingly few structural problems in its 41 years of operation. In the devastating 1985 earthquakes, Mexico City’s metro system sustained no serious damage despite the widespread destruction and loss of life above ground.

Mexico City’s metro network is administered by the Metro Transportation System (Sistema de Transporte Colectivo Metro, STCM). STCM ackowledges several recent problems related to small-scale earth movements on five of its eleven lines: Lines 4, 5, 9, A and B. For example, the maximum permitted velocities for metro trains were reduced for the section of Line A between Pantitlán and La Paz while repairs costing 36 million dollars were completed. Even as STCM undertakes the necessary repair work, it is starting to install a state-of-the-art, 1.6-million-dollar fiber-optic monitoring system which will eventually cover the entire network.  The system enables the “real time” detection (with live video feeds) of any subsidence, fissures, inundations or related issues.

Useful link:

Key question, based on the map:

  • Why does the metro system have a much higher density in eastern and southern Mexico City than in the northern and western parts of the city?

Chapters 21 and 22 of Geo-Mexico: the geography and dynamics of modern Mexico analyze Mexico’s 500-year transition to an urban society and the internal geography of Mexico’s cities. Chapter 23 looks at urban issues, problems and trends. To preview more parts of the book, click here and use amazon.com’s “Look Inside” feature; buy your copy today!

What questions were asked in Mexico’s 2010 population census?

 Other  Comments Off on What questions were asked in Mexico’s 2010 population census?
Nov 082010
 

In mid-2010, Mexico held a general census of its population and households. The majority of census respondents were required to complete a “basic questionnaire” of 29 questions, with a smaller number (2.7 million) asked to complete a “full questionnaire” with 75 questions.

The questions asked in the basic questionnaire (with a summary of the options for each response)  included:

Characteristics of the dwelling:

  • What are the floors made of? (earth/cement or concrete/wood, tiles or other)
  • How many rooms are used for sleeping (excluding passages)?
  • How many rooms are there in total, including the kitchen, but excluding passages or bathrooms?
  • Does the dwelling have electricity?
  • What is the water supply? (piped municipal supply/stand pipe/water piped from another dwelling/periodic water trucked in/river, well or lake)
  • Is the dwelling connected to a sewage system or septic tank?
  • Does the toilet have running water/water from buckets/no water?
  • Which of the following do the occupants of the dwelling own? – radio/television/refrigerator/washing machine/vehicle/computer/fixed line telephone/cell phone/internet.

Characteristics of each person in the household:

  • Sex, age, relation to head of household
  • Place of birth (state, if born in Mexico, or country, if born elsewhere)
  • Which medical services if any, do the occupants have access to? (IMSS, ISSSTE, Pemex or Armed Services, private provider, other, none)
  • Religion
  • Limitations in daily life? (walking, moving/vision, even when wearing glasses or contacts/speaking/hearing even when wearing a hearing aid/dressing, bathing, eating/learning simple new tasks/any form of mental difficulty/none)
  • Name of any dialect or indigenous language (ie other than Spanish) spoken

Education:

  • Are you currently enrolled in school, college or university?
  • Level of education already completed
  • Can you read and write a simple message?
  • Where did you reside 5 years ago? (state in Mexico, or country if outside Mexico)
  • Civil status (single/married/separated/divorced/widowed)

Employment

  • Last week, did you work at least one hour/have a job, but not work/look for work
  • Are you retired/student/homemaker/unable to work through physical or mental incapacity

Children

  • How many liveborn children have you had?
  • How many of these children have since died?

The first results from the 2010 census should be available from early next year. As results are published, Geo-Mexico will be updating facts and figures to highlight any important changes in Mexico’s geography.

The sustainable management of Mexico’s natural environment, 2006-2008

 Other  Comments Off on The sustainable management of Mexico’s natural environment, 2006-2008
Nov 062010
 

The IMCO report on the competitiveness of Mexico’s states, which we briefly described in an earlier post, includes a significant section devoted to the sustainable management of Mexico’s natural environment.

IMCO’s sustainable management factor incorporates 14 distinct variables. For almost every variable, the average of all 32 state values for that variable has improved between 2006 and 2008. Only 1 of the 14 variables has worsened, and three have remained unchanged.

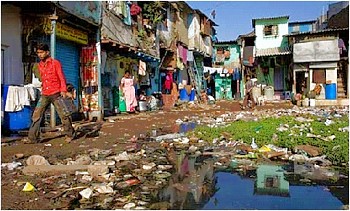
photo of garbage

Sadly, not all garbage finds its way into regulated landfills...

The variable that worsened was the proportion of energy derived from “clean” sources, which fell from 18.9% of the total energy produced in 2006 to 17.6% in 2008.

The three variables that remained unchanged were:

  • the surface experiencing drought or aridity
  • the area where soil degradation is a problem
  • and the number of species considered endangered.

The following 10 variables all showed a significant improvement between 2006 and 2008:

  • the annual rate of reforestation, up from 1.1% to 1.7%
  • the number of “environmental emergencies”, down from 11.3 to 10.9
  • the total area formally protected (biosphere reserves, national parks, etc), which increased slightly
  • the value of agricultural production compared to groundwater consumed for agriculture, which also increased slightly
  • the over-exploitation of aquifers, which fell by more than 10%
  • the volume of sewage (wastewater) that is treated, which rose from 859 liters/sec per million inhabitants to 962 liters/sec
  • carbon dioxide emissions which fell to 0.3 parts/million
  • the percentage of all waste entering regulated landfills, which increased from 58% of all waste to 62%
  • a fall in the total generation hazardous wastes
  • an increase in the number of companies certified as “clean”

In addition, the gap between the top-performing state for this factor (Aguascalientes) and the bottom-performing states (Chiapas and Oaxaca) has closed significantly.

Mexico’s environmental trends and issues are examined in chapter 30 of Geo-Mexico: the geography and dynamics of modern Mexico. Ask your library to buy a copy of this handy reference guide to all aspects of Mexico’s geography today! Better yet, purchase your own copy…

President Zedillo’s political reforms brought real democracy in Mexico

 Other  Comments Off on President Zedillo’s political reforms brought real democracy in Mexico
Oct 272010
 

A previous post focused on the economic reforms of President Ernesto Zedillo, 1994-2000. This article discusses his very important political reforms.

1994 was a very important and difficult year for Mexico. It started with the Zapatista rebellion in Chiapas, which the PRI (Partido Revolucionario Insititucional) government brutally put down, infuriating many Mexicans and leading to giant protest demonstrations against the PRI. Liberation theology was gaining strength and blaming PRI for human rights abuses as well as the impoverishment of the Mexican people. Furthermore, the economy was slipping into a severe crisis.

Following tradition, President Salinas personally selected Donaldo Colosio to succeed him as the PRI President of Mexico. While other parties nominated candidates, PRI had held an iron grip on the Presidency and Mexican politics for over 60 years.

In March 1994 the PRI presidential candidate Colosio was assassinated in Tijuana. The PRI was held responsible for all the country’s problems and Salinas was in a very difficult spot. Old PRI hard-liners (“dinosaurs”) pressed Salinas to name one of them as the next president, but Salinas knew he had to select a “clean” candidate that would help the PRI regain some credibility. Salinas selected as the replacement, Colosio’s young campaign manager and technocrat Ernesto Zedillo. Zedillo, the “accidental president”, easily won the relatively fair 1994 election.

Zedillo was dedicated to political reform. He took dramatic steps to counter corruption. Apparently not trusting anyone within his own PRI party, he appointed as his Attorney General, Antonio Lozano Gracia from the opposition PAN party. Lozano aggressively prosecuted and indicted numerous senior PRI officials, including Salinas’ brother, on a variety of corruption charges. In 1995 Zedillo replaced the country’s entire Supreme Court, which then began to rule against PRI dominated government agencies on a regular basis. Zedillo implemented reforms which separated the ruling PRI party from the Government of Mexico, thus terminating the practice of using government agencies and revenues to support PRI political campaigns.

Zedillo initiated multiparty talks on political reform and began transferring some power away from his own office and toward Mexico’s Congress and 31 states. He made the Federal Elections Commission more transparent by increasing the oversight and participation by opposition parties. He reformed the law giving the President the power to appoint the Mayor of Mexico City, who henceforth would be popularly elected.

These reforms brought dramatic change to local, state, and national elections in July 1997. The opposition PDR party candidate for Mexico City mayor, Cuauhtémoc Cárdenas, garnered nearly 50% of the vote and was elected, defeating the PRI candidate by a wide margin. Opposition party candidates also swept several state governorships. Most significantly, the PRI lost control of the lower house of the Mexican Congress for the first time in history. Finally, after almost 70 years of PRI domination, Mexico was becoming a real democracy and the Mexican public rejoiced in their new democratic powers.

Zedillo decided not to personally select his successor in the traditional way. Instead, the PRI would hold a national primary enabling the voters to select the next PRI presidential candidate. He also loosened the PRI government’s grip on the media, opening the door to more objective political reporting. Under Zedillo’s watch, Mexico enjoyed a clean and fair election in the summer of 2000 which, for the first time in over 70 years, elected a non-PRI candidate as President in the person of Vicente Fox of PAN.

The reforms of the Zedillo Administration largely leap-frogged Mexico from an economically-unstable, single party state, to a relatively modern 21st century multiparty democracy. President Ernesto Zedillo is distinguished from his predecessors by his integrity, vision, and for doing what was best for Mexico, not for himself, his cronies, or his political party. Ernesto Zedillo was and is an inspiration to his country and the world. Everyone living in Mexico owes him a great debt of gratitude for modernizing Mexico’s economy and democracy as well as making Mexico a far better place.

Chapter 12 of Geo-Mexico: the geography and dynamics of modern Mexico discusses the political map of Mexico. Buy your copy today to have a handy reference guide to all major aspects of Mexico’s geography!