The geography of cement production in Mexico

 Other  Comments Off on The geography of cement production in Mexico
Nov 102012
 

In a recent post we saw how Mexico is one of the world’s leading cement manufacturing countries:

The map shows the location of the 34 cement plants currently operating in Mexico. They include 15 belonging to Cemex, 7 to Holcim Apasco, 4 to Cruz Azul, 3 to Cementos Chihuahua, 3 to Cementos Moctezuma and 2 to Lafarge. A new company, Cementos Fortaleza (part-owned by Carlos Slim, the world’s richest man), is due to open in the state of Hidalgo early next year.

Cement plants in Mexico, 2011

Cement plants in Mexico, 2011. Credit: Tony Burton / Geo-Mexico; all rights reserved. Click to enlarge.

According to the Center for Clean Air Policy’s “Sector-based Approaches Case Study: Mexico”,

“The northern region of the country has traditionally been the largest consumer of cement, accounting for 48% of sales mainly for use in infrastructure construction projects, housing and office complexes, and other construction activities. Central Mexico is also a relatively strong market for domestic producers. However, the primary use differs somewhat in that the main source of demand is from construction of new buildings such as hotels and office complexes. The relatively slower pace of economic growth in southern Mexico accounts for the lower share (17%) of domestic cement sales in the south.”

The paucity of cement plants in southern Mexico is particularly well reflected by the map.

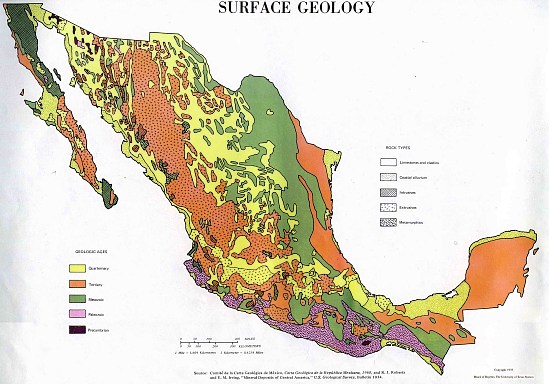
The main raw material for cement is limestone. The distribution of cement plants in Mexico tends to follow the distribution of “limestones and clastic rocks” (rocks made of particles of other rocks) on the map of Mexico’s surface geology.

Mexico's surface geology

Mexico’s surface geology. Click map to enlarge.

Related post:

Cement production in Mexico

 Other  Comments Off on Cement production in Mexico
Nov 032012
 

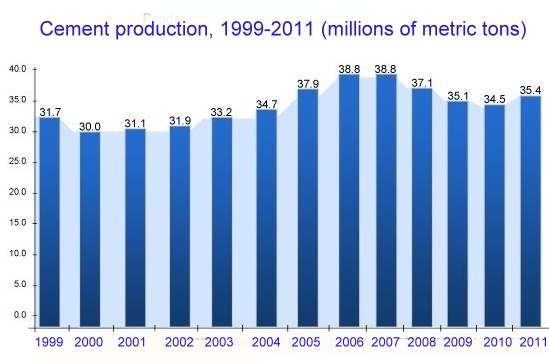
In 2011, Mexico produced 35.4 million tons of cement, 3% more than a year earlier. The first cement-making plant was built in Mexico in 1906, a few years after cement was first officially approved for use in the construction sector. Cement demand grew only slowly prior to a spate of public infrastructure projects in the mid 1940s.

Cement production in Mexico, 1999-2011

Cement production in Mexico, 1999-2011. Source: Camara Nacional de Cemento

There are currently six major cement makers in Mexico. About 20% of production is sold in bulk to large construction companies. The remaining 80% of production is sold in 50-kg bags, used either by formal residential construction firms (50% of the total) or in informal (do-it-yourself) projects (32% of all purchases).

Cemex holds a 49% share of the domestic market, followed by Holcim Apasco (21%), Cruz Azul (16%), Cementos Moctezuma (10%). The remaining 4% is split between Cementos Chihuahua and Lafarge Cementos. A seventh company, Cementos Fortaleza (part-owned by Carlos Slim, the world’s richest man), is due to open early next year.

Cemex, based in Monterrey, is one of Mexico’s most important multinational companies. It is the world’s third largest cement producer and distributor, with operations in fifty countries worldwide. In 2004 Cemex received the Wharton Infosys Business Transformation Award for its creative and efficient use of information technology. Before Cemex, who had ever heard of cement mixers, armed with GPS devices, satellite links and computer systems hooked up via satellite links to the parent company’s HQ, cruising cities? The strategy allowed the company to achieve enviable levels of operating efficiency while meeting demanding delivery deadlines even in congested urban areas such as Mexico City.

China leads the world in terms of the volume of cement production, making around 2,000 million metric tons (mmt) a year, followed by India (710 mmt), Iran (72), USA (68), Turkey (64), Brazil (63) and Russia (52). Mexico (35.4) places 15th on the list, behind Japan, South Korea, Egypt and Thailand, but ahead of Germany, Indonesia, France, Canada, the UK and Spain.

On a per person basis, annual cement consumption in Mexico is about 300 kg/person, well below the levels recorded in the USA (1100 kg) and elsewhere. (The extreme cement consumer in recent years has been Dubai, with the staggering figure of 8000 kg/person!) Cement production may be a good indicator of how much construction is taking place, but is not very good news for the environment and climate change, since high quantities of carbon dioxide are released into the atmosphere during the production process. Globally, cement making is responsible for up to 10% of people’s total carbon dioxide emissions each year.

The carbon dioxide comes from three distinct sources:

  • During the conversion of raw materials into clinker
  • From the combustion of fuels needed in the cement kilns
  • Indirectly, from producing the energy required to power production machinery such as grinders and electric motors.

However, according to the Center for Clean Air Policy’s Sector-based Approaches Case Study: Mexico,

“Mexico’s cement industry is among the most modern and efficient in the world today. All the 50-plus kilns operating in the country’s 34 cement plants are dry-process. Mexico’s cement manufacturers are also using energy efficiency enhancing technologies such as preheaters and precalciners in many of their facilities. Moreover, a number of plants make use of some forms of low carbon alternative fuels.”

“Between 1992 and 2003, emissions of CO2 by the cement industry in Mexico increased roughly 25%. This compares with a nearly 108% increase in cement sector emissions from all developing countries during that same time frame and a 34% increase in U.S. cement industry emissions. The relatively slow growth of emissions from Mexico’s cement sector is an indication of the high overall efficiency of the sector.”

A future post will look at the location of cement plants in Mexico.

The Day of the Dead – a Mexican celebration with regional variations

 Other  Comments Off on The Day of the Dead – a Mexican celebration with regional variations
Oct 292012
 

The indigenous Mexican peoples held many strong beliefs connected with death; for example that the dead needed the same things as the living, hence their bodies should be buried with their personal possessions, sandals and other objects.

With the arrival of the Spanish, the Indians’ pagan ideas and customs were gradually assimilated into the official Catholic calendar. Dead children are remembered on November 1st, All Saints’ Day, while deceased adults are honored on November 2nd, All Souls’ Day. On either day, most of the activity takes place in the local cemetery.

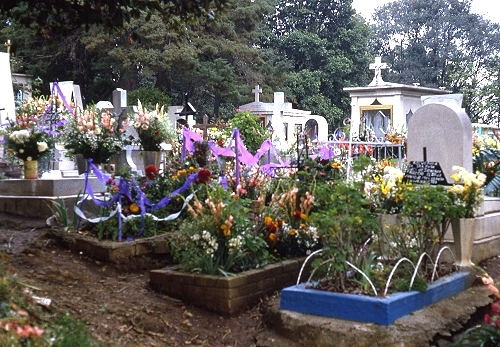
Children's graves on Day of the Dead in Santa Rosa Xochiac, Mexico D.F. Photo: Tony Burton; all rights reserved.

Children’s graves on Day of the Dead in Santa Rosa Xochiac, Mexico D.F. Photo: Tony Burton; all rights reserved.

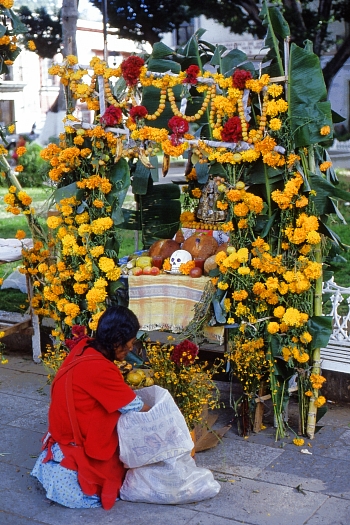
Children’s graves have toys placed upon them and are decorated with colorful streamers and balloons. Adult graves are more elaborately decorated with offerings of the departed’s favorite foods and drinks, candles, flowers, and even personal items. Brightly colored Mexican marigolds, or zempasuchitl as the Indians call them, are the traditional flowers used to guide the spirits home. Unusual art forms which appear only at this time of year include richly decorated pan de muerto (bread of death), skull-shaped sugar-sweets, and papier-mâché skeletons.

Finishing touches being put to a Day of the Dead altar, Oaxaca City. Photo: Tony Burton; all rights reserved.

Finishing touches being put to a Day of the Dead altar, Oaxaca City. Photo: Tony Burton; all rights reserved.

The graves and altars for the Day of the Dead are prepared by the entire family who then stand vigil throughout the night to ensure that their dearly departed recognize close friends or relatives when they come to partake of the feast offered them. The following day, the spirits presumably having had their fill, family, friends and neighbors consume what is left. The village of Janitzio in Lake Pátzcuaro, is perhaps the single most famous place for witnessing Day of the Dead celebrations, but equally interesting observances of the Day of the Dead are held in many small villages elsewhere in Michoacán, off the usual tourist trail. In most of these places, the local Indians are uninfluenced and unaffected by outside contacts.

There are also significant regional variations in the observance of Day of the Dead. The link below is an index to more than forty original MexConnect articles relating to Day of the Dead:

The magic of the traditional decorated altars can also be appreciated by visiting one of the replicas constructed in local museums or cultural centers. You will be looking into the dim and distant pre-Columbian past of Mexico and the Mexican people.

[This is a lightly edited extract from Tony Burton’s Western Mexico: A Traveler’s Treasury (Sombrero Books 2013). Also available as a Kindle e-book.]

Related posts:

The origins of street markets (tianguis) in Oaxaca, Mexico

 Other  Comments Off on The origins of street markets (tianguis) in Oaxaca, Mexico
Oct 152012
 

In an earlier post, we looked at the benefits brought by Mexico’s street markets (tianguis) to both vendors and consumers, and mentioned their long history.

But where, when and why did the first street markets emerge in Mexico?

While there is ample evidence of long-distance trade at least as far back as the Olmec (1500 BC to 200 BC), and we know that there was regular long-distance trade during Aztec times, this trade did not necessarily involve market places and market activity.

Richard Blanton and his co-authors in Ancient Mesoamerica: a comparison of change in three regions offer some insights into how markets may have developed in the Oaxaca region of Mexico.

They point out that relatively little archaeological work has been done on finding the origins of market systems. The major reason for this is because of the paucity of direct archaeological evidence of market activities. Finding “exotic” items (those originating from outside the area) is a clear indication of barter or trade, but does not prove that there was a regular market.There is little or no evidence of the former market stalls and activities for archaeologists to work with.

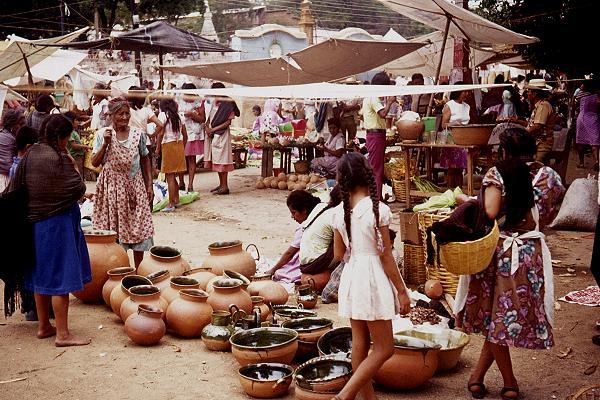
Ceramic items in a Oaxaca street market. Photo: Tony Burton

Ceramic items in a Oaxaca street market. Photo: Tony Burton

However, several million ceramic pieces found in the Oaxaca area have been collected, and systematically cataloged by complexity of form, and hence, difficulty of manufacture and likely “value”. Blanton and his colleagues explore the idea that the distribution of these ceramics can be used to map ceramic production sites and provide a “faint image of the structure of the region’s marketing system”.

In their words, “Presumably, producers would have  distributed themselves in such a way as to maximize their access to potential customers, and to minimize costs. As the clays needed for ceramic making were available virtually everywhere, potters should have therefore tended to locate themselves close to the marketplace or marketplaces where their goods would be sold, to minimize their costs of moving the pottery.” [p 37]

Echoing central place theory, they write that, “A market system and its specialized producers can’t be supported if the producers can’t make a living. They have to be able to supply a sufficiently large number of households that are willing and able to consume a sufficiently large quantity of their goods.” The “demand threshold” is the minimum demand sufficient for a particular product to be worth producing. People will travel further to purchase a higher cost or rarer item (which has a higher demand threshold), which will be produced in only a single or very small number of locations.

According to Blanton and his colleagues, the data for ceramic types in the Valley of Oaxaca confirm that as early as 500 B.C., only one site contained evidence for the most costly (intricate; many steps involved in production) form of ceramics. This site was located in the center of the valley. On the other hand, a larger number of production sites for less costly ceramics were found, scattered around the valley, each site apparently supplying a small local area. While this is not conclusive proof of regular markets, it is certainly strongly suggestive that this is how markets originated in this region.

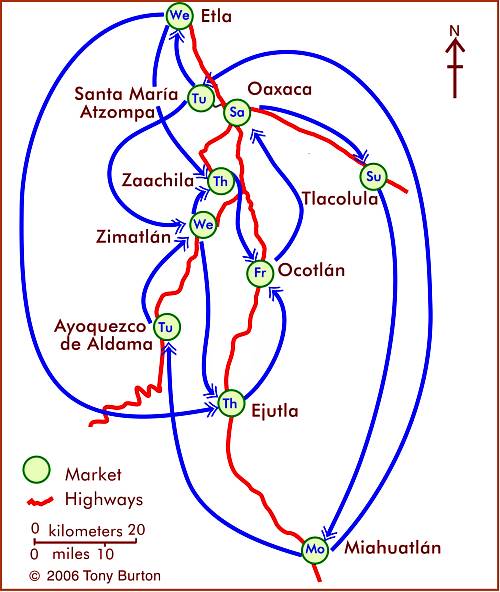
More than two thousand years later, the Oaxaca Valley still has some of the most colorful and vibrant markets in Mexico. The map shows the market day for major markets in the area around the city of Oaxaca. For more details, see Markets in and near the city of Oaxaca.

Source:

Blanton, Richard E., Stephen A. Kowalewski, Gary Feinmann and Jill Appel. Ancient Mesoamerica: a comparison of change in three regions. Cambridge University Press, 1981.

Related posts:

Oct 132012
 

Several of the 62 indigenous languages currently spoken in Mexico are considered “endangered”, spoken by so few people that they will die out in the next few years. The most extreme example is Ayapaneco, a language believed to be spoken today by only two individuals.

Ayapaneco (also known as Ayapa Zoque, Tabasco Zoque and Zoque-Ayapaneco) is one of several Zoque languages and dialects. The only remaining native speakers live in Ayapa, a village 10 kilometers (6 miles) east of Comalcalco, in the state of Tabasco. The native name for the language is Nuumte Oote (True Voice).

The language fell into disuse in the middle of the 20th century. Among the factors involved were the introduction of compulsory schooling in Spanish and the migration of many native speakers to towns and cities where the language was not spoken.

Manuel Segovia (77), one of the last native speakers of Ayapaneco (Credit: Cuartoscuro).

Manuel Segovia (77), one of the last native speakers of Ayapaneco (Credit: Cuartoscuro).

The last two known native speakers of the language are Isidro Velazquez (aged 70) and Manuel Segovia (77). The bad news is that they are apparently reluctant to talk to each other! They also disagree about some of the language’s details. The only one of their relatives attempting to learn the language is Manuel’s son (also named Manuel) who, for the past five years, has studied several hours a day in an attempt to become sufficiently fluent to teach it and keep it alive.

There is some good news. Daniel Suslak, a linguistic anthropologist at Indiana University, is trying to complete the first ever dictionary of the language, and two young Mexican film-makers plan to shoot a documentary entitled “Lengua Muerta” (Dead Language) starring the last two native speakers. The film’s director, Denisse Quintero (28), hopes to create an audiovisual memory that will serve future generations, while at the same time increasing awareness among the present generation of the need to preserve the remaining indigenous languages, together with the cultures that they represent. For more about their project (in Spanish), see the documentary-makers’ plea for funding and this Youtube video.

Some estimates put the number of different Indian languages in the 16th century in what became “New Spain” as high as 170. This number had dwindled to about 100 by 1900, and has continued to decline to the present day. The latest estimates are that at least 62 distinct languages (and 100 dialects) are still spoken somewhere in the country. The precise numbers are often debated by linguists, given that the distinction between a dialect and a language is not universally agreed.

Language is an essential part of culture, and every time a native language is lost, Mexico’s rich cultural tapestry loses a few more strands.

Want to learn more?

Related posts:

The geography of the Maya: does central place theory apply to ancient Maya settlements?

 Other  Comments Off on The geography of the Maya: does central place theory apply to ancient Maya settlements?
Oct 112012
 

An interesting historical example of central place theory is described in Ancient Mesoamerica: a comparison of change in three regions. Central place theory suggests that places of similar size (or occupying a similar level in a region’s urban hierarchy) should form a distinctive spatial pattern. They will be roughly equidistant from one another.The pattern is conceptualized as a series of hexagons, with a settlement at each apex. Such a pattern permits an equidistant spacing in all directions, and has no “gaps” where any territory falls outside (beyond) the “sphere of influence” of one or other of the settlements.

Several archaeologists interested in the Maya have suggested that central place theory offers a way to help explain the pattern of Maya sites in the Yucatán Peninsula and further south into Guatemala. They have postulated that Maya settlements may indeed form a hierarchy in terms of size and importance, with a relatively small number of major regional centers overseeing a larger number of smaller centers. Furthermore, where such a pattern exists, it suggests a high degree of political organization.

This particular example comes from the south-east corner of Campeche, near the Guatemala border.


The major regional center in this case is Calakmul (a World Heritage site since 2002). Calakmul is surrounded by six smaller centers, which are close to equidistant from each other, as well as from Calakmul. In turn, Uxul has several smaller subordinate settlements around it.

Settlement order around Calakmul in Classic Period (Blanton et al, 1981)

Settlement order around Calakmul in Classic Period (from Blanton et al, 1981; figure 4.11)

In this example, the average distance between settlements is about 33 kilometers (20.5 miles), which is approximately one day’s walk and/or canoe trip in this region. So, an individual could leave somewhere like Altamira in the morning and reach Calakmul before nightfall, and vice versa.

Not all Maya archaeologists believe that central place theory is helpful in explaining the distribution of settlements in the region. Some argue that the daily travel distance is the key, and that patterns such as that found around Calakmul are as much due to coincidence as any kind of overriding pattern.

The original theory, as proposed by German geographer Walter Christaller in 1933, was based on various assumptions. In particular, the region was assumed to be an unbounded isotropic (flat) plain, homogeneous in all significant physical aspects (soil, access to water, vegetation, etc), and population was assumed to be evenly distributed. The Yucatán Peninsula is certainly an area of low relief, but access to water and vegetation vary significantly from one area to another, so Christaller’s basic assumptions are not met in the region. On the other hand, there is no denying that a highly structured society might decide (even without having studied  AP Human Geography or A-level Geography) that regularly-spaced settlements are an ideal solution to issues of transportation, administration and control.

For a more academic discussion of the merits of central place theory in Maya research, see Brown and Witschey’s The Geographic Analysis of Ancient Maya Settlement and Polity [pdf file], a paper presented in 2001 at the Electronic Cultural Atlas Initiative, City University, Hong Kong.

Source:

Blanton, Richard E., Stephen A. Kowalewski, Gary Feinmann and Jill Appel. Ancient Mesoamerica: a comparison of change in three regions. Cambridge University Press, 1981.

Related posts:

The geography of Mexico’s street markets (tianguis)

 Other  Comments Off on The geography of Mexico’s street markets (tianguis)
Oct 082012
 

Mexico has some of the finest markets in the world. The variety of produce and other items sold in markets is staggering. But not all Mexican markets are the same. The two major groups are the permanent markets (mercados), usually housed in a purpose-built structure and open for business every day, and the street market or tianguis, usually held once a week.

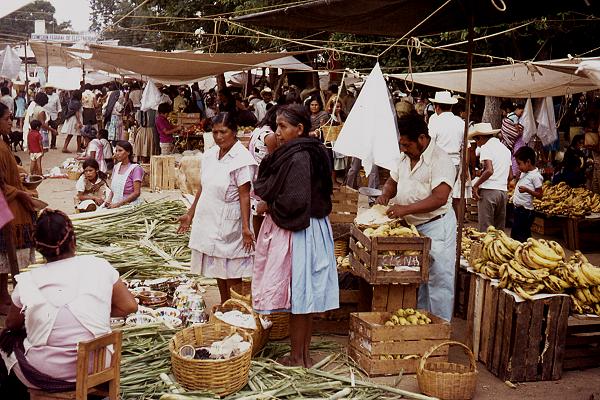
Street market in Oaxaca. Photo: Tony Burton

Street market in Oaxaca. Photo: Tony Burton

Most tianguis temporarily occupy one or more streets or a public square, though some also use privately-owned land. The origins of the tianguis lie in pre-Columbian times, whereas mercados are a much more recent innovation. In this post, we focus on the tianguis.

The geography of a street market or tianguis

The merchants selling goods in a street market generally visit several markets each week, on a regular rotation (see map for an example of a weekly cycle of markets around the city of Oaxaca). In terms of economic geography, weekly markets allow merchants to maximize their “sphere of influence” and exceed the sales “threshold”, the minimum sales required for them to make a profit, even if they are selling items that may not cost very much, and for which individual consumers are not prepared to travel very far. By visiting, say, four markets a week, these merchants effectively quadruple their potential customers. In terms of social and human geography, these weekly markets are a valuable means of communication, and news from one community quickly travels, via the merchants, to another.

At the same time, these markets give consumers access to a much wider range of goods than would otherwise be possible.

The map shows the market day for major markets, and the major weekly marketing cycles, in the area around the city of Oaxaca. With the exception of Oaxaca city (population 480,000) and Miahuatlán (33,000), all the other towns have populations between 13,000 and 20,000. The merchants at such markets generally carry their wares from village to village on the days of their respective markets. Some local farmers also sell their produce at such markets. For more details, see Markets in and near the city of Oaxaca.

The weekly cycle of markets in and around the city of Oaxaca, Mexico. Map: Tony Burton. All rights reserved.

Mexico has a very long history of street markets, certainly dating back more than two thousand years. The Spanish conquistadors saw, first hand, the very large market of Tlatelolco, in what is now Mexico City, which attracted between 40,000 and 45,000 people on “market day”, which was held every five days.

Markets enabled people living in one region to trade goods produced in another region. In the case of food items this allowed residents of the “hot lands” (tierra caliente) to gain access to food items coming from the “temperate lands” (tierra templada). Some ancient settlements in Mexico are located close to the division between either tierra caliente and tierra templada [usual elevation about 750 meters above sea level] or tierra templada and “cold lands” (tierra fria), at an elevation of about 1800 meters a.s.l. These locations clearly favored the trading and exchanging of items from one major climate zone to another.

Food was by no means the only item traded in markets. Many plants with medicinal value were traded, as were others used for construction materials. It was also common to trade textiles, minerals and household items such as baskets, ceramics and grinding stones, as well as salt, prized feathers and animals.

Even today, most Mexican markets have a distinctive spatial pattern of stalls, with vendors of similar items setting up side-by-side, allowing for comparison shopping. It is a relatively easy and revealing fieldwork exercise to map a Mexican market and then analyze the distribution of different kinds of goods.

We looked in a previous post at how the same basic principle applies to the distribution of shops in many towns and cities.

While most markets traded a variety of items, a handful of specialist markets emerged, especially in the Mexico City area. For example, there were specialist markets for salt in Atenantitlan, dogs (as a source of food) in Acolman, and for slaves in Azcapotzalco and Iztocan.

In a future post, we will look at the origins of the tianguis in the Oaxaca region, a region that is still one of the most fascinating areas in Mexico for markets of all kinds.

Further reading:

Related posts:

Oct 062012
 

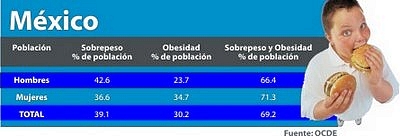
Considerable attention has been focused on Mexico’s obesity problem (see “Soft drinks, obesity, diabetes and public health in Mexico”). Obesity in adults is defined by the World Health Organization (WHO) as a Body Mass Index (BMI) greater than or equal to 30, where BMI is defined as a person’s weight in kilograms divided by the square of his height in meters (kg/m2).

Mexico’s very high adult obesity rate of 30% is increasing every year. It is related to many factors, including increased consumption of processed fat and sugary foods. The average daily calories consumed by Mexican adults increased from 3102 in 1988 to 3266 in 2007.

Rates of "overweight" and "obese" adults in Mexico

Rates of “overweight” and “obese” adults in Mexico

Addressing Mexico’s serious obesity problem will require significant effort and dramatic behavioral change, first and foremost by families, but also by schools, government, industry and civic organizations. Most agree that long term solutions for limiting or reducing obesity should focus primary on children and youth. Obviously physical exercise and diet are crucial parts of a solution. Fortunately Mexico is already making efforts to address its child obesity problem (see “Mexico takes on childhood obesity”).

Obesity is quite complicated and may involve numerous heretofore unknown factors. The data are sometimes confusing. For example, Italian adults, with an obesity rate of only 10%, consumed on average a whooping 3646 calories per day in 2007, 380 more than Mexicans, whose obesity rate is three times that of Italy. (The data in this and the next paragraph come from Table 1 of the Milken Institute’s “Waistlines of the World”, August 2012). French adults consume far more calories than Mexican adults, and more fat the US adults, but their obesity rate is much lower, at only 11%. Furthermore, the French consume 50% more alcohol than Americans and almost three times more than Mexicans and yet they are much thinner. Though adults in Norway consume more calories than Mexicans (3169 versus 3102) their obesity rate is only a third that of Mexico (10% versus 30%). Obviously calorie intake is not the only factor and may not be the most important factor.

Mexican Manuel Uribe, one of the world's most obese individuals, enjoys a snack

Mexican Manuel Uribe (1965-2014), one of the world’s most obese individuals, succeeded in lowering his weight from 560 kg (1233 lbs) to 394 kg (867 lbs).

Obesity is also related to amount of physical activity, but here again the data are confusing. New Zealand adults have a high obesity rate of 27% though they live in one of the physically most active countries, with 49% engaging in “moderate physical activity” defined as light-to moderate activity for at least 30 minutes five times per week. On the other hand, only 27% of the relatively thin Italian adults engage in “moderate physical activity”. Why are obesity rates for the more active New Zealanders so much higher than those for the less active Italians, especially since the latter consume 544 more calories per day (3646 versus 3129)? By way of comparison, only 21% of Mexican and 23% of US adults engage in “moderate physical activity”.

How does Mexico’s growing obesity problem compare that of other countries? Data compiled by the World Health Organization (used by Procon.org to compile “US and Global Obesity Levels: The Fat Chart)”) and the OECD in “Waistlines of the World provide a basis for comparing obesity rates in numerous countries (though see note [1] for reservations about using data from different years).

Country % obese Year of data
Saudi Arabia 35.6 2000
USA 33.8 2008
Egypt 30.3 2006
MEXICO 30.0 2006
Australia 26.4 2007
Canada 24.2 2008
U.K. 23.0 2009
Chile 21.9 2003
South Africa 21.6 1998
Germany 14.7 2009
Colombia 13.7 2007
France 11.2 2008
Brazil 11.1 2003
Italy 10.3 2009
China 5.7 2008
Japan 3.9 2009
South Korea 3.8 2009
Eritrea 3.3 2004
Indonesia 2.4 2001
India 1.9 2008

The data indicate that Mexico ranks 12th of 88 countries with an adult obesity rate of 30%, defined as body mass index (BMI) of over 30. While 12th of 88 does not sound so bad, the top six on the list are small island countries with obesity rates from 41% to 79% (Nauru, American Samoa, Tokelau, Tonga, Kiribati and French Polynesia). Also higher than Mexico are the relatively small countries of Panama and the United Arab Emirates. If these small countries are excluded then Mexico ranks 4th among major countries behind only Saudi Arabia, the USA and Egypt (see table).

Mexico trails several notable countries with high obesity rates between 20% and 30% such as Australia, Canada, UK, Chile and South Africa. (Given that obesity rates are increasing almost everywhere and South Africa’s data are from 1998, its current obesity rate is probably closer to 25% or more.)

The global data suggest that the obesity problem is most serious in Pacific Island nations, North America and the Middle East (including North Africa). It is also becoming a problem in several European and Latin American countries. It is less of a problem in Asia and Sub-Sahara Africa.

In conclusion, obesity is a very serious problem for Mexico today, and arguably one of the biggest problems facing humanity in the 21st century along with climate change and poverty.

Note [1]:

There are some significant differences between the WHO and OECD data sets. For example the WHO data for Mexico are from 2000 while the OECD data are from 2006. For our comparisons we use the most recent data available from the two data sets. Though obesity is an extremely important international problem, reliable data is not collected frequently in many countries. Obesity rates are based on measured height and weight, and are invariably higher than rates based on self reported height and weight. In our table, measured values are used for: the USA, Mexico, Australia, Canada, UK, Japan and South Korea; we are not sure about the rates for other countries.

Update

For an updated post on this topic, with more data, please see: Mexico the 4th most obese country in the world

The Teziutlán disaster of 5 October 1999, a case study of vulnerability

 Other  Comments Off on The Teziutlán disaster of 5 October 1999, a case study of vulnerability
Oct 042012
 

Today marks the 13th anniversary of a major disaster that struck Teziutlán (current population about 65,000), a small city in the Eastern Sierra Madre, in the northeast corner of the state of Puebla, close to the border with Veracruz. The city is noteworthy as the birthplace of two prominent twentieth-century politicians: Manuel Ávila Camacho (served as President, 1940–1946) and Vicente Lombardo Toledano, who founded the Confederación de Trabajadores de México (CTM), Mexico’s largest confederation of labor unions.

The town’s name means “place of the hailstones”. But in 1999, it was not hailstones but torrential rain that triggered the major disaster of 4/5 October, with parts of the city destroyed by a series of landslides and mudflows. More than 80 municipalities were affected to some degree by this tremendous storm. Hundreds of landslides occurred in Hidalgo, Veracruz and Puebla states, causing an estimated US$457 million worth of damage, and at least 260 deaths.

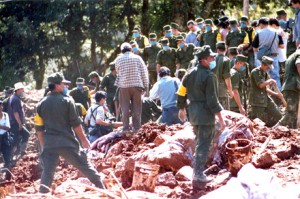
This post focuses only on the consequences for Teziutlán where several hundred homes were completely destroyed and almost a thousand homes suffered partial damage. More than 100 Teziutlán residents lost their life. The local infrastructure, roads, housing, schools and farming were all severely impacted.

The worst damage was in the La Aurrora district on the eastern side of the city, where a landslide on a 23-degree slope buried more than 130 people. In another district, La Gloria, in the western part of the city, several more slips, flows and slides damaged homes, but without any fatalities.

With the benefit of hindsight, this disaster offers a good case study of the factors which made the inhabitants of Teziutlán particularly vulnerable to such an event. The diagram suggests one general classification of the multitude of factors that can affect vulnerability. In the case of Teziutlán, the discussion that follows suggests that the physical factors were probably the most significant.

factors affecting vulnerability

Factors affecting vulnerability (Geo-Mexico, Figure 7.2) All rights reserved.

Physical factors

1. Relief and geology. The area ranges in elevation from 300-2,280 meters above sea level and is drained by the El Calvario, Xóloatl and Xoloco rivers. The city is located at the southern limit of the Eastern Sierra Madre (Sierra Madre Oriental), very close to where it is truncated by the geologically more recent Volcanic Axis. The local geology includes a series of loosely compacted, pumice-rich pyroclastic flows, most of which are thought to be associated with the Los Humeros caldera. These deposits are interlaced with palaeosoils rich in clay which are impermeable and restrict the infiltration of rainwater, and overlie older folded rocks. The combination of steep slopes and impermeable, unconsolidated layers increases the risk of landslides and other forms of mass movement.

2. Climate.  This mountainous region is one of the most humid and foggiest in Mexico, averaging 280 days of mist or fog each year. Teziutlán has an average precipitation of 1600 mm/yr, though totals of over 2000mm are not that uncommon. Most rain falls between July and October.On 4 October 1999, a moist tropical depression off the coast of Veracruz was prevented from moving by a cold front. This led to an increase in humidity followed  by torrential downpours (over 300 mm of rain) over Teziutlán and the surrounding area. The storm continued the next day when a further 360 mm of rain fell.  The rain that fell on just those two days was equivalent to about 40% of Teziutlán’s usual total for an entire year.

3. Earthquake A few days prior to the storm, on 30 September 1999, a 7.4-magnitude earthquake occurred off the coast of Puerto Escondido (Oaxaca). This earthquake did cause  minor cracks in some homes in Teziutlán, and it possibly played a (minor) contributory role in the severity of the storm’s impacts.

Environmental

Deforestation, as a consequence of unplanned urban growth, was also important. Natural and secondary woodlands were steadily being cleared for construction and agriculture. This had an adverse effect on infiltration rates and the capacity of the land to absorb rainwater. However, given the extreme magnitude of the rainfall event, it is unlikely that the area would have escaped unscathed, even if the natural forest had remained.

In the La Aurrora district, where a landslide/mudflow buried more than 130 people, the construction of  a cemetery on a hill above La Aurrora may have played a part, since it appears that a cemetery wall held rainwater back, allowing more of it to seep into the underlying slope, increasing its susceptibility to a serious slide.

La Aurrora, October 1999. Credit: Periódico Sierra Norte

La Aurrora, October 1999. Credit: Periódico Sierra Norte

Educational

The town had suffered severe mass movements during prior storms. For example, in 1955, the rains that accompanied Hurricane Janet provoked numerous mass movements resulting in the disruption of transport systems, including the main highway, but with no loss of life. However, in general, it is clear that these prior events did not increase Teziutlán’s preparedness for a similar event in the future. In particular, prior events did not lead to building regulations being enforced or prevent buildings from being erected in high-risk areas.

Social/Demographic

In the period following the last major event (in 1955), the population of Teziutlán had increased rapidly, leading to the equally rapid expansion of the urban area. This was uncontrolled and included construction on steep slopes with insufficient attention to stability or possible mass movement mitigation measures being taken. It is worth noting that the population has continued to increase rapidly since the disaster, too.

Economic

Home owners in Mexico do not generally carry insurance on their properties, and even when they do, it often specifically excludes major meteorological events. It is unlikely that any of the residents of Teziutlán were able to make insurance claims. Many of the those affected would not have had savings and would have been forced to rely on family, friends and emergency hand-outs to survive. As a 1999 BBC News article emphasizes, government help was slow to arrive.

Want to see more?

There are several Youtube videos with images of the disaster. Perhaps the most interesting is TEZIUTLAN 1999 – 10 años Después del desastre  because it includes some clips from an investigative 1995 TV program aired in 1995 (four years prior to the landslide) that highlighted the extreme risk of constructing unauthorized buildings on the steep slopes of the town along the main highway. This video includes many excellent photos [warning: some graphic images] of the landslide and its aftermath, with a commentary [in Spanish].

Other valuable Youtube resources include Teziutlan Desastre 1999 which has additional photos, plus some eyewitness memories of the event [in Spanish], and TEZIUTLAN historia y tragedia which has many photos of the disaster, accompanied by music only (no commentary) making it a good choice for English-speaking classes.

Sources:

Alcántara-Ayala, I.  Flowing Mountains in Mexico. Mountain Research and Development, Vol 24, No. 1, Feb. 2004: 10-13.

Flores Lorenzo, Pablo & Irasema Alcántara Ayala. Cartografía morfogenética e identificación de procesos de ladera en Teziutlán, Puebla. Boletín del Instituto de Geografía, UNAM. #49, 2002, pp. 7-26. [pdf file]


Oct 012012
 

Mexico currently has 65 Magic Towns (Pueblos Mágicos), some of which we have described in previous posts. Regular readers will know we have some reservations about the program, especially about the inclusion on the list of some places that have relatively little to attract the average tourist.

Are Magic Towns distributed evenly across the country?

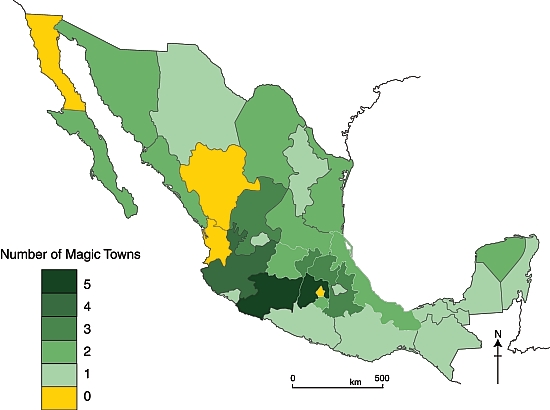
The map shows the distribution of the 57 Magic Towns, by state, as of 1 October 2012. Magic Towns are clearly not evenly distributed across Mexico. Two states – the State of México and Michoacán– each have five Magic Towns, while Jalisco has four. It is no surprise that the Federal District (México D.F.) is not designated a Magic Town, but it is a surprise that there are no Magic Towns in Baja California, Durango or Nayarit. Mexcaltitán, an island town in Nayarit, was one of the first towns in Mexico to be designated a Magic Town, but had this status revoked in 2009.

Mexico's Magic Towns, by state (September 2012)

Mexico’s Magic Towns, by state (September 2012)

Southern Mexican states appear to be drastically underrepresented, especially when area of state, population and indigenous groups are taken into account.

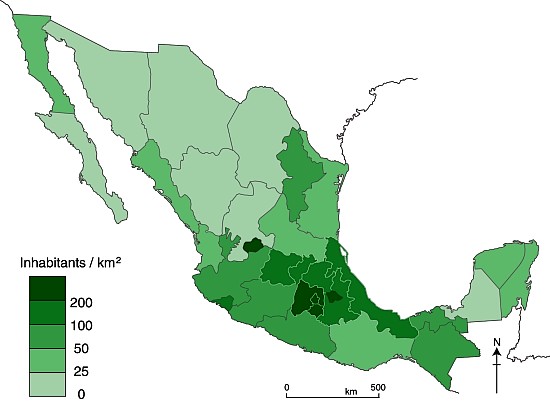
Population density map

Mexico’s population density in 2010

Larger states (in area and/or population) would surely  be more likely to have more Magic Town candidates. However, it is clear from comparing the maps of Magic Towns and population density (above) that the number of Magic Towns does not appear to be related to either the area of states, or to their population density.

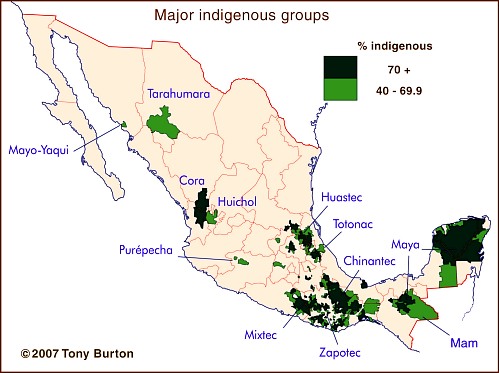
The major indigenous groups in Mexico

The major indigenous groups in Mexico

Indigenous groups are relevant because they tend to live in relatively remote areas of great natural beauty, such as the Copper Canyon region or the Huasteca, and they also exhibit many distinctive cultural traits, giving them a head-start in the race to demonstrate their attractiveness for tourism. Again, though, there is little common ground between the map of indigenous groups and the map of Magic Towns. In particular, the states of Guerrero, Oaxaca and Campeche all seem to have fewer Magic Towns than might be expected.

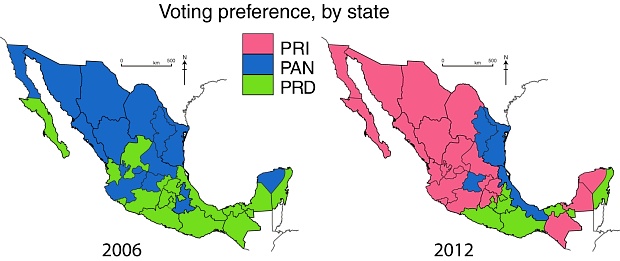
Voting patterns in presidential elections, 2006 and 2012

Voting patterns in presidential elections, 2006 and 2012. All rights reserved.

Even politics does not appear to help explain the distribution of Magic Towns, though it must be pointed out that the pattern of voting for presidential elections (maps) may not match the pattern of municipal voting which would be more relevant to applications for Magic Town status.

If and when more towns are added to the Magic Towns list, perhaps the reasons for their distribution will become more obvious.

This post examined the distribution of Mexico’s Magic Towns, as of 1 October 2012, at which point there were only 57 in total. Since this post was written, additional Magic Towns include:

There is no doubt that Mexico has many other places that would be very worthy additions to the list. Which places would you add?

Related posts:

The geography of tequila: trends and issues

 Other  Comments Off on The geography of tequila: trends and issues
Sep 152012
 

The production and export of tequila has been one of Mexico’s major agro-industrial success stories of recent times. In this post, we look at some of the related trends and issues.

Rapid rise in production

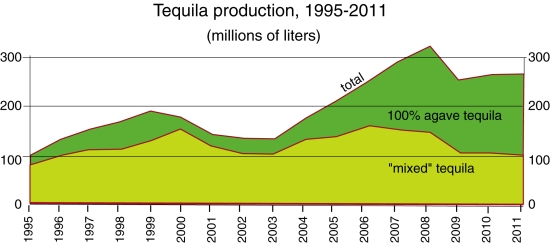
For the period 2009-2011, Mexico produced about 250 million liters of tequila a year. Of this total, 60% was “100% agave tequila“, where all the sugars are directly derived from the Agave tequilana weber azul, and the remaining 40% was “mixed tequila” (tequila mixto) where at least 51% of the sugars are from Agave tequilana weber azul, but the remaining sugars come from other non-agave sources.

Tequila production, 1995-2011. Data: Tequila Regulatory Council.

Tequila production, 1995-2011. Data: Tequila Regulatory Council.

This is a dramatic increase compared to the period 2001-2003, when the average production was about 140 million liters a year. During that period, 100% agave tequila contributed only about 20% of the total. The relative importance of 100% agave tequila has clearly increased very rapidly in the past decade.

Agave supply: from shortage to glut

While there is a clear upward trend in total production, there are periods where production has fallen, most recently from 2008 to 2009, when production fell by 60 million liters. One of the possible reasons for a short-term blip in tequila production is if there is a shortage of agave. Agaves take about 10 years to mature, so there is a lengthy time lag between planting and the first harvest of newly planted areas.

As demand for tequila has risen, some of the major producers have experienced temporary shortfalls and been unable to source as much agave as they would have liked. One of the consequences was that independent agave producers entered the market, seeking to profit from such periods. Such independent producers could do well, provided they were able to predict agave shortages a decade in advance. During the 1990s, hillsides all over Jalisco were planted with agave, many for the first time, providing a significant boost to agave supply a decade later.

Not all independents came out of this on top. The supply of agave now exceeds demand. Many of the major tequila companies have increased their own acreage of agave, or have signed forward-looking contracts with major independent growers in other areas of the designation of origin zone. Many independent agave farmers are losing out; they planted agave a decade ago, but failed to forecast the current glut.

Tequila makers currently consume about 1 million metric tons of agave a year. The Agriculture Secretariat estimates that there are about 20,000 independent growers who have no contracts, and 223 million agave plants of diverse ages for which there is no current or short-term market. As many as 30 million agave plants were considered “very mature” in 2009 and a total loss in 2010. It is likely to be several years before the production of agave falls back to a level sustainable with demand.

Exports continue to rise

Tequila exports have risen very rapidly since 2001, with only minor anomalies along the way. Mexico currently exports about 160 million liters a year. Tequila exports have performed well despite the now lengthy economic woes being experienced by the major importing countries.

Foreign ownership

Mexico’s tequila makers have undergone a similar experience to the country’s major brewing companies, in that all but one of the major tequila firms are now owned by foreign corporations. A proposed deal in which the last of the big Mexican tequila companies, José Cuervo, would also have been taken over by British firm Diageo (which owns Baileys, Johnnie Walker, J&B, Smirnoff, Captain Morgan and Guinness) was called off in December 2012.

Environmental concern

The major environmental problem associated with tequila making is wastewater. For every liter of tequila, 10 liters of wastewater (vinazas) are produced. The vinazas are nitrogen-rich, and contain high concentrations of chemicals, including heavy metals and salt.

The National Chamber of the Tequila Industry recognizes that only about 60% of vinazas are disposed of properly. Most of the remaining 40% (about 2.5 billion liters in 2008) are thought to be pumped untreated into local streams and ponds, damaging the ecosystem and destroying stream life.

The Mexican government fines distilleries that do not have adequate treatment plants for the vinazas they produce, but in the past many companies have opted to pay the fines rather than solve the problem at source.

The vinazas problem was one of the reasons why UNESCO recently considered revoking the Tequila region’s World Heritage status, awarded in 2006. Another issue that made UNESCO unhappy was a recent decision to locate a landfill site in Amatitán in the center of the World Heritage zone. In the end, UNESCO officials agreed that progress was being made; the area kept its heritage status.

There is hope on the horizon. A new cost-effective option for tequila firms seeking to dispose of viñazas has been developed by a local corporation Tecnología Nacional de Aguas. Called Proshiemex, it uses the viñazas to produce methane-rich biogas which can contribute to heating the boilers of the tequila distilleries. The remaining sludge can be easily treated in accordance with all applicable environmental norms.

Source of data:

  • Tequila Regulatory Council Statistics

Related posts:

Threats to the traditional Tarahumara way of life, part two

 Other  Comments Off on Threats to the traditional Tarahumara way of life, part two
Sep 132012
 

In the first part of this two-part article – Threats to the traditional Tarahumara way of life, part one – we looked at the threats to traditional Tarahumara life posed by alcohol, deforestation and the construction of new or improved roads in the Sierra Tarahumara (Copper Canyon) area.

In this part, we consider the impacts of drug cultivation, mining and tourism.

Drug cultivators and drug cartels

The incursion of drug cultivators seeking land for growing marijuana and opium poppies into the Canyon country has further marginalized the Tarahumara, sometimes labelled “Cimarones” (“Wild Ones”) by the newcomers. Drug cultivators have sometimes registered parcels of land as theirs and then ejected the Indians by force. Obviously, they choose the best available land, and their cultivation methods are designed to produce quick results, rather than sustainability.

Alvarado (1996) divides anti-drug policy into various time periods. First came an emphasis on catching those responsible, then came exhaustive efforts to eradicate the crops. Crop eradication has its own serious environmental downside, since it involves the widespread and indiscriminate use of aerially-applied herbicides, alleged to include Agent Orange, Napalm and Paraquat.

Alvarado’s study is an interesting analysis of the incredible, quickly-acquired wealth (and accompanying violence and corruption) that characterizes some settlements on the fringes of the Sierra Tarahumara. In some towns, for example, there are few visible means of economic support but the inhabitants are able to purchase far more late-model pick-ups than can their counterparts in major cities. Murder rates in these towns are up to seven times the Chihuahua state average. Violence even has a distinct, seasonal pattern, with peaks in May-June (planting time) and October-November (harvest time).

The levels of violence and injustice led Edwin Bustillos (winner of the 1996 Goldman Prize for Ecology) to change the focus of CASMAC, the NGO he directed, from environmental conservation to the protection of Tarahumara lives. In 1994, CASMAC was instrumental in stopping a 90-million-dollar World Bank road-building project that would have opened up still more of the Sierra Tarahumara to timber companies.

Mining

Besides deforestation and its resultant impacts, mining has had several other adverse effects on the Tarahumara and the local landscape. Mining activity has increased in the past decade as metal prices have been high and the federal government has encouraged foreign investment in the sector. Mining leads to a reduction in wildlife and to the contamination of water resources. The most damaging pollutants are heavy metals.

Tourism

Even tourism poses a potential threat. In the past decade, investments totaling 75 million dollars have been made to improve infrastructure (highways, runways, drainage systems, water treatment facilities, electricity) in the Copper Canyon region so that the area has the hotels, restaurants and recreational activities to handle six times the current number of visitors. The plan includes three remodeled train stations and a cable car that is already in operation. Sadly, the Tarahumara were not consulted. The plan essentially deprives them of some communal land with nothing being offered in exchange. Clearly, they are in danger of losing control over even more of their natural resources, especially since improved highways will benefit other groups such as drugs growers.

Anthrologist María Fernanda Paz, a researcher in socio-environmental conflicts at UNAM’s Regional Center for Multidisciplinary Studies, argues that these recent conflicts in the Copper Canyon region have stemmed from the federal government’s support for inflows of foreign capital, helped by modifications to the land ownership provisions enshrined in article 27 of the Constitution, changes made in 1992 during the administration of President Carlos Salinas de Gortari. In her view, the developers behind contentious projects first do everything possible to hide the project from public view until it is well advanced. Once people start to object, they then identify the community leaders and do everything possible to get them on their side. Before long, they have succeeded in creating a massive rift in the community, paying some very well indeed for their land, and others next to nothing.

Finally, the good news

The  Tarahumara recently (12 March 2012) won one of the greatest victories to date for indigenous peoples in Mexico. The Tarahumara (rarámuri) community of Huetosachi in the state of Chihuahua has now been recognized by Mexico’s Supreme Court as having long-standing indigenous territorial rights (but not formal ownership) that must be respected by the Copper Canyon Development Fund (Fideicomiso Barrancas del Cobre). This is truly a landmark victory. The Tarahumara have been guaranteed the right to be consulted over all Development Plans, and to select the benefits they will receive in exchange for any loss of ancestral territory. Finally, this juggernaut of a tourist development plan must respect the territories and natural resources of the Tarahumara.

This was truly David against Goliath. Huetosachi is a tiny settlement of only 16 families, about 10 km from where the main tourist complex is being built near the Divisadero railway station. The village has no water, electricity or health services.

The Copper Canyon Development Fund is now obligated to create a Regional Consultative Council allowing the villagers of Huetosachi and other settlements a say in the negotiations to decide what level of development is acceptable, and what the villagers expect in return. This council is expected to include representatives of 27 indigenous communities in the immediate area between Creel and Divisadero.

This landmark court decision could well be the first of many as indigenous groups elsewhere in Mexico fight their own battles against developers of various kinds. There could still be more court cases concerning the Copper Canyon region since it is widely expected that this initial success will lead to a legal challenge against the siting of the cable car. The villagers are also reported to be discussing how best to deal with water contamination allegedly resulting from existing hotels, and the possibility of a golf course being built on the canyon rim.

Sources:

  1. Alvarado, C.M. (1996) La Tarahumara: una tierra herida. Gobierno del Estado de Chihuahua. Somewhat repetitive academic analysis of the violence of the drug-producing zones in the state of Chihuahua, based in part on interviews with convicted felons.
  2. Merrill, W.L. (1988) Raramuri Souls – Knowledge and Social Progress in North Mexico. Smithsonian Institution, Washington D.C.
  3. Nauman, T. (1997) “Tala ilegal para la siembra de mariguana y opio en Chihuahua” p. 50 in El Financiero, May 12, 1997. Describes the Arareko project.
  4. Plancarte, F. (1954) El problema indígena tarahumara. INI. Mexico. Spanish language description published by National Indigenous Institute.
  5. Shoumatoff, A. (1995) “The Hero of the Sierra Madre” pp 90 – 99 of Utne Reader (July-August, 1995), reprinted from Outside (March 1995). An account of the determined efforts by Edwin Bustillos to prevent further environmental destruction in the Copper Canyon region.

Related posts:

Threats to the traditional Tarahumara way of life, part one

 Other  Comments Off on Threats to the traditional Tarahumara way of life, part one
Sep 102012
 

The extreme isolation of the Tarahumara (until recent years) and their adaptation of some elements of the alien Spanish/Mexican culture have enabled them to survive in what most observers would regard as an extraordinarily hostile natural environment. The effects of this isolation are reflected in their culture, in their relatively equal gender roles in terms of their economy, their flexibility of work schedule, lack of economic specialization and their willingness to share available food when necessary to ensure survival.

Their isolation has also hindered the emergence of any well‑defined leadership system. A lack of any “official” hierarchy make it much more difficult to resolve any serious disputes. It has also meant that the shy and politically naive Tarahumara have found it difficult to counteract intruders, whether they are government officials or drug‑dealers. As more roads are improved, even the furthest, most remote sanctuaries, of the Tarahumara come under threat.

Some Tarahumara have adopted more mestizo culture than others; the “gentile/baptized” distinction, first recognized by Lumholtz, with all its associated differences in settlement patters and lifestyle arose from the resistance of many Tarahumara to the imposition of a Spanish/mestizo culture that they considered “alien”. The more traditional Tarahumara still prefer to live in relative isolation and not to resettle into fixed villages where there would be insurmountable pressure on their culture.  The mestizos in the Copper Canyon region, who occupied the best land by force and formed villages in the European‑derived tradition, have far more links with modern Mexico, and have preserved their economic dominance over the Indians.

None of this means that the traditional Tarahumara way of life has remained unchanged or will not continue to undergo modifications in the future. Any changes to the environment can have serious adverse impacts on their abilities to find sufficient food. The main drivers of environmental change have been drug-growing, forestry, mining and tourism.

In addition, they have to manage changes which, to some extent, have been thrust upon them by some of the government and other efforts aimed at helping them. For example, modern medicine and education threaten to change the Tarahumara population balance. Today, more infants survive to adulthood and fewer adults die as a result of accidents. The problem for the Tarahumara is how to feed and support an ever‑growing population using existing methods of cultivation and herding.

Alcohol

Equally important is the transformation of the traditional Tarahumara system of wants by contact with mestizos. Prior to these contacts, the Tarahumara had little or no access to commercially-made alcohol. Tarahumara tesgüino took considerable time and effort to make and had to be consumed rapidly, meaning that Tarahumara could get drunk occasionally, but could not remain drunk for long. The ready availability of commercial alcohol has completely changed this dynamic.

Slightly over a decade ago, an innovative, women-led project reportedly changed the 3500-inhabitant community of Arareco (8 km from the town of Creel) for the better. Kari Igomari Niwara, a 200-member women’s organization, began in 1992, and is celebrating its 20th anniversary this year. It has often been quoted as an outstanding example of what the Raramuri (Tarahumara) can do if left to their own devices and allowed to control their own resources. In this project, they have sought encouragement and support, rather than direction and dependence. By 1997, Kari Igomari Niwara had organized a health center, primary school, bilingual literacy program, drinking water system, bakery, three small food supply stores, a handicrafts business, a restaurant and collective transportation for the village.

One of the first collective efforts of the Kari Igomari Niwara group was to get the cantinas (bars) of Creel closed at 4pm in the afternoon, so that their husbands wouldn’t get so drunk. Almost 70% of Arareco women reported having been beaten by their husbands, the vast majority of attacks coming when their husbands were drunk. After the initial cantina victory, the men became even more repressive, but the women persisted and four years later managed to persuade the church to build them a small health center despite the objections of their local male-dominated council. The women have already reduced nutrition-related infant mortality to 25% of its former level and have brought birth rates down by 50%  (Nauman, 1997).

Deforestation

The deforestation of the Copper Canyon region has a long history and has significantly changed the resource base of the Tarahumara to the point where their traditional way of life in the canyons is probably impossible to sustain in the future. Deforestation was started by mining companies who cut trees to make pit props and burn as fuel. In the 1890s, the region started to supply timber to the USA, via concessions given by Chihuahua state governor Enrique Creel to companies such as the Sierra Madre Land and Lumber Company, owned by William Randolph Hearst. Today, many of the local ejidos continue to cut more timber than they can ever replant, and there are more sawmills in operation than could ever be sustainable.

In many places, there are clear signs of the immense environmental destruction wrought by timber cutting, often on slopes so steep that there is little chance of reforesting them in the future. Soil erosion is rampant in some areas and satellite imagery reveals huge areas that are no longer forested.

Recent droughts have not helped, and one NGO, Alternative Training and Community Development (ALCADECO) has explored their links with deforestation and migration. The NGO’s director, Laura Frade, argues that the long-term effects of drought go far beyond the obvious. Poor crops in times of drought results in the abandonment of traditional lands. Families become dependent on poorly-paid jobs in the timber industry, or on drug plantations, or dependent on the sale of handicrafts to tourists. Many of those that fail to make ends meet then become the unwilling recipients of blankets and food from charity organizations. Others move to cities like Chihuahua, where they try to survive by begging or turn to alcohol.

New and improved roads

The development of forestry required the development of roads and vehicle tracks. Road development continues to this day and is not necessarily a beneficial thing. Improved road access has opened up new areas for lumbering, mining and tourism. In turn, small stores spring up, even in remote areas, selling mestizo items such as radios, carbonated drinks, cigarettes, and manufactured clothing. The use of money has become more widespread. Better roads have enabled traders to build a credit relationship with Tarahumara Indians, offering them non-traditional goods in exchange for a share of the next maize harvest. This has led to typical problems of indebtedness and exploitation.

Further reading:

Sources:

  1. Lartigue, F. (1970) Indios y bosques. Políticas forestales y comunales en la Sierra Tarahumara. Edicions de la Casa Chata # 19, Mexico.
  2. Lumholtz, C. (1902) Unknown Mexico. 2 volumes. Scribner’s Sons, New York. Republished in both English and Spanish. Fascinating ethnographic account from the last century.
  3. Nauman, T. (1997) “Tala ilegal para la siembra de mariguana y opio en Chihuahua” p. 50 in El Financiero, May 12, 1997. Describes the Arareko project.
  4. Vatant, Francoise. La explotación forestal y la producción doméstica tarahumara. Un estudio de caso: Cusárare, 1975-1976. INAH, Mexico.

Related posts:

Sep 012012
 

Tequila is made by distilling the juice of certain species of agave plants. Agaves are commonly called “century plants” in the USA, a name derived from the length of time they supposedly grow before producing a flowering stalk – actually, from eight to twenty years depending on the species, rather than the hundred suggested by their common name! Some species flower only once and die shortly afterwards, others can flower almost every year. Agaves are no relation botanically to cacti, even though they are often mistakenly associated with them. The ideal agave for tequila is the Agave tequilana Weber azul which has bluish-colored leaves.

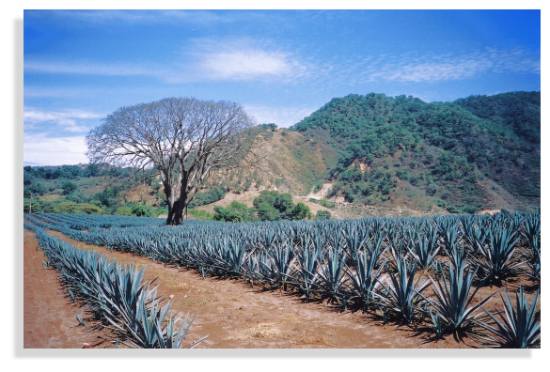
Agave field in Jalisco

Agave field in Jalisco. Photo: Tony Burton

The tequila agaves are started from seed or from onion-size cuttings. When the plants are mature (about 10 years later), their branches are cut off, using a long-handled knife called a coa, leaving the cabeza (or “pineapple”), which is the part used for juice extraction. Cabezas (which weigh from 10 to 120 kilos) are cut in half, and then baked in stone furnaces or stainless steel autoclaves for one to three days to convert their starches into sugars.

From the ovens, the now golden-brown cabezas are shredded and placed in mills which extract the juices or mosto. The mixture is allowed to ferment for several days, then two distillations are performed to extract the almost colorless white or silver tequila. The spirit’s taste depends principally on the length of fermentation. Amber (reposado) tequila results from storage in ex-brandy or wine casks made of white oak for at least two months, while golden, aged (añejo) tequila is stored in casks for at least a year, and extra-aged (extra añejo) for at least three years.

Distillation: the Filipino Connection

Mexico’s indigenous Indians knew how to produce several different drinks from agave plants, but their techniques did not include distillation, and hence, strictly speaking, they did not produce tequila. Fermented agave juice or pulque may be the oldest alcoholic drink on the continent; it is referred to in an archival Olmec text which claims that it serves as a “delight for the gods and priests”. Pulque was fermented, but not distilled.

If the indigenous peoples didn’t have distilled agave drinks, then how, when and where did distillation of agave first occur? In 1897, Carl Lumholtz, the famous Norwegian ethnologist, who spent several years living with remote Indian tribes in Mexico, found that the Huichol Indians in eastern Nayarit distilled agave juice using simple stills, but with pots which seemed to be quite unlike anything Spanish or pre-Columbian in origin.

By 1944, Henry Bruman, a University of California geographer, had documented how Filipino seamen on the Manila Galleon had brought similar stills to western Mexico, for making coconut brandy, during the late sixteenth century.

Dr. Nyle Walton, of the University of Florida, expanded on Bruman’s work, showing how the Spanish authorities had sought to suppress Mexican liquor production because it threatened to compete with Spanish brandy. This suppression led to the establishment of illicit distilling in many remote areas including parts of Colima and Jalisco. Even today, the word “tuba”, which means “coconut wine” in the Filipino Tagalog language, is used in Jalisco for mezcal wine before it is distilled for tequila. This is probably because the first stills used for mezcal distillation were Filipino in origin.

“Appelacion Controlée”

Though colonial authorities tried to suppress illegal liquors, the industry of illicit distilling clearly thrived. One eighteenth century source lists more than 81 different mixtures, including some truly fearsome-sounding concoctions such as “cock’s eye”, “rabbit’s blood”, “bone-breaker” and “excommunication”! By the 1670s, the authorities saw the wisdom of taxing, rather than prohibiting, liquor production.

For centuries, distilled agave juice was known as mezcal or vino de mezcal “mezcal wine”). It is believed that the first foreigner to sample it was a Spanish medic, Gerónimo Hernández, in the year 1651. The original method for producing mezcal used clay ovens and pots.

By the end of the nineteenth century, as the railroads expanded, the reputation of Tequila spread further afield; this is when the vino de mezcal produced in Tequila became so popular that people began calling it simply “tequila”. When the Mexican Revolution began in 1910, it swept away a preference for everything European and brought nationally-made tequila to the fore. Tequila quickly became Mexico’s national drink. It gained prominence north of the border during the second world war, when the USA could no longer enjoy a guaranteed supply of European liquors.

To qualify as genuine tequila, the drink has to be made in the state of Jalisco or in certain specific areas of the states of Nayarit, Guanajuato, Michoacán and Tamaulipas. (We will take a closer look at this distribution in a future post).

The ideal growing conditions are found in semiarid areas where temperatures average about 20 degrees Centigrade, with little variation, and where rainfall averages 1000 mm/yr. In Jalisco, this means that areas at an elevation of about 1,500 meters above sea level are favored. Agaves prefer well-drained soils such as the permeable loams derived from the iron-rich volcanic rocks in Mexico’s Volcanic Axis.

Production of tequila has tripled within the last 15 years to about 250 million liters a year (2010). About 65% of this quantity is exported. Almost 80% of exports are to the USA, with most of the remainder destined for Canada and Europe.

Connoisseurs argue long and loud as to which is the better product, but all agree that the best of the best is made from 100% Agave tequilana Weber azul. I’m no connoisseur, but my personal favorite is Tequila Herradura, manufactured in Amatitán, a town between Tequila and Guadalajara. Anyone interested in the history of tequila will enjoy a visit to Herradura’s old hacienda “San José del Refugio” in Amatitán, where tequila has been made for well over a century. The factory is a working museum with mule-operated mills, and primitive distillation ovens, fueled by the bagasse of the maguey. The Great House is classic in style, with a wide entrance stairway and a first floor balustrade the full width of the building.

Visitors to the town of Tequila, with its National Tequila Museum, can  enter any one of several tequila factories to watch the processing and taste a sample. They can also admire one of the few public monuments to liquor anywhere in the world – a fountain which has water emerging from a stone bottle supported in an agave plant. “Tequila tourism” is growing in popularity. Special trains, such as “The Tequila Express” run on weekends from the nearby city of Guadalajara to Amatitán, and regular bus tours visit the growing areas and tequila distilleries. The town of Tequila holds an annual Tequila Fair during the first half of December to celebrate its famous beverage. Another good time to visit is on 24 July, National Tequila Day in the USA.

In 2006, UNESCO awarded World Heritage status to the agave landscape and old tequila-making facilities in Amatitán, Arenal and Tequila (Jalisco).

Related posts:

Tarahumara agriculture in the Copper Canyon region

 Other  Comments Off on Tarahumara agriculture in the Copper Canyon region
Aug 202012
 

At the time of the Spanish conquest, the Tarahumara were hunter‑gatherer‑cultivators, collecting what they could from local trees and plants, and using a version of shifting agriculture to produce crops of corn (maize), beans and squash. Their methods of farming were probably well‑ adjusted to the then-prevailing environmental conditions in the Copper Canyon region and caused little soil degradation.

With the arrival of the Spanish, the Tarahumara were forced to occupy progressively more marginal land where their traditional methods were unable to supply enough food for their numbers. However, the Spanish introduced them to new crops, new animals (goats, cows, sheep) and new techniques, principally the plow. Adopting these innovations enabled them to survive despite being deprived of their best land.

A reduction in the arable area available prevented them from continuing to grow crops by shifting cultivation. On the other hand, their newly acquired animals afforded them the possibility of adding manure to their farming plots on a regular basis, keeping them under cultivation more continuously than was previously possible.

For manuring purposes, herds of 15‑50 goats are penned into square enclosures (6 m x 6 m in size) each night for four nights. The pen is then moved. The method is slow but effective. Plots of land fertilized by this method give good yields for between 4 and 6 years. Cattle (5‑15 at a time) are also used to supply fertilizer but have to be kept on the same area for 15 nights, for an effect which lasts about three years.

In wintertime, stock is usually confined to caves or covered enclosures. The manure deposited is collected and transported in sacks to the farming plots in spring. A simple rotation system is used with about 25% of available land left uncultivated in any one year. Animals may be loaned out to other families for the purposes of land fertilization, or pooled together to ensure effective results.

The Tarahumara tilled their plots using a simple digging‑stick, which could be used with minimal risk on tiny plots of land, even on steep slopes. Following the adoption of the plow, it was much easier to cultivate larger fields on lower angle slopes, rather than smaller, steeper plots, principally because the plow disturbed the soil far more “efficiently” and to greater depth than the digging‑stick. On the other hand, the vegetation of the steep hillsides was subsequently left undisturbed.

Given the terrain, pasture is hard to find. Near the smaller settlements (ranchos), natural pasture exists only for a very short time during the rainy season. At other times the herds have to be taken ever greater distances in search of richer pickings. This has traditionally been done by the children, leaving the adults free for other tasks. Trips to find suitable pasture may last two or three days at a time.

Despite the difficulties of providing livestock with sufficient food, the animals provide a hedge against starvation, and are a measure of Tarahumara wealth. The balance between crops and livestock is critical to the Indians’ well‑being. This was not the case before the mestizos moved in and pushed the Tarahumara onto more marginal land, but it is today.

The yearly farming cycle

The Tarahumara agricultural calendar lasts about seven months, beginning with planting, at the end of April or in early May, and ending with harvesting, during late October, early November.

The planting date is determined by the phase of the moon, rumors of rain, offers of help, and by personal tradition. For a good maize crop, the plants should be about 30 cm high when the first heavy rains fall. The timing and duration of the rainy season is crucial to the success of the crop. Climatic uncertainty is compounded by the effects of pests and diseases. Many plants are damaged by a kind of worm but the Tarahumara believe they should be left alone since otherwise the entire crop will be lost. Immediately before the rains, many families are down to their last reserves of food, and many animals have to be slaughtered both for survival and to placate the Gods.

The young plants need a lot of vigilance to prevent animals from destroying them. This responsibility is shared among family members since the individual plots of land belonging to one family are so widely scattered. The adults will occupy themselves with mending and craft‑making while keeping an eye on the crops.

Towards the end of July, the young corn is weeded in a communal work effort, amidst general merriment, a sign of relief that next year’s food supply is well on its way. Beans are planted in early August. Harvesting takes place in late October, early November. When about half of the maize has been harvested, corn beer (tesgüino) is prepared, the rest of the harvest becoming a communal or cooperative effort.

Some Tarahumara practice transhumance, moving down to the canyon floors in winter for better shelter and access to pasture. However, many Tarahumara, especially the more Mexicanized, stay in one place all year, lighting fires and wearing warmer clothes as their protection against the cold. The winter time is when men make musical instruments (guitars, violins and mouth harps), and the family collects firewood, tends the goats and make baskets and other items, some of which will be sold to tourists.

See also:

Sources /  Bibliography:

  1. Bennett, W. and Zingg, R. (1935) The Tarahumara. Univ. of Chicago Press. Reprinted by Rio Grande Press, 1976.
  2. Kennedy, J.G. (1978) Tarahumara of the Sierra Madre; Beer, Ecology and Social Organization, AHM Publishing Corp, Arlington Heights, Illinois. Republished, as The Tarahumara of the Sierra Madre: Survivors on the Canyon’s Edge in 1996.
  3. Pennington, C. (1963) The Tarahumar of Mexico, their environment and material culture. Univ. of Utah Press. Reprint by Editorial Agata, Guadalajara, 1996.

Related posts:

Aug 162012
 

Six months ago, we gave an optimistic mention of Maya Biosana, a cacao megaproject in Quintana Roo, noting that it had received the support of the federal Agriculture Secretariat (Sagarpa):

We also noted that the project was not without its critics. In this post, we look at some of the claims, counterclaims and available evidence.

What is Maya Biosana?

The Maya Biosana project aims to make Mexico the leading producer of organic cacao in the Americas. In the early phases, Maya Biosana claims it will plant one million cacao trees to create 500 hectares (1200 acres) of irrigated orchards in 12 communities near Chetumal in Quintana Roo, with similar numbers of new trees to be planted annually for another three years. The trees are expected to yield 2.4 metric tons of cacao per hectare, produce 4800 metric tons of cacao a year (destined for high quality chocolates) by 2017 and provide up to 2,000 additional jobs.

A fuller description of the intended project (pdf file, in Spanish) is available on the Sagarpa website.

Pipedream or reality?

Industry insiders, such as Denver-based chocolate maker Steve DeVries, who leads specialist tours to the cacao growing regions of Mexico, Costa Rica and Ecuador, have drawn our attention to the fact that such numbers will be virtually impossible to achieve. In their view, producing and planting one million cacao plants will take far longer than a year, even in ideal circumstances. They also point out that a million trees on 500 hectares would be an average planting density of 2000 plants/hectare. According to the Food and Agriculture Organization (FAO), about half that figure, 1025 plants/hectare, would be a more normal spacing.

The Maya Biosana project apparently intends to plant only cacao Criollo. Of the three main varieties of cacao (see further reading for more details) – Forastero, Criollo and Trinitario –  Criollo produces the most flavorful chocolate, but is little used at present in the mainstream chocolate industry because it is very susceptible to disease, and takes longer to reach maturity. The most widely grown variety is Forastero, which is hardy but least flavorful, while Trinitario, a hybrid of the first two, falls somewhere in the middle.

This makes Criollo a very strange choice for such a major plantation. In fact, industry insiders say, there is no source anywhere in Mexico for the huge quantity of Criollo grafts that the Maya Biosana project would require.

Maya Biosana claims that the first phase of its megaproject is already underway on land in the Los Divorciados ejido, about 100 km from Chetumal, and recently released a promotional video. The film includes lots of “feel good” footage and memorable quotes, but some of the footage of mature cacao appears to have been shot elsewhere, presumably in Tabasco state. More importantly, what exactly does the Maya Biosana team bring to the table, besides good intentions?

Who are the main players in Maya Biosana?

The two main players in Maya BioSana, according to press reports, are Jim Walsh and Fernando Manzanilla.

Entrepreneur Jim Walsh is the self-styled “reinventor of chocolate”, CEO of Hawaiian Vintage Chocolate from 1992, and CEO of the closely-related Intentional Chocolate since 2007. Fernando Manzanilla Prieto is a well-connected Mexican politician, member of Partido Acción Nacional (PAN), and businessman who is currently the Secretary General of the government of the state of Puebla in central Mexico.

According to its website, samples of Intentional Chocolate, co-founded by Walsh and Manzanilla, were given by former president Bill Clinton as a gift to the Japanese Royal family and have the seal of approval of the Dalai Lama. The company “treats” regular chocolate using “breakthrough licensed technology” that “helps embed the focused good intentions of experienced meditators and then infuses those intentions into chocolate”. An early press release stated that such chocolate can “significantly decrease stress, increase calmness, and lessen fatigue in those who consume it”.

The major claim made for this chocolate is that it elevates the mood of consumers more than non-intentioned chocolate does. This claim is based, apparently in its entirety, on a single “double-blind, randomized, placebo-controlled experiment”, the results of which were published in an article, co-authored by Walsh, entitled Effects of Intentionally Enhanced Chocolate on Mood in EXPLORE: The Journal of Science & Healing, an Elsevier journal, in the September/October issue of 2007 (Vol 3, No 5: 485-492).

The sample size was small, 62 individuals in total. For one week, participants self-recorded their mood by means of a recognized “profile of mood states”. Some participants consumed “intentioned” chocolate, and others “non-intentioned” chocolate, twice a day, at the same times, for three consecutive days, in the middle of the week.

The most fascinating part of the article is actually the last paragraph, where the authors recommend that efforts to replicate the findings should “seriously consider sources of intentional enhancement and contamination that might influence the postulated effect.” They call for intentional imprints to be provided only by “highly experienced meditators or other practitioners”, writing that “persons holding explicitly negative expectations should not be allowed to participate for the same reason that dirty test tubes are not allowed in biology experiments.” Even more bizarrely, they claim that vigilance about the intentions of people involved in the test may even extend to “people who learn about the experiment in the future after the study is completed”.

Put another way, skeptics and disbelievers should stay home.

To the best of our knowledge, the Explore study has not been replicated, while statisticians and others have criticized the methods used and the conclusions drawn. See, for example, Debunked: Effects of Intentionally Enhanced Chocolate on Mood.

The other two authors of the Explore study besides Walsh are Dean Radin and Gail Hayssen. Radin is a prolific author of articles about parapsychology and also just happens to be a co-editor of Explore. Both Radin and Hayssen hold posts at the Institute of Noetic Sciences in Petaluma, California.

Walsh and Radin, together with Manzanilla, all have connections to the Human Energy Systems Alliance (HESA) Institute,  “an alliance of scientists, philosophers, entrepreneurs, and spiritual leaders devoted to unlocking the potential of the human energy system and to developing technologies and products that transform human health and increase human flourishing.”

According to the HESA Institute’s list of its main members (webpage no longer active) , Walsh is the institute’s founder and CEO, and Radin is a prominent member. Manzanilla’s bio claims that he was, too, founded HESA but, curiously, his name is absent from the HESA Institute list.

Between them, Walsh and Manzanilla have created an impressive web of interlinked and overlapping projects, supported by an equally dazzling range of positions on advisory boards. For example, both men are members of the three-person advisory board of the Institute for Spirituality and Wellness (ISW) at the Chicago Theological Seminary (CTS), which continues “to educate and prepare future leaders for a multitude of ministries” (Ref). The CTS is an affiliated seminary of the United Church of Christ, “a mainline Protestant Christian denomination primarily in the Reformed tradition but also historically influenced by Lutheranism” (Ref).

Several of the projects associated with Manzanilla, according to his CTS bio, have surprisingly little or no web presence. For example, he founded (in 2007 according to his Linkedin profile) and remains CEO of ImaginaMéxico, which “directs a network of organizations whose brands encompass the areas of food and beverages, agro forestry and wellness, human capital and technology, all under the common theme of helping individuals lead more meaningful and vital lives.” Yet, as of last week, the ImaginaMéxico website was “under construction”. According to the bio, Manzanilla also founded Cielo y Tierra (no web links found), Facthum-Mexico (no website found) and Kakaw Universal (no evidence from a Google search that it even exists)…. Manzanilla also co-founded Baja BioSana,  “an intentional community with a vision to become an example of sustainable living and educational center” (Ref) located in the small village of El Choro in Baja Califórnia Sur.

Financial shenanigans

It now looks as if the Maya Biosana project may be dead in the water, before it ever really gets off the ground. According to this document from the Superior Audit Office of Mexico (Auditoría Superior de la Federación), Maya BioSana received two payments in 2010 from Financiera Rural, acting on behalf of Sagarpa, as part of the latter’s  Strategic Project for Sustainable Rural Development in the South-South-East Region of Mexico (Proyecto Estratégico para el Desarrollo Rural Sustentable de la Región Sur Sureste de México). The two payments totaled 15 million pesos (about $1,140,000 dollars).  The document states that Sagarpa is already requesting the return of these funds because the Maya Biosana project has fallen behind schedule.

The Superior Audit Office document says that visits to the site did not find any cacao plantation and alleges that the Sagarpa funds had been transferred from one company account to another before a payment for 12,400 million pesos (about $946,000 dollars) was made to a foreign bank account belonging to one of the individuals who had signed on behalf of the company “Maya Biosana S.A.P.I de C.V.” Perhaps this was the cost of the recently-released video?

For the sake of the ejidatorios of Los Divorciados in Quintana Roo, who were counting on the success of the Maya BioSana cacao-growing megaproject, we hope that they have gained, and will gain, more from this experience than they lost. They deserve far better than a mere handful of chocolate-coated intentions.

This is one chocolate megaproject that appears to be melting fast. Maya BioSana looks much more like Maya Bio-Insana.

Further reading:

  • Cacao domestication I: the origin of the cacao cultivated by the Mayas
  • Cacao domestication II: progenitor germplasm of the Trinitario cacao cultivar

Related posts:
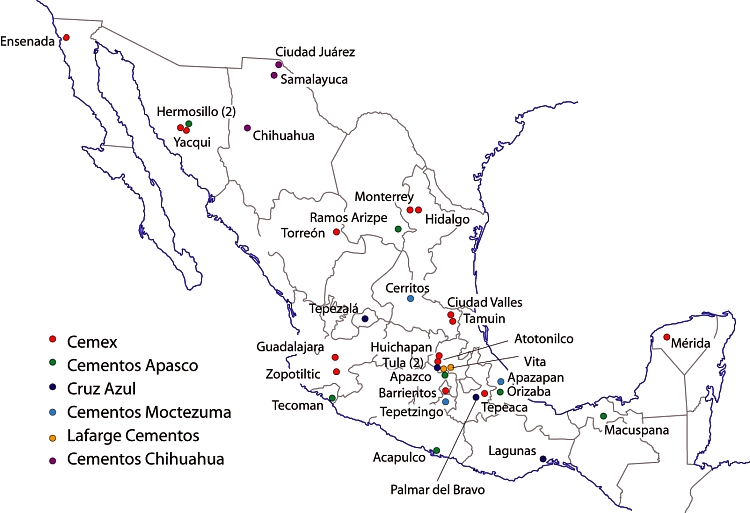
The settlement patterns of the Tarahumara in Mexico’s Copper Canyon region

 Other  Comments Off on The settlement patterns of the Tarahumara in Mexico’s Copper Canyon region
Aug 132012
 

To understand the distinctive settlement patterns of the Tarahumara today, we first need to romp through a thumbnail history covering their experiences during the years following the Spanish Conquest.

While it is uncertain precisely when the Tarahumara arrived in this area, or where they came from, the archaeological evidence seems to support the view that they probably only arrived a short time before the Spanish reached the New World. By 1500 A.D., the Tarahumara had stone dwellings, simple blankets of agave fiber, stone “metates” (pestles), and combined hunting and gathering with the cultivation of corn (maize) and gourds. Settlements at this time would have been small and scattered, with no more than a few families able to survive in any given area. Then the Spanish arrived.

In early colonial times, Spanish explorers and clerics gradually moved ever further north of Mexico City. The first twelve Jesuits had arrived in New Spain in 1572; more arrived in 1576 and by 1580, they had already established centers for their work in Michoacán (1573), Guadalajara (1574), Oaxaca (1575), Veracruz (1578) and Puebla (1580).  However, the inaccessibility of the Copper Canyon area prevented them from extending northwards as fast as they had hoped.The first important Spanish contact with the Tarahumara dates from around 1610 when a Jesuit missionary, Juan Fonte, established a mission at San Pablo de Balleza. This mission, located between the traditional territories of the Tarahumara and the neighboring Tepehuan Indians, was short-lived. In 1616, a Tepehuan‑inspired revolt led to Fonte’s death. Several hundred Spaniards along with thousands of Indians were killed in the ensuing two years of conflict.

During the remainder of the 17th century, however, the Jesuits made a steady advance, establishing numerous missions including Sisoguichi, which is still the center of their influence today. These Jesuit missions were a clerical modification of the encomienda system, an institution designed to help spread Spanish civilization, by rewarding chosen settlers with the right to collect tributes and labor from the indigenous population. The Jesuit missions usually had two friars teaching religion, handicrafts, agriculture and self‑government, together with a few soldiers for protection.

As early as 1645, some Tarahumara were working in mines, some as slaves, others voluntarily for wages. This is when both the Jesuits and the mine operators encouraged the Indians to relocate and concentrate their homes in villages or towns. This major change in settlement pattern facilitated the provision of religion and education and made it easier to organize the labor force. The Tarahumara resisted this move more strongly than other indigenous groups did elsewhere in New Spain.

The early Jesuit/Tarahumara contacts were relatively friendly, but disillusionment soon set in and around 1650 the Tarahumara essentially split into two opposing factions, the “baptizados” (Christians) and the “gentiles” (unconverted). The former decided that the priests offered a worthwhile alternative to their traditional way of life and remained in the missions. The gentiles, blaming the Spanish God for widespread epidemics, withdrew into the difficult terrain of mountains and canyons of the Copper Canyon region, effectively trying to avoid any further contact with the Spanish. Later rebellions by the gentiles , such as that in the 1690s, were brutally put down by Spanish troops. This ended Tarahumara military resistance but ensured that they withdrew still further into the canyons.

The mission settlements

The two groups of Tarahumara now have very different settlement patterns, and some significant differences in their way of life. The baptizados live in mission villages, many of which are located east of the true canyon region, where valleys offer ample arable land and better possibilities for highways and communications. The settlements are nucleated, with homes built close to the protection of the church, and farmland surrounding the villages. These villages attracted many mestizo settlers, who saw opportunities in agriculture, forestry and commerce. Intermarriage became more common and the Tarahumara’s social customs changed as they assimilated more mestizo habits and became more Mexicanized.

Cerocahui

The mission settlement of Cerocahui

The largest settlement in the region is Creel, a much more modern town, founded in 1906. The town received a massive boost following the completion of the railway between Creel and Chihuahua in 1907, and again in the 1960s when the “Copper Canyon” railway to Los Mochis and Topolobampo was finally completed.

Creel has also benefited in the past decade from its designation as one of Mexico’s Magic Towns and has received significant investments in tourist and urban infrastructure. Set at an elevation of 2340 m (7,600 feet) above sea level, Creel lies some distance from the nearest canyon, but has become the main marketing, lumber and tourist center and the gateway for trips into the more remote areas. Its population is about 6500.

Twenty kilometers from Creel is Cusárare (“Place of Eagles”), a typical mission village. The simple mission church, originally erected in 1767, was rebuilt in the 1970s. The village has a few small “corner” stores, some also selling tourist souvenirs. Less than an hour’s walk away is Painted Cave, a good-sized cave with pictographs said to have been left by the “Ancient Ones”. In the mid‑1890s, ethnologist Carl Lumholtz wrote that “there are no Mexicans [as opposed to Indians] living in Cusárare, nor nearby. Except for the small mining camp in the Copper Canyon, there are none for more than 50 miles to south, east or west.”

The gentiles‘ settlements

The traditional Tarahumara, the gentiles, are less Mexicanized, though they continue to use introduced crops, animals and agricultural implements acquired from the Spanish priests and settlers. Restricted to marginal land on the canyons’ rims and walls, they live in small, variable‑sized, dispersed settlements, often several hours apart by foot. This pattern is no surprise, given the extremes of topography that characterize the area, the limited technology (plow agriculture) available to them, and their need for spatial mobility to ensure access to grazing land for small herds of sheep and goats.

In these marginal areas, only small pockets of potentially arable land exist and many families have plots of land scattered about a considerable area, with several hours’ walk between plots. The population of their dispersed settlements (ranchos) is variable, depending on the available resources of land and water, on the pattern of marriages, and on the amount of inherited land in other ranchos, but averages between 2 and 5 family groups, a total of between 10 and 25 individuals.

The serious challenge is finding any land suitable for farming

The serious challenge is finding any land suitable for farming. Photo: Tony Burton; all rights reserved.

The homes are often perched on the gently sloping tops of the steep-sided spurs that jut out from the canyon rim, affording spectacular views, but with dangerous drop-offs beyond the areas suitable for settlement and cultivation. Individual dwellings used to be stone and mud huts, or caves in the canyon wall. The Tarahumara’s skill with the axe (a 17th century introduction) is considerable and, today, houses and other structures are made almost entirely of wood, though many caves are still inhabited, at least for part of the year. Caves which face south are preferred and their position on distant hillsides is often marked by a black, smoke‑darkened upper rim.

Perhaps the best‑built structures are their storage boxes which are wooden cubes (side about 2 m) where notched hand‑hewn planks are fitted together so tightly that not even a mouse can gain access. These structures are raised about 50 cm off the ground, usually on boulders, and have wooden roof singles. They are used to store not only food but also animal hides, horsehair ropes, simple implements, cloth, yarn and anything considered valuable. Where wood is harder to obtain, they are built of stones and mud.

Their houses are constructed in a similar fashion, but with less attention to detail. Their houses are not, therefore, very permanent. Indeed, one ancient Indian tradition holds that when a member of the household dies, the house should be abandoned or destroyed. Nowadays, the family simply moves the structure a few hundred meters and rebuilds it. The houses have dirt floors and minimal furnishings, such as wooden benches and stumps, items for food preparation, metal plates and a bucket and some animal (goat or cow) skins for sleeping on. There may also be some rough blankets and a homemade violin.

Most gentiles have more than one dwelling since they wander far afield with their animals in search of pasture and food, and since many practice a form of transhumance, spending winters near the canyon floor and summers near the canyon rim.

Sources /  Bibliography:

  1. Bennett, W. and Zingg, R. (1935) The Tarahumara. Univ. of Chicago Press. Reprinted by Rio Grande Press, 1976. Classic anthropological work.
  2. Dunne, P.M. (1948) Early Jesuit Missions in Tarahumara. Univ. Calif. Press.
  3. Kennedy, J.G. (1978) Tarahumara of the Sierra Madre; Beer, Ecology and Social Organization, AHM Publishing Corp, Arlington Heights, Illinois. Republished, as The Tarahumara of the Sierra Madre: Survivors on the Canyon’s Edge in 1996. This anthropologist lived in one of the more remote Tarahumara areas for several months, accompanied by his wife and infant daughter.
  4. Lumholtz, C. (1902) Unknown Mexico. 2 volumes. Scribner’s Sons, New York. Republished in both English and Spanish, this is a fascinating ethnographic account dating back to the end of the 19th century.
  5. Pennington, C. (1963) The Tarahumar of Mexico, their environment and material culture. Univ. of Utah Press. The reprint by Editorial Agata, Guadalajara, 1996, of this classic account of Tarahumara life and culture is embellished with wonderful color photographs, taken by Luis Verplancken, S.J. (1926-2004), who ran the mission in Creel for many years.

Related posts:
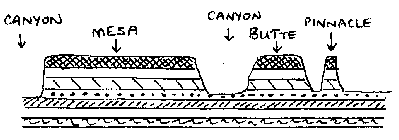
How were the canyons in the Copper Canyon region formed?

 Other  Comments Off on How were the canyons in the Copper Canyon region formed?
Aug 062012
 

According to a local Tarahumara Indian legend, the canyons were formed when “a giant walked around and the ground cracked.” However, geologists believe that a sequence of volcanic rocks varying in age from 30 to 135 million years was slowly uplifted to an average elevation of 2275 m (7500 ft) while being dissected by rivers.

Mexico's Copper Canyon

Where did the rocks come from?

The Sierra Tarahumara is part of the Western Sierra Madre, an extensive volcanic tableland, affected by grabens (rift‑valley faulting) and faults which deprive it, especially on its flanks, of any homogeneous appearance. Its eastern side merges gradually into the Chihuahua basin and range landscape; its western side is much steeper, marked by major normal faults of considerable vertical extent, and by deep canyons.

Stage 1. The lower rocks.

McDowell and Clabaugh (1979) describe two different igneous sequences, which were separated in time by a prolonged period of non‑activity. The older series is mainly comprised of intermediate igneous rocks between 100 and 45 million years old; it shows evidence of lava flows and violent eruptive activity which produced andesitic pyroclasts. There are also layers of siliceous ignimbrites. This lower series includes many rich mineral deposits, though it outcrops in only restricted parts of the Canyon system. The volcanic activity in this area was associated with the subduction of the small (now destroyed) Farallon Plate which was pushed beneath the North American Plate by the expanding Pacific Plate. The line between the lower, older series and the higher, newer one is very irregular, indicating intensive erosional activity in the period between their times of formation.

Stage 2. A break in activity allowing erosion to take place.

The major lull in volcanic action, between 45 and 34 million years ago, may have been due to a change in the inclination of the subducting Farallon plate.

Stage 3. The upper rocks.

After this break in activity, there was a sudden resumption of vulcanism. The upper series is the most extensive cover of ignimbrite known anywhere in the world, covering an area which is 250 km wide, and 1200 km long from NW to SE. It stretches as far north as the southern USA. To the south, it disappears beneath the newer volcanic rocks of Mexico’s Volcanic Axis in Jalisco and Michoacán. The ignimbrites are rhyolitic and rhyo‑dacitic in composition, generally approximately horizontal, or slightly tilted, and with ages between 34 and 27 million years. In places, these ignimbrites are more than 1000 m thick (Demant & Robin, 1965).

It is unclear precisely where all these volcanic rocks originated. One estimate is that for such large volumes of rock to have been formed, there would have been between 200 and 400 volcanic outlets, some up to 40 km across. An alternative hypothesis (proposed by Aguirre-Díaz & Labarthe-Hernández) is that large bodies of magma (molten rock underground) reached shallow parts of the crust and then partially erupted, explosively, along the fault lines of the existing basin and range structures.

The common rock types in the Copper Canyon region

Volcanic Ash is unconsolidated fragments <2 mm in diameter. Volcanic ash commonly contains larger (up to 64 mm) fragments called lapilli. Ash may be composed of crystalline rock (eg. rhyolitic and andesitic ashes), of glassy fragments (vitric ash), or of individual crystals (crystal ash). In general, the size of individual particles comprising the ash diminishes as distance increases from the volcano where it originated.

Tuff is consolidated volcanic ash.

Ignimbrites are essentially pieces of light, vesicular, pumice, in a matrix of glassy fragments. Ignimbrites are often layered and sometimes split into vertical columns. They are deposited from ash flows that included large volumes of hot, expanding gases and incandescent glass fragments.

Lavas (molten rock on the surface). When lava cools and solidifies, it produces massive (as opposed to fragmentary) rocks, generally crystalline but of variable chemical composition (andesite, rhyolite, basalt).

The major landforms of the Copper Canyon region

These layers of igneous rocks were uplifted, forming a plateau with an average elevation of 2275 m (almost 7500 feet). Rivers have carved deep gashes, up to 1400 m deep, into the plateau surface, forming a series of steep-walled canyons, separated by giant blocks, remnants of the original, continuous plateau.

Incised meanders near Umira, Chihuahua

Incised meanders near Umira, Chihuahua

Since some of the rivers exhibit superb examples of incised meanders [see photo], some, possibly most, of these rivers already existed prior to the main periods of uplift. They were meandering across a gently sloping flood plain prior to the tectonic upheavals. Then, as the landscape slowly rose around them, they carved these giant canyons. These antecedent rivers retained their courses; the meanders were incised into the landscape.

Centuries of erosion by the various rivers, including the Urique river and its tributaries, have resulted in the present-day landscape of structurally-guided plateau remnants, termed mesas, buttes and pinnacles (depending on their size). There are many examples of these distinctive landforms in the Copper Canyon region.

Landforms resulting from dissection of a plateau

Landforms resulting from the dissection of a plateau

It is likely that some of the many waterfalls in the region were formed in places where the downward vertical erosion of rivers was insufficiently powerful to counteract the forces of uplift. Other waterfalls are more likely to have resulted from differences in the relative resistance of different rocks. The effects of differential erosion are noticeable in many smaller-scale features in this landscape, such as perched “mushroom” rocks.

Perched block near San Ignacio

Perched block near San Ignacio. Photo: Tony Burton; all rights reserved

Examples of many of these landforms can be seen by anyone driving along the Creel-Batopilas road. At km 5 (from Creel) is the entrance to the Mission village of San Ignacio, near which are strange tor‑like rock formations, including “mushroom” rocks, where a more resistant capstone sits perched atop weaker rocks that are slowly being eroded away.  At km 20 in  Cusárare, a short walk south of the road through woods and along the Cusárare river leads to the very pretty 30-metre high Cusárare waterfall. At km 44 (Basihuare), there are fine views of a mesa of pink and white rocks that overlooks the road. This is Cerro el Pastel (“Cake Mountain”) with its pinnacles. At km 56, near  Umirá (or Humirá) are several spectacular incised meanders formed when the river’s course was preserved while the surrounding land was undergoing relatively rapid uplift.

Small wonder that the Copper Canyon region is one of Mexico’s most important geomorphosites!

Sources:

  1. Aguirre-Díaz, Gerardo J. & Guillermo Labarthe-Hernández. 2003. Fissure ignimbrites: Fissure-source origin for voluminous ignimbrites of the Sierra Madre Occidental and its relationship with Basin and Range faulting. Geology September, 2003 v. 31, no. 9, p. 773-776
  2. Gajdusek, D.C. (1953) “The Sierra Tarahumara” in Geographical Review, New York. 43: 15‑38
  3. Demant, A & Robin, C (1975) “Las Fases del vulcanismo en Mexico” Revista Instituto de Geologia, UNAM, Mexico City. 75 (1) pp 70‑83
  4. Schmidt, R.H. (1973) A Geographical Survey of Chihuahua, monograph #37 Texas Western Press.
  5. McDowell, F.W. & Clabaugh, S.E. (1979) “Ignimbrites of the Sierra Madre Occidental and their relation to the tectonic history of western Mexico” in “Ash flow tuffs” edited by Chapin, C.E. & Elston, W.E., Geol. Soc. of America special paper # 180.

Related posts:
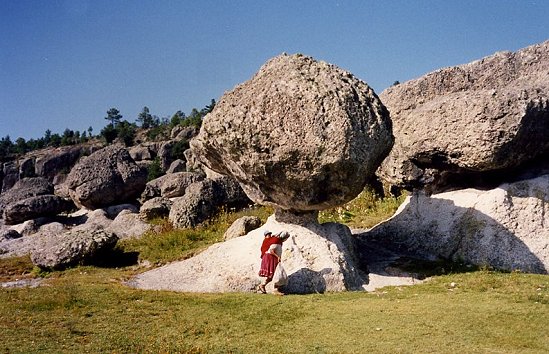
The value in Mexico of unpaid work in the home

 Other  Comments Off on The value in Mexico of unpaid work in the home
Aug 042012
 

A study by the National Statistics Institute (INEGI) based on 2010 data calculated that routine work done in the home (almost 80% of the time-value involved by women) is worth about 2.9 trillion pesos to the Mexican economy each year, equivalent to more than 20% of Mexico’s GDP. By way of comparison, manufacturing accounts for 17.2% of GDP, and commerce 15% of GDP.

The INEGI calculation includes the costs in time/labor needed to meet the demands of the home, and the net salary that would be paid for someone undertaking those tasks.

INEGI divides work done in the home into six categories:

  • help and assistance to members of the household. [In market value terms, this is equivalent to 6.9% of GDP]
  • preparation and serving of meals [5% of GDP]
  • cleaning and maintaining the home [3.5% of GDP]
  • shopping and household administration [2.9% of GDP]
  • washing and looking after footwear and clothing [2% of GDP]
  • helping other households and voluntary work [1.6% of GDP]

INEGI’s findings suggest that some aspects of family life and the division of “duties” (such as that common to older images like the one below) are not changing very rapidly.

"La Familia" ("The Family"). School chart of unknown date.

“La Familia” (“The Family”). School chart of unknown date.

Related posts:
The seven main canyons in the Copper Canyon region

 Other  Comments Off on The seven main canyons in the Copper Canyon region
Jul 302012
 

The Copper Canyon region in Mexico is the informal name for the area, in the south-west part of Chihuahua state, where several deep canyons bisect the Sierra Tarahumara. The 10,000 km2 area, part of the Western Sierra Madre, is home to about 50,000 Tarahumara Indians, one of the largest native Indian groups in North America. While generally referred to in English as the Tarahumara, the people’s own name for themselves is Raramuri“, literally “the light‑footed ones” or “footrunners”.

Location of Barrancas del Cobre (Copper Canyon region)

Location of Barrancas del Cobre (Copper Canyon region)

While the Tarahumara have so far succeeded in keeping many aspects of their distinctive culture relatively unadulterated, the pressures on them have increased considerably in recent years as improving highway links have made the region more accessible, not only to tourists, but also to developers looking to exploit the region’s forest and mineral resources.

Spanish-speakers usually refer to this region as the “Barrancas del Cobre” (Copper Canyons, plural). The table shows the seven main canyons, only one of which, strictly speaking, is the Copper Canyon. The precise number of canyons depends on whether they are defined by rivers or by local names since different stretches of canyon along a single river have sometimes been given different names.

Canyon Elevation at the rim (meters / feet a.s.l.) Elevation of stream in canyon floor (meters / feet) Depth (meters/feet)
Canyons south and east of railroad
Urique (south of Urique village) 2370 / 7775 500 / 1640 1870 / 6135
Sinforosa (Río Verde) 2530 / 8300 700 / 2300 1830 / 6000
Batopilas 2500 / 8200 700 / 2300 1800 / 5900
Urique (mid-point, aka Copper Canyon) 2300 /7545 1000 / 3280 1300 / 4265
Canyons north and west of railroad
Candameña (below Basaseachi Falls) 2540 / 8330 900 / 2950 1640 /5380
Chinipas 2000 / 6560 400 / 1310 1600 / 5250
Oteros 2220 / 7280 700 / 2300 1520 / 5980

The major canyon is the Urique Canyon. This is the one seen by most tourists because it is the closest to the railway line that traverses the region. Both the Urique River and the Batopilas River flow into the River Fuerte, which enters the Gulf of Mexico near Los Mochis.

Tarahumara place names

The Tarahumara have very few place-names. They do not usually have identifying names for specific mountains, streams, trails or landmarks , but do give names to every small settlement, even if it only consists of two or three homes.  These names serve to distinguish one family from another, but a single family may have several farms, each with a different name. The Tarahumara do have “a rather complete terminology for plants, animals, and birds.”  [Bennet & Zingg, 1935] The place-names for settlements are usually two-part names, consisting of a descriptive name plus a place suffix.

Examples include:

  • Aworítci, from aworíki, “cedar tree” (tci gives idea of a grove of trees).
  • Wisarótici, from wisaró, “poplar tree.”
  • Tcimétabo, from tcimáka, “leather money bag”, plus –tabo, place-ending.
  • Wagítali, from wagítci, “dead tree.”
  • Garitcí, from garíki, “house.”
  • Kusárare, from kusáka, “eagle.”

In future posts, we will delve further into the geography of the  Copper Canyon region and the lifestyle of the Tarahumara Indians.

Sources:

Bennett, W. and Zingg, R. (1935) The Tarahumara. Univ. of Chicago Press. Reprinted by Rio Grande Press, 1976. Classic anthropological work.

Gajdusek, D.C. (1953) “The Sierra Tarahumara” in Geographical Review, New York. 43: 15‑38

Schmidt, R.H. (1973) A Geographical Survey of Chihuahua, monograph #37 Texas Western Press.

Related posts:
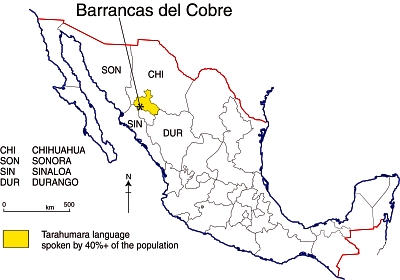
The Guelaguetza, the major cultural festival of Oaxaca state

 Other  Comments Off on The Guelaguetza, the major cultural festival of Oaxaca state
Jul 282012
 

Oaxaca’s single biggest cultural event, held in the second half of July, has come to be known as the Guelaguetza, which is Zapotec for “offering” or “mutual help”. It celebrates the cultural and ethnic diversity of the state. This year’s edition (the 80th) of the Guelaguetza ends on Monday 30 July, so this is the final weekend.

A massive open-air amphitheater, seating 100,000 people, is a permanent fixture on the side of the Fortín hill which overlooks the north west quadrant of Oaxaca city. The original Aztec garrison (for the collection of tributes), known as Huaxyacac, was established by Ahuitzotl at the end of the fifteenth century on this very hill. Today, a massive statue of Benito Juárez (cast in Rome in 1891) stares out over the suburbs.

Guelaguetza

The Guelaguetza

The Guelaguetza may have its origins in Mixtec and Zapotec celebrations of their corn crop. Later, the festival was carried on by the Aztecs in honor of their corn god, Xilonen. Later still, in the eighteenth century, the Spanish Carmelite missionaries linked the festival to their own Christian rites for the Virgen del Carmen (16-24 July). The timing holds even more significance today since July 18 also marks the anniversary of the death of Juárez, a much-revered politician of humble, indigenous origin, who served five terms as president of Mexico in the nineteenth century.

Guelaguetza

In the 1930s, the fiesta of the Guelaguetza took on its modern hybrid form, which includes a parade of stilt-walking “giants”. During the Guelaguetza, the Fortín hill is the scene for spectacularly colorful regional folkloric dances performed by several different ethnic groups (Mixtec, Zapotec, Trique, Popolac, Chootal, Chinantec, Mazatec, Mixe) from the seven main geographic regions of the state. The entire city comes alive with color. Color is everywhere from the beautifully hand-embroidered dresses and huipiles, to the food, to the paper streamers decorating the streets and to the mixture of merchandise sold on the sidewalks.

For travelers unable to visit in July, some central hotels, including the Camino Real, luxuriously housed in an architecturally-gorgeous former convent, and the Monte Alban opposite the cathedral, offer a weekly, scaled-down version of the Guelaguetza, year-round.

Want to read more?

Related posts:
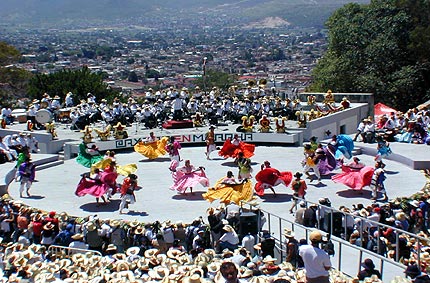
 

Appropriate technology project supplies solar-powered stoves

 Other  Comments Off on Appropriate technology project supplies solar-powered stoves
Jul 262012
 

In a recent post, we mentioned a video on the Global Post website about transport developments in Mexico City. Global Post has published another short video in the same series, that is equally interesting and valuable as a teaching resource:

My first experience of a solar-powered stove was during an environmental education workshop in the state of Michoacán some 25 years ago. I was underwhelmed by its performance, but the more modern (and much more efficient) designs featured in this video definitely merit a much closer look.

The video focuses on the work of Gregor Schäpers, a self-taught solar engineer, and his company Trinysol, that makes solar-powered stoves and boilers. The company, located in the village of El Sauz in the state of Hidalgo, a short distance north-east of Mexico City, is a good example of the development of appropriate technology.

One of Trinysol’s first projects was working with a women’s cooperative in the village of  San Andrés, who produce a sweet  syrup from green agave plants. The process involves hours of cooking, and therefore requires a large input of energy. Prior to the installation of Scheffler reflectors and solar-powered hotplates, the women relied on gas.

Solar reflectors, San Andrés.

Schäpers has since set up hundreds of solar-powered boilers, and dozens of solar stoves in the region. Some are designed for individual families; others are suitable for small-scale industrial use, for example to provide energy for bakeries (panaderias) or tortilla-making plants (tortillerias).

According to the figures offered in the video, it costs about 4,000 dollars to build and install heating for a panadería, but can save the owners up to 5,000 dollars a year in energy costs. The investment is therefore fully recouped within a year. The system should last for 30 years, so a solar-powered system represents a significant improvement to the economics of many small businesses, giving them the opportunity to expand or allocate more of their scarce resources elsewhere.

Jul 232012
 

Grateful thanks to Annie Hansen for alerting us to the fact that 23 July was first proposed as “Día del Geógrafo de México” (“Mexican Geographers’ Day”) in a short paper published in 1999. Héctor Mendoza Vargas proposed that day because it marked the opening, in 1939, of the first National Congress of Geography ever held in Mexico. His suggestion was the winner in a competition to choose a suitable day on which to celebrate the work of geographers. Ever since then, 23 July has been a special day for all geographers in Mexico.

The first National Congress in 1939 ran from 23 July to 31 July, with sessions taking place in the Palace of Fine Arts (Palacio de Bellas Artes) in downtown Mexico City.

The full text of Mendoza Vargas’ short paper proposing 23 July as “Día del Geógrafo de México” can be seen here. It includes some interesting background history.

A Happy Geographers’ Day to all our readers!

Is Mexico experiencing a demographic dividend?

 Other  Comments Off on Is Mexico experiencing a demographic dividend?
Jul 232012
 

Mexico’s 2010 population of 112 million makes it the world’s 11th largest country in terms of population. The rate of population increase is now slowing down as fertility rates fall. The rate of increase, which was 2.63%/yr for the period 1970-1990, fell to 1.61%/yr for the period 1990-2010.

Even as the total population continues to grow over the next few decades, some very important changes are underway in Mexico’s population structure.

The graph divides Mexico’s population into three age categories: under 15 (youth), 15-59 (working age) and 60+ (elderly).

Mexico's population structure, 1970-2010

Mexico’s population structure, 1950-2010

The percentage of the total population of youthful age peaked in about 1970 at 46.2% and has since fallen to 29.3% in 2010. Over the same time period, the percentage of working age population has risen from 48.2% to 61.6%, while the percentage of elderly has gone from 5.6% to 9.1%.

Why is this important?

Perhaps the most obvious change is that government spending on schools and services for youth needs to shift towards spending on health care, pensions and services for the elderly. There are already some suburbs of the Mexico City Metropolitan Area that have experienced a dramatic shift in average age. Perhaps the most notable example is the Ciudad Satelite area, an area originally intended to be, and planned as, a genuine satellite settlement. A few decades later, the urban expansion of Mexico City had swallowed it up. An area which once had many young families now has very few children. The homeowners association of Ciudad Satelite estimates that 75% of the area’s 50,000 inhabitants is now elderly.

The major benefit of the changing population structure would appear to be that, in 2010, there are more wage-earners (and tax payers) for every person of non-working age (assumed for simplicity to be youth under 15, and the elderly aged 60+) than at any previous time. In other words, the total dependency rate is lower than ever before.

Economists argue that this “demographic dividend” should raise GDP, and could offer many significant advantages, such as enabling greater government expenditures on infrastructure or on social services. They point to several countries in East Asia as examples where economic growth spurts went hand-in-hand with a period of demographic dividend.

Despite the claims of economists, I’m not convinced that Mexico will prove to be an equally good example of the benefits of a demographic dividend. In Mexico’s case, the early phase of higher youthful population (and considerable economic growth) was accompanied by a high rate of emigration of working age Mexicans to the USA. Admittedly, emigration has now slowed, or stopped.

As Aaron Terrazas and his co-authors point out in Evolving Demographic and Human-Capital Trends in Mexico and Central America and Their Implications for Regional Migration [pdf file],

“But across Latin America, and in sharp contrast to East Asia, favorable demographic change has failed to translate into economic growth and prosperity. National income per capita has increased only modestly since the start of the demographic dividend, with Mexico outperforming its southern neighbors at comparable points in time. And emigration from the region has continued to grow despite the demographic transitions in Mexico and El Salvador, with the United States absorbing between one-fifth and one-quarter of the region’s annual population growth.”

Whether or not Mexico experiences a demographic dividend, it will not last for ever. In Mexico’s case, it looks set to last only about about 20 years. By 2050, according to current predictions, about 26.4% of the Mexico’s population will be youthful, and 27.7% elderly, while the percentage of working age will have fallen to 45.9%.

Related posts:
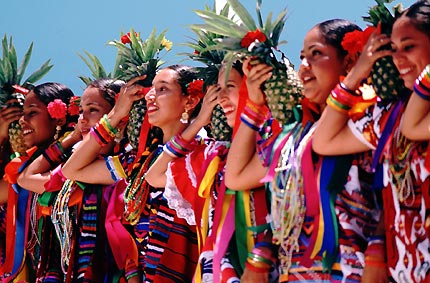


Mexico’s position among the world’s largest economies: 1900 to 2008

 Other  Comments Off on Mexico’s position among the world’s largest economies: 1900 to 2008
Jul 072012
 

Comparing the historical sizes of national economies is extremely challenging. Fortunately, Gapminder has attempted to do this by compiling GDP data for all countries in the world for the period since 1800. (For details, see here and here.) Gapminder’s approach relies on first obtaining for each country historical population size and Gross Domestic Product per capita (GDPpc) and then multiplying these to obtain the GDP. Gapminder relies on quantitative and qualitative data from hundreds of official and unofficial documents and a number of carefully documented assumptions.

Mexico’s total GDP has grown almost 60-fold since 1900 in inflation-adjusted constant 2005 dollars based on Purchasing Power Parity, which measures total goods and services produced by an economy independent of exchange rates. Growth started rather slowly, but accelerated very rapidly at mid-century. From 1940 to 1980, Mexico’s economy almost doubled each decade, moving up from $49 billion in 1940 to $637 billion in 1980, averaging about 6.6% per year. Of course, Mexico’s population was also growing rapidly during those four decades. Growth slowed to 2.0% per year in the 1980s but jumped up to 3.4% in the 1990s. From 2000 to 2008, growth slowed to 2.1% per year, partially as a result of the severe recession in the USA. Mexico’s economy is expected to grow significantly faster in this decade.

Growth of major world economies, 1900 to 2008 (Gapminder data)

(GDP in billions of constant 2005 US dollars based on Purchasing Power Parity)

Country19001930195019802008Growth/yr, 1900-2008
Brazil10381069371,8584.9%
Canada23731485771,2113.8%
China3214972169178,8623.1%
France1672672971,0951,8752.3%
Germany2554064161,7342,7012.2%
Indianana2085732,951na
Indonesia2655562288373.3%
Italy721492109151,6142.9%
Japan771652222,1603,9853.7%
MEXICO2336946371,3343.8%
Russianana375na2,089na
South Korea712161651,1774.9%
UK2403514901,0252,0042.0%
USA5061,1562,4146,33912,9603.1%

In 1900, Mexico’s total GDP of $23.3 billion was just ahead of Canada and over twice that of Brazil. However it was behind Indonesia and less than 5% of the USA’s world leading GDP. The Mexican economy was less than one tenth that of Germany and the UK, a seventh that of France and less than a third that of Japan and Italy. The table shows GDP levels for some of the world’s largest economies from 1900 to 2008.

The Mexican GDP expanded by 1.5% per year from 1900 to 1930 despite stagnation during the Mexican Revolution of 1910 to 1920. While this growth rate was better than UK, and tied with China, it was slower than the other countries in the table which expanded rapidly at the start of the 20thcentury. Brazil spurted ahead at 4.4% per year, edging past Mexico as Latin America’s largest economy. Canada expanded by 3.9% per year and doubled Mexico’s GDP. The USA grew by 2.8% per year becoming the first trillion dollar economy by 1923. France and Germany grew at about 1.6% per year, while Japan, Indonesia and Italy expanded by about 2.5% to 2.6%.

From 1930 to 1950, Mexico grew rapidly to $94 billion at a very impressive 4.9% per year, faster than all the other countries except Brazil at 5.3% per year. The USA (up 3.8% per year) and Canada (up 3.6%) also expanded rapidly, while the UK, Italy and Japan grew much slower, in the 1.5% to 1.7% range. The other countries struggled at rates around 0.5% or less. China’s GDP declined by a mind-boggling 4.1% per year during the 20 years from $497 billion down to $216 billion, more than a third less than what it had been in 1820! China’s economy seriously contracted over a 130 year period. The Great Depression hurt most economies; however World War II allies Japan (up 5.8% per year) and Germany (up 3.9%) grew relatively rapidly during the 1930s.

The 1940s and World War II had very dramatic impacts on the major economies. During the decade, Mexico’s GDP led the field with very impressive growth at 6.7% per year, closely followed by Brazil at 6.2%, USA at 5.2% and Canada at 5.0%. Wartime production was a major stimulus to these economies. On the negative side, several countries experienced dramatic war-related loses. China was at war throughout the decade and its economy declined by an incredible 7.0% per year during the 1940s, Germany was down by 3.5%, Japan by 2.6%, South Korea by 2.7% and Indonesia by 2.5%. Compounding these annual changes demonstrates their real significance. Mexico’s GDP almost doubled from $49 billion in 1940 to $94 billion in 1950, while China’s GDP dropped more than half from $447 billion in 1940 to $216 billion in 1950. By 1950, Mexico’s GDP was nearly half that of China and Japan, 1.7 times that of Indonesia and over six times that of South Korea. These four Asian countries would grow very rapidly during the “Asian Miracle” of the second half of the 20th century.

Mexico continued its dramatic growth expanding by 6.6% per year from 1950 to 1980. This was the “Mexican Miracle” which actually started in the 1940s. By 1980, Mexico’s GDP reached $637 billion, surpassing Canada and India; it was above one tenth of the USA’s GDP for the first time in over 100 years. All other economies also grew very rapidly during this thirty year boom period. Japan led the way with 7.9% per year, followed by Brazil at 7.5% per year. China finally broke from its 130 year slump growing at 4.9% per year; in 1956 it finally regained the GDP level it had in 1820. In 1980 Mexico’s GDP was about 70% that of China compared to only 7% in 1930 and 2% in 1820.

From 1980 to 2008, Mexico’s growth slowed a bit but still managed a very respectable increase of 2.7% per year which doubled its GDP from $637 billion to $1.334 trillion. This growth rate was better than that of Japan and all other large western economies (tied with Canada). But it significantly lagged behind four large Asian economies: China (up 8.4% per year), India (up 6.0%), South Korea (up 7.3%) and Indonesia (up 4.8%). China’s GDP increased almost ten-fold from 1980 to 2008. In 1980 India’s GDP was less than that of Mexico, but by 2008 it was over twice as large. Mexico’s GDP in 2008 of $1.3 trillion puts it in 11thplace, behind Italy and just ahead of Spain, Canada and South Korea.

Reviewing the entire 108-year period from 1900 to 2008 reveals the dramatically changes that can occur. Some Asian countries, especially China, really struggled for decades early in the century and then expanded extremely rapidly in recent decades. Compared to the other countries, Mexico did extremely well increasing at an average of 3.8% per year from $23 billion in 1900 to $1.3 trillion in 2008, a 57-fold increase. Brazil and Korea did considerably better, averaging 4.9% per year for 180-fold increases. Even the slowest growth country, the UK, grew by a respectable 2.0% per year for over an eight-fold increase since 1900. All major economies did well making the 20thcentury clearly the best century by far in terms of economic growth. The total GDP of 12 countries (Brazil, Canada, China, France, Germany, Indonesia, Italy, Japan, Mexico, South Korea, UK and USA)in the table with available data grew by 2.0% per year from 1900 to 1950 compared to a very impressive 3.8% per year from 1950 to 2008. The second half of the century was much better than the first; this indicates that economic growth is accelerating and accelerating fast. Will this continue in the decades ahead?


Jul 052012
 

By virtue of its geography, the Gulf coast state of Veracruz is one of the best places in the world to see the annual migration of birds of prey (raptors) from North America to Central and South America.

Between 4 and 6 million birds (eagles, hawks, vultures, falcons, and kites) make this trip each way each year to trade the harsh winter and scarce food in one hemisphere for better conditions in the other hemisphere. The migration south takes place September-November, and the return migration passes overhead in March-April.

Since most raptors are relatively large birds, and they are accompanied by other species such as storks, white pelicans and anhingas, this annual migration is one of the most awesome birding spectacles anywhere in the world. Each passing flock contains tens of thousands, in some cases hundreds of thousands, of individuals.

The raptors fly during daylight and rest overnight. Their New World songbird cousins, who also migrate in vast numbers, prefer to feed and rest during the day and then fly at night. Most songbirds take a direct migration route from the eastern USA to Central and South America, flying directly over the Gulf of Mexico in a “single, epic 18-hour flight”. Raptors, on the other hand, prefer a more leisurely approach, leap-frogging along the coastal plain.

Why do they fly through Veracruz?

The main reasons are:

1. Relief: Mexico’s mountain ranges, especially the Sierra Madre Oriental {Eastern Sierra Madre) and Volcanic Axis, funnel the birds towards the east coast, but the Gulf of Mexico provides a natural barrier preventing the birds from attempting routes further to the east. At its narrowest, this funnel is only 25 km (15 miles) wide.

2. Climate: The wide coastal plain warms up sufficiently to provide ascending thermal “bubbles” which help keep these large birds aloft and minimize  the energy expenditure required to soar and fly large distances. Raptors use the thermals to soar to about 1000 meters (3000 feet) above the ground, before gliding in their desired direction of travel gradually losing height until they pick up another thermal at a height of about 300 meters (1000 feet), repeating the process as often as needed. On a good day, they will cover more than 320 km (200 miles) in this fashion before resting for the night.

3. Biogeography: The varied landscape, vegetation and animal life in habitats ranging from tropical wetlands to temperature forests, offers plenty of potential food sources for the raptors.

This massive migration has been studied since the early 1990s and scientists continue to tag birds today in order to update their estimates of bird populations and of the precise timing and routes involved. An official counts is held each year from 20 August to 20 November, organized by Pronatura Veracruz. The count is held in two locations: Cardel and Chichicaxtle (see map).

The counts have confirmed that Veracruz hosts the most concentrated raptor migration in the world.

One of the major long-term threats to this migration is habitat change in central Veracruz. Pronatura Veracruz sponsors an environmental education program known as “Rivers of Raptors” which tries to address this issue, helping local landowners appreciate the need for watershed protection and for an end to deforestation.

Pronatura’s work with raptors and the local communities is partially funded by ecotourism, and hawk-watching has become an important component of Mexico’s fledgling “ornithological tourism” market. Other key sites in Mexico for birding tourism include the tropical forests of the Yucatán Peninsula and Chiapas, and the San Blas wetlands in the western state of Nayarit.

Map of Central Veracruz

Map of Central Veracruz; all rights reserved. Click map to enlarge

In fact, Mexico is one of the world’s most important countries for birds, home to 1054 species of birds, 98 of them endemic, including 55 globally threatened species. Mexico has no fewer than 145 recognized “Important Bird Areas” (IBAs) of global significance, which between them cover 12% of the national land area (see summary map below).

Important Bird Areas in Mexico [Birdlife.org]

Important Bird Areas in Mexico [Birdlife.org]

Want to read more about the raptors?

Related posts:
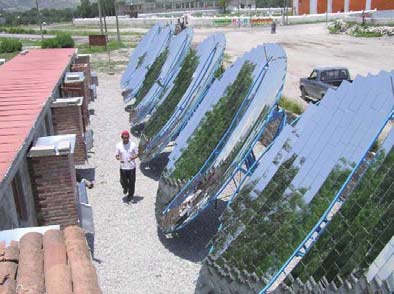
 

Is Mexico the world’s 13th or 14th largest country?

 Other  Comments Off on Is Mexico the world’s 13th or 14th largest country?
Jul 022012
 

One would think that with satellite imagery there would be no question concerning the land area of countries. However, when talking about area there are some definitional issues. Are we talking about “land area” or “total area” which includes land area and inland water bodies such as lakes, reservoirs and rivers? This can be important when talking about the relative size of countries.

Without question Russia is the largest with nearly twice the area of the second place country. What are the second, third and fourth place countries? If we are talking about “land area”, excluding inland waters, then China is second (9.570 million square kilometers), the USA is third (9.162m sq km) and Canada is fourth (9.094m sq km). However, when inland waters are included to get “total area” then Canada is second (9.985m sq km), China is third (9.597m sq km) and the USA is fourth (9.526m sq km). Generally “total area” is the measure used to compare the geographic areas of countries (see table).

Total area of the world’s largest countries (millions of square kilometers)

RankCountryArea (millions of sq. km)RankCountryArea (millions of sq. km)
1Russia17.09811Congo2.345
2Canada9.98512Saudi Arabia2.150
3China9.59713Mexico1.964
4USA9.52614Indonesia1.911
5Brazil8.51515Sudan (post 2011)1.861
6Australia7.69216Libya1.759
7India3.16617Iran1.648
8Argentina2.78018Mongolia1.564
9Kazakhstan2.72519Peru1.285
10Algeria2.381

Generally we might expect a country’s geographic area rank to stay the same from year to year and even decade to decade. However, this is not the case. Prior to 1991 Mexico was considered the world’s 13th largest country. However with the dissolution of the Soviet Union in 2011, Kazakhstan became an independent country ranked 9th in total area. This pushed Mexico down to 14th.

When South Sudan split away from Sudan in mid 2011, the area of “new” Sudan was reduced by over 25%. This dropped Sudan from 10th to 15th on the list of the world’s largest countries. It also moved Mexico from 14th back up to 13th place on the list. Such political changes can have enormous impact on the size of countries. For example, prior to 1951 when Tibet was considered an independent country, the size of China was an eighth smaller than it is now. Mexico before 1846 was almost twice its current size and perhaps the fifth largest independent country behind only Russia, China, the USA and Brazil.

Another issue concerns whether Greenland (2.166m sq km)  is counted as a country. While Greenland is officially a dependency of Denmark it has been moving toward independence. In 1985 it left the European Economic Community (EEC) while Denmark remained in the EEC. Greenland has its own Parliament and Prime Minister; in June 2009 Greenland assumed self-determination with Greenlandic as its sole official language. If/when Greenland becomes officially an independent “country” it will be the world’s 12th largest, bumping Mexico back into 14th place. Until this happens, Mexico remains the world’s 13th largest country.

The changes in rank discussed above came about for political reasons. They did not involve any physical changes. With global warming and rising sea levels some countries will actually become geographically smaller. However these changes will not affect the area ranking of the 20 largest countries for at least the next hundred years.

Related posts:
 

Mexico’s GDP and position among the world’s largest economies, 1800 to 1900

 Other  Comments Off on Mexico’s GDP and position among the world’s largest economies, 1800 to 1900
Jun 302012
 

Comparing the historical sizes of national economies is extremely challenging. This post relies on data from Gapminder which has attempted to do this for all the countries in the world for the period since 1800. Gapminder’s approach relies on first obtaining for each country historical population size and Gross Domestic Product per capita (GDPpc; for more details, see Standard of living in Mexico since 1800: some international comparisons) and then multiplying these to obtain the GDP. To obtain historical measures of population and GDPpc, Gapminder relies on quantitative and qualitative data from hundreds of official and unofficial documents and a number of carefully documented assumptions. In some cases they admit that some of their numbers for years before 1900 are essentially well-educated “guesstimates”. [Full details are given in the pdf file “Documentation for GDP per capita by purchasing power parities“.]

Though the Gapminder data have limitations, they are about the best source for comparing the GDP growth of Mexico since 1800 with that of other large economies. The Gapminder GDPpc data are adjusted for inflation by using constant 2005 US dollars. They are also based on Purchasing Power Parity (PPP) which measures total goods and services produced by an economy independent of exchange rates.

During the 19th century Mexico’s total GDP grew at a relatively unimpressive 1.3% per year, which was only about 0.5% above population growth. In 1800, Mexico’s estimated GDP was just over $6 billion, ranking it second in the Americas. Though this was almost nine times the GDP of Canada, and 3.6 times that of Brazil, it was less than that of Nigeria and half that of the USA. China had by far the largest GDP in 1800 at about $290 billion, more than three times the GDP of second place India, over seven times that of Japan and the large European countries (France, Germany and the UK) and over 20 times that of the USA. The table below shows the estimated GDP levels from 1800 to 1900 for some of the world’s current largest economies.

Estimated total GDP of large economies, 1800 to 1900

(GDP in billions of constant 2005 US dollars based on Purchasing Power Parity)

Country1800182018701900Growth/yr, 1800-1900
Brazil1.72.47.010.31.8%
Canada0.71.19.323.13.6%
China286.9328.8279.1320.90.1%
France38.447.1113.5167.31.5%
Germany36.048.5113.2254.72.0%
India91.098.2118.8nana
Indonesia8.39.316.026.31.2%
Italy23.629.344.671.61.1%
Japan31.133.639.676.60.9%
MEXICO6.17.39.123.31.3%
Russia25.626.2nanana
UK34.945.4151.3240.12.0%
USA12.720.1261.3506.03.8%

From 1800 to 1820, just before gaining independence, the Mexican economy grew to $7.3 billion at a sluggish rate of about 0.9% per year. In contrast, Canada and the USA expanded at around 2.3% per year while Brazil’s GDP went up about 1.9% per year. Germany, France, UK and Italy grew at roughly 1.0% to 1.5% per year. The major Asian countries–China, India, Japan and Indonesia–only managed 0.4% to 0.7% per year. The Russian economy essentially stagnated during the 20 year period. China maintained the top position with over three times the GDP of India and over six times those of the large European economies.

By 1870, Mexico’s GDP had inched up over $9 billion growing rather slowly at just over 0.4% per year since 1820; this was slower than the population growth rate. While Mexico’s growth rate was better than the three biggest Asian economies, it severely lagged behind its northern neighbors which grew very rapidly based on industrialization and immigration. Canada’s economy expanded by an impressive 4.4% per year and edged past Mexico. The USA did almost as well at 4.2% per year to move into second place behind China, which declined by a surprising 0.3% per year over the fifty year period. (In China both GDPpc and population declined from 1820 to 1870.)

Brazil grew by a solid 2.1% per year and closed the gap with Mexico. The three largest European economies were also industrializing and grew by roughly 1.7% to 2.0% per year, but they were still overtaken by the USA. While Indonesia’s GDP expanded by about 1.1% per year, growth rates for Japan and India were less than 0.4% per year.

From 1870 to 1900, under the Porifiro Diaz regime, Mexico’s economy grew rapidly at about 3.2% per year up to $23.3 billion. This put Mexico just ahead of Canada which grew slightly more slowly at roughly 3.1% per year. Mexico’s estimated GDP in 1900 was just behind that of Indonesia but over twice that of Brazil which slowed to 1.3% per year. The USA sped ahead at 3.9%. In the early 1880s it became the world’s largest economy by overtaking China which grew slowly at less than 0.5% per year. In 1900 China’s estimated GDP was actually less than it had been 80 years earlier in 1820. By 1900 the USA’s estimated GDP was over $500 billion, about 22 times that of Mexico. Germany grew at an impressive 2.7% per year becoming Europe’s largest economy by moving past the UK which grew at 2.2%, about the same rate as Japan. Growth in France and Italy was significantly slower.

During the full 19th century, Mexico almost quadrupled its GDP but its overall economic performance was fair at best. Its growth rate of just over 1.3% per year was better than the Asian countries which performed poorly during the century. The USA registered a very impressive 3.8% growth per year resulting in a fortyfold GDP increase. Canada was a close second with 3.6% per year and a 34-fold increase. Germany and the UK had seven-fold increases with growth rates near 2.0%, followed by Brazil at 1.8% growth per year. France followed with growth averaging just under1.5% per year. Though these Gapminder GDP levels have some limitations, they do give a pretty good indication of relative historical economic sizes and growth rates.

Mexico’s economic performance was much better in the 20thcentury as was that of all major world countries. A future post will focus on economic growth since 1900.


Ever wondered how ropes are made? A photo essay about Villa Progreso, Querétaro

 Other  Comments Off on Ever wondered how ropes are made? A photo essay about Villa Progreso, Querétaro
Jun 282012
 

This account of the rope-making industry in the small village of Villa Progreso in the state of Querétaro, is based on information collected during numerous student interviews conducted in the village in the 1980s.

Villa Progreso in the 1980s

Preparing to start. Rope-maker starts to twist the strands.

Preparing to start. Rope-maker starts to twist the strands.

Villa Progreso is nestled in the hills at the end of a road, east of the town of Ezequiel Montes. The rocky soil is not very fertile, and water is in short supply, so agricultural production is limited, though maguey plants grow well here, even when neglected. The local maguey plants used to supply the raw material for rope-making, the main “secondary” occupation in the village.

However, as the village’s population increased, and as more and more families became dependent on rope-making, another maguey product, ixtle de henequen (henequen fibers), had to be trucked in as the raw material from other states, in particular from Yucatán and Tamaulipas.

The trucks are either rented by the villagers or supplied by the village “distributors” (who eventually buy the finished ropes from the village). About 40 metric tons of henequen are needed each week to keep the rope-makers supplied.

In the 1980s (all monetary figures are from that time), raw henequen was bought by the distributors for about 50 pesos a kilo, and then resold to the villagers at about 95 pesos a kilo. The distributors are “middle men” who, in the words of one student, “make a lot of money doing nothing” and “live in the largest, most expensive homes in the village.”

Once the villagers have purchased a supply of henequen, they perform the various tasks to turn it into ropes. The first step is to “comb” it to make fine fibers and to clean the henequen.

The fibers are then shaken in the wind to further separate them before being stored in a large sack. The ends of the top fibers are then tied onto three wires (see first photo). These wires are made to spin by a wheel.

This is often an old bicycle wheel. Some villagers turn the wheel themselves as they walk backwards feeding fibers onto the wires, via a rope that is wound over the wheel; others rely on children or family members to turn the wheel.

The rope gets longer... and thicker...

The rope gets longer… and thicker…

As the person carrying the sack walks backwards, they continue to feed the three strands of fiber, gradually creating three fine strands of rope. The spinning process is repeated, using the fine strands as the basis, and the rope can be made as thick as you like by successive spins.

The entire family helps

The entire family helps (note cloth tied as sunshade)

The main output from this system is strands of rope of various thicknesses, used for things such as clothes lines. Short strands of henequen are not wasted, but formed into natural cleaning pads.

The work is done by the entire family. One worker pointed out that “it is better to have a large family as like this all can work for each other”. Any workers who have no family have to hire extra workers and are unlikely to make any profit.

On a good day, one family can produce about 72 ropes, each about 5 meters long, which can be sold for around 1800 pesos. However, it takes about 1 kilo of henequen to make 7 or 8 ropes, so the family only makes about 800 pesos [about 5 dollars at the then exchange rate] a day after they have paid for the “raw” henequen. The average family size, including children, in the village was between 5 and 6 individuals. 800 pesos a day is not much income to support the entire family!

The finished ropes are bought by the distributors, who in turn sell it on to other distributors in other places, and so on. The main markets are Mexico City, where about 90% of these ropes are eventually sold.

The workers in the rope-making industry in Villa Progreso have tried to organize themselves, but with only limited success. For example, three years before the interviews, they had formed a cooperative, but decided to quit the group when they realized that the managers of the cooperative also wanted part of the profits. So, at the time of the interviews, they had returned to working independently without any outside help.

Sales of rope fluctuate with the economy, and also seasonally, with the highest demand during the rainy season, partly because these natural fiber ropes tend to disintegrate more quickly during damp conditions.

The final stage, with finished ropes

The final stage, with finished ropes

As one student concluded, “It is very visible here how the middle men (distributors) take advantage of the cheap labor available and make a large profit by only buying and selling raw materials and by buying and selling finished products. thus, the distributors are getting richer by exploiting the workers and the workers are remaining as poor or getting poorer than before. The workers have been pulled into a situation that they can not easily escape from.”

How have things changed since the 1980s?

Sadly, I haven’t had the chance to return to Villa Progreso since then, but things appear to have changed considerably. Newspaper accounts such as “Artesanos dan nuevo aire al ixtle” (“Artisans give new life to Ixtle”), which appeared in the national daily El Universal in 2008, suggest that the residents of Villa Progreso are now emerging from some very hard times.

The price of natural fiber ropes could not compete with cheaper plastic alternatives and the rope-making industry went into near-terminal decline. Many of the able-bodied young men left to look for work north of the border. A small number (mainly the older inhabitants) remained home and continued to make ropes by hand for the limited market that remained for their products.

Now, though, a new industry has arisen based on the henequen fibers (usually known simply as ixtle). Enterprising villagers have turned their hands to fashioning nativity scenes and decorative items out of ixtle. Isaías Mendoza Guzmán is described in the article as making pieces that are more than two meters tall and take three months to complete, clearly indicating a high level of sophistication in the final product.

Villa Progreso now holds an Ixtle and Nopal Fair (Feria del Ixtle y el Nopal) towards the end of April each year in the La Canoa “ecotourism park”.

Villa Progreso is by no means the only place in Mexico where rope-making is an important activity. Similar rope-making methods are used elsewhere in Mexico. For example, John Pint describes in “Mexican artisans of Lake Cajititlán” how rodeo-quality lariats are made in the village of San Miguel Cuyutlán, near Guadalajara. Demand for these high-end products apparently remains strong.

Photo credit:

All photos in this post are by Tony Burton; all rights reserved.

How to get there:

Villa Progreso is about 10 km east of the town of Ezequiel Montes in Querétaro. From Mexico City, take the Querétaro highway (Hwy 57D) north-west to San Juan del Río. Then take Highway 120 past Tequisquiapan to Ezequiel Montes. Once in the town, turn right for the road to Villa Progreso. Allow 2.0 to 2.5 hours for the drive.

Related posts about the same general area:


Standard of living in Mexico since 1800: some international comparisons

 Other  Comments Off on Standard of living in Mexico since 1800: some international comparisons
Jun 232012
 

Comparing historical standards of living for different countries over long periods of time is extremely challenging. This post relies on data from Gapminder which has attempted to do this for all countries in the world since 1800. Their approach relies on quantitative and qualitative data from hundreds of references and a number of carefully documented assumptions. They obtained input from a very wide range of official and unofficial documents and combined these to come up with their best estimates. In some cases they admit that some of their numbers for years before 1950 are essentially well-educated “guesstimates”. [For more details, see “Documentation for GDP per capita by purchasing power parities” (pdf file).]

Though the Gapminder data have some limitations, they are about the best source for comparing standards of living in Mexico since 1800 with a number of other middle income countries. The measure of standard of living used in this post is the Gapminder indicator of Gross Domestic Product per capita (GDPpc) at constant 2005 US dollars based on Purchasing Power Parity (PPP) which measures total goods and services produced by an economy independent of exchange rates.

The data indicate that Mexico’s GDPpc has grown over eleven-fold since 1800 from over $1,000 to almost $12,000. This increase sounds very impressive but actually represents an average annual increase of under 1.2% per year. The eleven-fold increase demonstrates the power of compounding. The growth has not been constant. During the 19thcentury Mexico’s GDPpc actually decreased slightly up until 1870, but then expanded relatively rapidly under the Porfirio Diaz regime, almost doubling between 1870 and 1900. For the century as a whole it increased an average of about 0.5% per year. The rate of increase more than doubled during the first half of the 20th century to 1.2%. It doubled again to 2.5% during the second half of the 20th century, which included the so-called “Mexican Miracle”, which started in the 1940s. After 2000, as a result of the very severe recession in the USA, Mexico’s growth slowed to 0.6% per year for the period 2000-2011. Growth is expected to increase significantly during the present decade.

Income growth in Mexico since 1800 (Gapminder data) 

(Incomes values are at constant 2005 US dollars based on Purchasing Power Parity)

Country18001900195020002011Growth/yr, 1800-2011
Argentina8724,0116,32310,77114,5951.3%
Brazil5095981,9047,81910,1921.4%
Chile7022,3063,61210,10613,6111.4%
China9868024272,7847,9311.0%
Cuba1,124na4,9585,8249,4691.0%
India5635855881,6072,9720.8%
Indonesia5146046662,6273,9991.0%
Iran7501,3472,8168,26011,6661.3%
South Korea59667070815,69225,2561.8%
MEXICO1,0541,7223,07410,35911,7541.2%
Peru6979963,2895,7058,4201.2%
Russia824nana7,79214,3181.4%
South Africa759na4,7667,3349,2841.2%

The table compares the 1800 to 2011 GDPpc of Mexico with 12 other middle and low income countries. In 1800, Mexico was ahead of all other countries in the table except Cuba. By 1900, Argentina had moved past and its GDPpc was more than double that of Mexico. Argentina’s GDPpc growth rate for the 19thcentury was over three times that of Mexico. Chile also moved ahead of Mexico. On the other hand, Brazil grew very slowly at only about 0.2% per year during the century; it actually declined between 1870 and 2000. By 1900, its GDPpc was about equal to that of India and a third that of Mexico.

In 1800, China’s GDPpc trailed Mexico by only about 6.5%; but declined by about 0.2% per year during the 19thcentury when China’s economy seriously stagnated as a result of opium wars and numerous internal rebellions which took from 20 to 40 million lives. By 1900, China’s GDPpc was less than half that of Mexico. India, South Korea and Indonesia also grew very slowly during the century. Their GDPpcs went from about half that of Mexico to about a third. There was no Asian economic miracle during the 19th century.

By 1950, Mexico trailed Argentina, Chile, Peru, Cuba and South Africa. From 1900 to 1950, the GDPpc of Mexico grew by a respectable 1.2% per year; however Peru and Brazil grew twice as fast. At the other end, the Asian countries did rather poorly. For example, China’s GDPpc declined by an amazing 1.2% per year from 1900 to 1950, when the country suffered from competing warlords, a protracted civil war, and Japanese invasion. By 1950, China’s GDPpc was less than half of what it had been in 1800 and also was behind India and less than a seventh that of Mexico. From 1900 to 1950, India’s GDPpc grew by only 0.01% per year while Indonesia and South Korea did only marginally better. The mid 20thcentury wars were very damaging to the Asian economies.

By 2000, Mexico had almost caught up with Argentina and had surpassed Chile, Peru, Cuba and South Africa. While Mexico’s growth from 1950 to 2000 of about 2.5% per year was very impressive, Brazil grew even faster at 2.9% per year. South Korea’s GDPpc surged ahead by an amazing 6.4% per year during the second half of the 20th century; it increased over twenty-fold from about $700 to over $15,000. China also grew at a very impressive 3.8% per year posting over a six fold increase. These two countries recovered briskly after their numerous wars and kept moving ahead at a rapid clip.

During the years between 2000 and 2011, Mexico had the worst performance of the countries in the table, growing at only 1.6% per year. China grew over eight times faster than Mexico; India and Russia grew almost five times faster. The growth rates of the other Latin American countries in the table – Argentina, Brazil, Chile, Cuba and Peru – were over twice that of Mexico. However, the Mexican economy is closely tied to the USA where GDPpc grew less than half as fast as Mexico. As mentioned previously, Mexico is expected to grow briskly during the rest of this decade.

It is interesting to look over the full 211 year period from 1800 to 2011. Interestingly throughout the whole period the GDPpc of Iran slightly trailed that of Mexico. The gap between these two countries closed a bit during the 211 year period. As a result of its rapid surge in recent decades, South Korea grew the fastest at 1.8% per year; it moved from one of the poorest in 1800 to the richest in the table. Other solid growth rates were posted by Argentina, Brazil, Chile, Iran and Russia. The slowest growth occurred in India, at only 0.8% per year, followed by Indonesia and China at slightly less than 1.0% per year. However, these Asian countries are now growing considerably faster than the other countries in the table. Looking at income growth over the last two hundred years puts the current situation in perspective. It is interesting to speculate on what the next two hundred years will bring, something we will return to in future posts.

Related posts: