A small village in Mexico won a 2004 UN Development Prize

 Excerpts from Geo-Mexico  Comments Off on A small village in Mexico won a 2004 UN Development Prize
Jun 142010
 

Every two years, the United Nations Development Programme (UNDP) awards the Equator prize (worth 30,000 dollars) to communities that have shown “outstanding achievement in the reduction of poverty through the conservation and sustainable use of biodiversity.”

One of the winners of the 2004 Equator prize was the indigenous community of Nuevo San Juan Parangaricutiro, in the state of Michoacán. More than 340 communities, from 65 countries, were nominated for consideration by the Equator Prize jury. The seven winning communities were honored at a prize-giving ceremony held in conjunction with an international Biological Diversity Conference in Kuala Lumpur, in Malaysia.

The success of Nuevo San Juan Parangaricutiro (hereafter referred to simply as Nuevo SJP) is all the more remarkable since their community did not even exist prior to 1944.

That is the year when all the founding residents of Nuevo (New) SJP fled their homes in “viejo” (Old) SJP as the sizeable town was overwhelmed by the lava erupting from Paricutín volcano. Paricutín first erupted, completely unexpectedly, in the middle of a farmer’s field, on February 20, 1943. It is a sobering thought that only 61 years to the day before the prize-giving, the volcano literally did not exist.

A remarkable account of those early days is given by Simón Lázaro Jiménez, who recounts in his book, Paricutín: 50 Years After Its Birth, his adventures as a young boy as he fled with his parents for safety as their small village of Angahuan was bombarded with red-hot rocks and ash. Don Simón’s is the only first-hand account of any substance written by a native P’urépecha speaker.

The volcano finally stopped erupting in 1952, but only after completely destroying the village of Parícutin (note that the position of the accent has changed over the years) and the town of viejo SJP. All that is left of the latter today are a few broken-down walls and parts of the huge, old church that did a brave job of withstanding the compelling force of the lava as it overran the rest of the town.

The people who fled the volcano (many initially refused to leave, but were escorted to safety by armed soldiers) stayed with friends and relatives and in makeshift camps before finding permanent accommodation, but later in 1944, founded Nuevo SJP after a presidential decree gave them land formerly belonging to the hacienda of Los Conejos.

The new town had to be completely planned from scratch. A gigantic church was built to commemorate the miraculous survival of part of the Old San Juan church which formed a partial barrier to the lava flow. Little by little a new community evolved, fostered in part by the high degree of cooperation required for building a new town and working virgin land.

In 1977, motivated by the abuse of local forest lands by private concession holders, the campesinos of Nuevo SJP organized their own union for farming and forestry workers. In 1981, they began their own forestry industry, and now collectively own and manage more than 11,000 hectares of pine, oak and fir forest. Over the years, their business activities have diversified to include a saw mill, a furniture factory (which has won export orders from Belgium and Ireland), a plant making wooden moldings for export to the USA, avocado and peach orchards, a packing plant which makes its own cases, a Christmas tree plantation, eco-tourism cabins and a resin distillation plant, as well as a store for the bulk purchase and resale of fertilizers. A water bottling plant, to bottle spring water, is one of the community’s latest proposals.

The community’s website gives details of all these activities and includes a link to a furniture catalog for those interested in buying direct. All the wood used is certified as “Smart Wood” (coming from well-managed forests) by the Forest Stewardship Council.

Community decisions in Nuevo SJP are made on behalf of the 8,000 or so residents by a General Assembly of the 1,300 Comuneros (community representatives), which has met at least once a month since 1983.

The Equator Prize was awarded because the forest policies adopted by the community “have provided a boost to local incomes while ensuring that the resource base upon which the community depends is sustained for future generations.” In addition, “the community’s successes have spread well beyond their origins as these novel conservation and business practices have been widely adopted by other indigenous communities in Mexico.”

Nuevo SJP may not be very old, or very large, but it certainly has a really big heart!

For a more detailed account of the history of the volcano, and of the considerable architectural attractions of the village of Angahuan, including its superb church, read chapter 35 of Western Mexico: A Traveler’s Treasury (Sombrero Books 2013).

Original article, as published on MexConnect

Mexico’s Volcanic Axis is discussed in chapter 2 of Geo-Mexico: the geography and dynamics of modern Mexico. The sustainable forestry project of San Juan Parangaricutiro is examined in chapter 15.

Jun 112010
 

Compared to its very large and loud northern neighbor the USA, Mexico often seems like a rather minor country. But let’s take a closer look at Mexico’s major characteristics.

Mexico is among the world leaders in land size, population and economic production. These three criteria are a rational way of determining the world’s major countries. Mexico is the world’s 14th largest country in area, just behind the Congo and Saudi Arabia, but ahead of Indonesia and Libya. Mexico’s population in 2009 was about 109 million ranking it 11th in the world.  Russia (140 million) and Japan (127 million) were slightly ahead of Mexico. Trailing Mexico were the Philippines (92 million) and Vietnam (87 million).

The Gross Domestic Product (GDP) of Mexico in 2009 was about $1.5 trillion, behind Brazil ($2.0 trillion) and Italy ($1.7 trillion), but ahead of South Korea (S1.4 trillion), Spain ($1.4 trillion) and Canada ($1.3 trillion). These GDP figures are based on “Purchasing Power Parity” which illuminates distortions based on exchange rates. For example, if a hair cut of equal quality costs $20 in the USA, $5 in Mexico and $2 in China, the haircut is counted as a $20 contribution the GDP of each country.

Mexico is one of only six countries that are in the top 15 in all three categories. The other five countries in this select group are China, India, the USA, Brazil and Russia.

That Mexico is in this very select group makes a very strong case that it is indeed a major country on the world stage.

For more information about these and many other aspects of Mexico, consider buying Geo-Mexico: the geography and dynamics of modern Mexico and adding it to your library.

The cultural geography of Mennonite enclaves in Mexico

 Excerpts from Geo-Mexico  Comments Off on The cultural geography of Mennonite enclaves in Mexico
Jun 082010
 

Among the first Mennonite settlers were a group of more than 1300 families (about 9300 individuals) of German-Russian descent who arrived from Canada in 1922. They had been guaranteed tax concessions, freedom of worship and exemption from military service by President Obregón. At the time the Mexican government wanted to encourage more settlement in northern Mexico which had unrealized agricultural potential. After the Mexican Revolution, the large landowners in northern Mexico wanted to sell part or all of their vast holdings before the federal government forced the break up of their estates.

Mennonites bought 100,000 hectares for 600,000 pesos (8.25 dollars per acre) and started a colony near Ciudad Cuauhtemoc, west of Chihuahua city.  The group’s spartan lifestyle is reflected in their conservative dress habits and the fact that their villages (campos) are numbered, rather than named.  The people are taller than the average Mexican, speak German, and have northern European physical features. Today, about 50,000 Mennonites live in the Ciudad Cuauhtemoc area. They also founded colonies at Patos, in northern Durango state, and near Saltillo in Coahuila. Today, there are also several Mennonite villages far to the south, in Campeche.

Mennonite cheese

Mennonite cheese (queso menonita)

The landscapes of Mennonite areas in northern Mexico are very distinctive. They transformed desolate areas of semi-arid scrubland into prosperous farms.

Houses built of adobe on wood frames line the main street of each campo. These elongated street villages (about sixty in number) are totally different to the compact, nucleated villages found elsewhere in Mexico.  Surrounding the villages are large relatively flat fields divided into blocks by wide roads.

The Mennonite farming areas look more like parts of the US Midwest than Mexico. The farms are neatly kept and dotted with wind pumps used to raise water for irrigation. Tractors are common though horse-drawn buggies are also used. The main crops are wheat, oats, beans, corn and in some areas apples. The Mennonites are experienced dairy farmers and their most famous contribution to Mexican cuisine is the production and marketing of Chihuahuan cheese (queso menonita). It is a common sight to see Mennonite men selling their delicious cheese at major intersections in several of Mexico’s major cities.

See also:

The geography of Mexico’s religions is discussed in chapter 11 of Geo-Mexico: the geography and dynamics of modern Mexico.

Aguascalientes’ geopolitical romance and long road to Statehood

 Excerpts from Geo-Mexico  Comments Off on Aguascalientes’ geopolitical romance and long road to Statehood
May 312010
 

How did the State of Aguascalientes come to be so small, and sandwiched between much larger states?

Aguascalientes coat-of-arms

The area that is now the State of Aguascalientes was caught between the colonial jurisdictions of Jalisco and Zacatecas.  Prior to the Mexican Revolution it was considered part of Zacatecas, but after the War of Independence, in 1821 it gained status as its own political entity. This lasted only a few years. In 1824 it became part of the State of Zacatecas.

A decade later, in 1835, Zacatecas rebelled against the Federal Government.  General Santa Anna and his army squashed the rebellion, ransacked the City of Zacatecas and seized large quantities of the state’s silver. As payback for the rebellion, the Mexican Legislature separated the agriculturally-rich Aguascalientes Territory from the State of Zacatecas.

The more romantic version is that, “the independence of Aguascalientes was sealed with a kiss, as the locals are invariably quick to point out.”  (Tony Burton, Western Mexico: A Traveler’s Treasury). While quelling the Zacatecan rebels, General Santa Anna met the beautiful Doña María Luisa Villa, the wife of the Aguascalientes’ mayor. Santa Anna was very attracted to her and promised her anything for a kiss. He got the kiss and fulfilled her promise by making Aguascalientes an independent territory under the governorship of her husband, Pedro García Rojas. Hence, the lips on the state’s coat-of-arms!

Detail from Aguascalientes coat-of-arms (Note the lips!)

But Aguascalientes’ independence did not last long. In 1847, the national legislature revoked its independence and put it back into the State of Zacatecas. However, a few years later in 1853, Aguascalientes regained independent status. Finally, under the new Mexican Constitution of 1857, Aguascalientes became Mexico’s 24th state, with the colonial city of Aguascalientes as its capital.

Aguascalientes is a rather small state. Among Mexican states it ranks in the lower 20% in both areal size and population (about 1.2 million).  Most of the population (over 900,000) lives in the industrial Aguascalientes Metropolitan Area.  Locals claim that the Aguascalientes Nissan plant is the largest outside of Japan.

The evolution of Mexico’s political boundaries is discussed in chapter 9 of Geo-Mexico: the geography and dynamics of modern Mexico.

May 242010
 

The growth of Protestantism in Mexico has been rapid among low income groups, particularly in poor states and indigenous areas. Many of these gains are considered less a conversion from true Catholicism than a first time acceptance of a modern religion by people who previously adhered to Indian Folk Catholicism. Protestantism, and especially Pentecostalism, is thought to be compatible with indigenous values and spiritual practices. Some Protestant groups have specifically focused their proselytizing efforts in indigenous areas.

La Luz del Mundo, Guadalajara

The Mexican census divides non-Catholic churches into two groups. The first, “Protestant and Evangelical,” includes about 5% of Mexicans. The percentage varies from less than 2% in western Mexico to over 10% in southeastern Mexico. Pentecostal and Evangelical churches now make up 85% of this group. Dozens of Evangelical denominations have engaged in strong recruitment efforts since 1970, with considerable success in southeastern Mexico. In 2000, Protestants and Evangelicals comprised 14% of the population in Chiapas and Tabasco, 13% in Campeche, and 11% in Quintana Roo. The 2010 census is expected to show a significant increase in these percentages.  This group also includes Lutheran, Methodist, Presbyterian, Mennonites and Luz del Mundo, a Protestant denomination founded in Mexico.

The second non-Catholic group, “Biblical, not Evangelical,” is still rather small, but has grown very rapidly in the past two decades. It includes the Seventh Day Adventist Church, which is particularly popular in indigenous areas, as well as Jehovah’s Witnesses, which have so far had little influence in indigenous areas. Also in this group is the Church of Jesus Christ of Latter Day Saints (Mormons), which first arrived in Mexico in 1875.  Several English-speaking Mormon colonies were established in Chihuahua (Colonia Juárez is the most prominent today) and Sonora. As a result of impressive proselytizing efforts, Mormon membership surged from 248,000 in 1980 to 617,000 in 1990 and more than 1 million in 2005. Mexicans belonging to the Mormon Church have, on average, much higher incomes, higher rates of literacy and, interestingly, lower fertility rates than members of other churches.

The geography of Mexico’s religions is discussed in chapter 11 of Geo-Mexico: the geography and dynamics of modern Mexico.

Previous posts in this mini-series on the geography of religion in Mexico:

Is Mexico’s population evenly distributed?

 Excerpts from Geo-Mexico  Comments Off on Is Mexico’s population evenly distributed?
May 222010
 

No! Mexico’s population (mid-2010 estimate: 108,396,211) is not evenly distributed. Parts of central Mexico are very densely populated while there are relatively few people in the wide open spaces in northern Mexico. This is perhaps one of the most important features of Mexico’s human geography.

The Federal District and adjoining State of Mexico make up just over 1% of Mexico’s area, but house over 22% of the population for a density of 950 persons per km2.  A central band, including Mexico City, encircled by Guadalajara, Aguascalientes, Xalapa, Veracruz, Puebla, Cuernavaca and Morelia covers only 10% of the land but contains over half of all Mexicans and has a density higher than that of northeastern USA (between Washington and Boston), UK, Germany or Italy.

The other 90% of Mexico has 50 million people, more than any other Latin American country except Brazil. Population densities in those areas are low.

In conclusion, some areas of Mexico are indeed crowded, but most of Mexico is not.

See this earlier post for a visually dramatic cartogram depicting Mexico’s population distribution.

Mexico’s population distribution and population density are analyzed in chapter 8 of Geo-Mexico: the geography and dynamics of modern Mexico.

May 212010
 

Life expectancy in most European countries has increased steadily over the past couple hundred years at a rate of about 2.5 years per decade (25 years per century). In the developing world, the increase has been higher, between 3 and 5 years per decade.

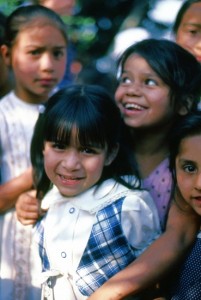
Children in Zitácuaro, Michoacán. Photo: Tony Burton. All rights reserved.

In Mexico, life expectancy in the 1930s was only 37 years. In other words, Mexican children born in the 1930s were only expected to live for 37 years. Of course, many lived far longer, but many died long before they reached age 37. Mexican life expectancy increased rapidly and was up to 54 years in the 1950s. It reached 64 by the mid 1970s and by the mid 1990s, was up to 74. Life expectancy in Mexico today is 77 years. Of course, women live longer than men: the life expectancy today is about 79 years for women and 75 years for men.

If Mexico continues to increase its life expectancy by 2.5 years a decade, today’s average Mexican newborn will have excellent odds of living to be 100 or more. Of course, to reach age 100, these Mexicans will have to avoid obesity and diabetes. Currently, Mexico ranks second to the US in rate of obesity among major countries and is first in rate of diabetes.

Actually, the common definition of life expectancy at birth is rather conservative. It assumes that as babies born in 2010 age, they will die at the same rate as all current cohort groups. For example when babies born in 2010 reach age 80 in 2090, they will die at the same rate as current 80-year-olds. Thus there is no allowance for advances in health care such as cures for cancer, Alzheimer’s, etc. With the current rate of genetic advances, improved cures and treatments for today’s fatal diseases are almost assured. Therefore, we expect the death rate of 80-year-olds in 2090 to be far less than the death rate for 80-year-olds in 2010.

Life expectancy at birth is discussed in chapter 9 of Geo-Mexico: the geography and dynamics of modern Mexico.

Western Mexico, Mexico’s Catholic heartland

 Excerpts from Geo-Mexico  Comments Off on Western Mexico, Mexico’s Catholic heartland
May 202010
 

As mentioned in an earlier post, Mexico is a predominately Catholic country. In 1980, 96% of Mexicans said they were Catholics; this dropped to 88% in 2000 and is estimated at about 80% in 2010. However, Catholicism seems to be maintaining its strength in Western Mexico.

Tzintzuntzan monastery and church. Artist: Mark Eager. All rights reserved.

In 2000, 96% of those in Guanajuato and Aguascalientes professed to be Catholic, followed closely by Jalisco, Querétaro, Zacatecas and Michoacán with 95%. Colima (93%) and Nayarit (92%) were not far behind.

The 1917 Constitution which followed the Mexican Revolution placed severe restrictions on the Catholic Church. It forbade churches from participating in primary and secondary education, it denied legal standing to religious marriages, and denied the right of church personnel to criticize the government or wear religious attire in public. These laws began to be rigorously enforced in 1926, stimulating the Cristero Rebellion by 50,000 armed devout Catholics in Western Mexico. This three year war cost 80,000 lives and reduced the number of priests in Mexico from 4,500 to only 334. Many Catholic leaders and followers immigrated to the USA.

Gradually, the severe restrictions were virtually all rescinded. In 1992 the government re-established diplomatic relations with the Vatican after over a century of estrangement. The last two Presidents of Mexico have come from the pro-Catholic PAN political party.

The geography of Mexico’s religions is discussed in chapter 11 of Geo-Mexico: the geography and dynamics of modern Mexico.

The decline of Catholicism in southern Mexico

 Excerpts from Geo-Mexico  Comments Off on The decline of Catholicism in southern Mexico
May 172010
 

The geography of religion in Mexico is changing quite rapidly.

Mexico is a predominately Catholic country, but is becoming less so with each passing decade.  In 1980 96% of Mexicans said they were Catholics; this dropped to 88% in 2000 and is estimated at about 80% in 2010. While the proportion non-Catholic is growing in all parts of the country, it is most apparent in southeastern Mexico.

In 2000, only 64% of those in Chiapas identified themselves as Catholics, fully 24% below the national average.  Other southern states were not far behind: Tabasco – 70%, Campeche – 71%, Quintana Roo – 74%; followed by Veracruz – 83%, Yucatán – 84% and Oaxaca – 85%.  Given existing trends, these percentages are expected to be considerably lower in the 2010 census.

About 10% of those in southern Mexico are classified as Protestant or Evangelical. Close to 10% are classified as having “no religion”, 13% in Chiapas. Indigenous language speakers and males were most likely to place themselves in this category.  The smallest, but fastest growing group in southern Mexico is the “Biblical, not Evangelical” group, which includes Seventh Day Adventists, Jehovah’s Witnesses, and Mormons.

The geography of Mexico’s religions is discussed in chapter 11 of Geo-Mexico: the geography and dynamics of modern Mexico.

May 152010
 

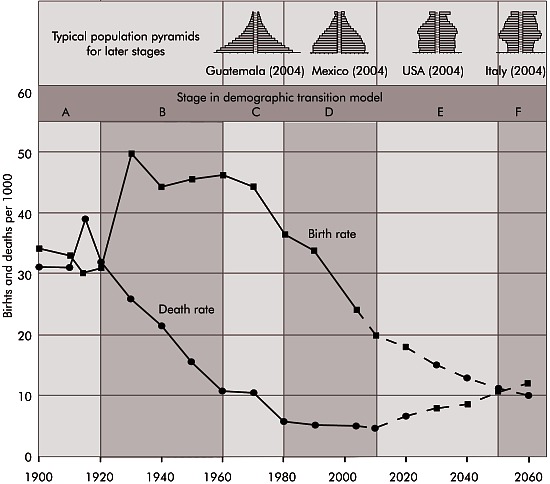
Mexico’s population exploded in the mid-20th century as death rates plummeted and birth rates remained high.  From 1940 to 1980, the number of Mexicans more than quadrupled from under 20 million to over 80 million.  In the 1960s and 1970s the population growth was among the world’s fastest at 3.3% a year.  At this rate, the population doubles in less than 22 years.

Mexico's birth rates, death rates and demographic transition

Concerns about overpopulation resulted in a massive planning program which included health professionals, multimedia advertising, and messages is telenovelas (serialized TV dramas) and historietas (comic books).  As a result of this campaign and the demographic transition (the drop in fertility rates with modernization observed in all countries), the average number of children per woman dropped dramatically from 5.7 in 1976 to about 2.2 in 2010.  Mexico’s population should peak at about 120–130 million in about 2045.  This is a fairly large spread because accurately predicting future rates of immigration to the USA is very tricky.

Mexico’s natural increase now is about 1.5%, but actual increase (including immigration/emigration) was closer to 1% in 2006, 1.3% in 2008 and will probably be down to 1% again by 2011.

Mexico’s National Population Council (CONAPO) has projected a fertility rate of 2.1 for 2010, but international sources estimate it to be between 2.2 and 2.3 in 2010.

Mexico’s population dynamics are the subject of chapter 9 of Geo-Mexico: the geography and dynamics of modern Mexico; the importance of telenovelas and historietas is discussed in chapter 18.

Markets in and near the city of Oaxaca

 Excerpts from Geo-Mexico  Comments Off on Markets in and near the city of Oaxaca
May 102010
 

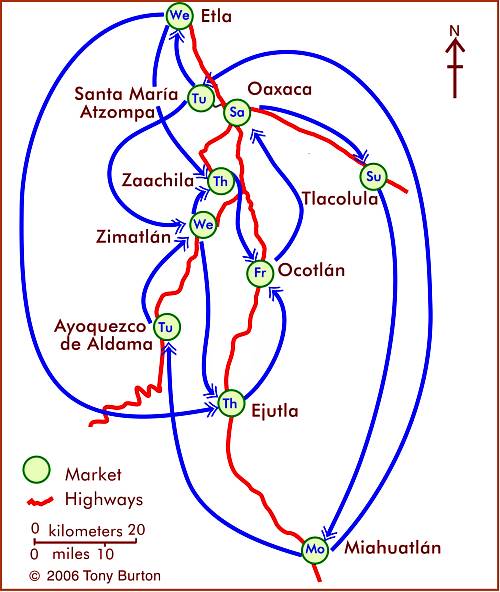
The southern state of Oaxaca is famous for its lively and colorful markets. Many villages have a weekly market, and it is possible to travel from one market to the next during a week in Oaxaca without ever visiting the same market twice.

The weekly cycle of markets in and around the city of Oaxaca, Mexico. Map: Tony Burton. All rights reserved.

This is not a coincidence, since it is precisely what many of the market vendors do every week in order to maximize the number of people exposed to their salesmanship and wares. This is related to an important concept in central place theory, that of the threshold population required to support a particular good or service.

Visiting even a single weekly market in Oaxaca is a fascinating way of experiencing first-hand some of the amazing cultural diversity of this  extraordinary state.

Click here for an interactive version of the map of markets in central Oaxaca. The geography of Mexico’s markets is discussed in chapter 24 of Geo-Mexico: the geography and dynamics of modern Mexico

Related article:

Oaxaca is the most culturally diverse state in Mexico

Oaxaca is the most culturally diverse state in Mexico

 Excerpts from Geo-Mexico, Maps  Comments Off on Oaxaca is the most culturally diverse state in Mexico
May 042010
 

The inter-census population count in Mexico in 2005 found that more than one million people in Oaxaca spoke at least one indigenous Indian language. Close behind came the state of Chiapas with about 950,000 indigenous language speakers.

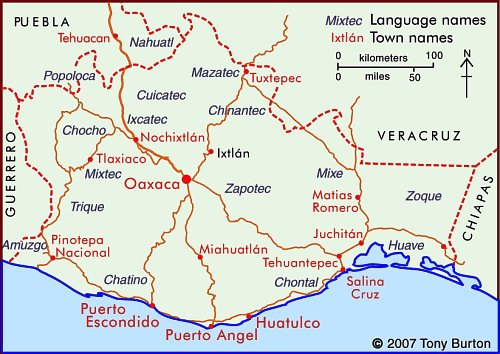
Indigenous Indian groups in the state of Oaxaca

In Oaxaca, according to the National Commission for the Development of Indigenous Peoples, more than 1.5 million people live in a home where at least one of the residents either speaks an indigenous language or considers themselves indigenous (even if they do not speak an indigenous language). This is 50% more people than are found in the same category in Chiapas.

Not only does Oaxaca have more indigenous people, it also has a much greater linguistic and cultural diversity than Chiapas or any other state in Mexico.

Oaxaca’s one million indigenous speakers represent 35% of the state’s total population. The largest indigenous linguistic groups in the state include about 350,000 Zapotec, 230,000 Mixtec, 165,000 Mazatec, 100,000 Chinantec, 100,000 Mixe, and 40,000 Chatino.

Almost 90% of Zapotec speakers also speak Spanish, which considerably enhances their education and employment opportunities. On the other hand, 23% of Mixtecs do not speak Spanish, and hence face a tougher challenge in the workplace. Tens of thousands of Mixtecs have migrated away from Oaxaca looking for work. Mixtec speakers tend to migrate to Mixtec-speaking neighborhoods; there are about 16,000 Mixtecs in Mexico City, 14,000 in Baja California, 13,000 in Sinaloa, and perhaps 50,000 in the USA. A sizable number of these migrants are essentially monolingual, with very limited Spanish.

The map shows the regions where the main indigenous groups in Oaxaca reside. One of the reasons for Oaxaca having retained such an extraordinary diversity of Indian groups is the state’s very rugged terrain, which has isolated numerous indigenous groups, cutting them off from mainstream Mexican society. This diversity of cultures helps to make Oaxaca one of Mexico’s most interesting states. The cultures find expression today not only in language, but also in modes of dress, handicrafts, music and dance. The state of Oaxaca celebrates its ethnic diversity in its annual extravaganza, the Guelaguetza festival, normally held in July.

Mexico’s cultural diversity is discussed in chapters 10 and 13 of Geo-Mexico: the geography and dynamics of modern Mexico.

This is an edited version of an article originally on MexConnect website.

The disparities in Mexico between indigenous peoples and the remainder of the population

 Excerpts from Geo-Mexico  Comments Off on The disparities in Mexico between indigenous peoples and the remainder of the population
Apr 292010
 

Most of Mexico’s indigenous population lives in small, isolated rural localities with under 500 inhabitants. These communities are very disadvantaged compared with other Mexican communities. About one-third of the nation’s 2442 municipalities are indigenous. However, almost half of all the municipalities defined by the National Statistics Institute (INEGI) as “highly marginalized” are indigenous, as are a whopping 82% of the “very highly marginalized” municipalities.

The incidence of extreme poverty is much higher in indigenous municipalities than in non-indigenous municipalities. Indigenous villages are among the nation’s poorest rural communities. Indigenous language speakers trail behind other Mexicans in virtually every socioeconomic indicator. About 33% are illiterate, compared to the national rate of only 9.5%. Most leave school prematurely to help their families earn a living.

Indigenous females get a year’s less schooling than indigenous males. They suffer from poor nutrition and their fertility rate is 40% higher than the national average, but 5% of indigenous infants die before reaching their first birthday. About 85% of indigenous household are below the Mexican poverty line and over half live in “extreme poverty”. Over one third of houses lack electricity and over half lack piped water. There is no question. Indigenous peoples have a far lower standard of living than other Mexicans.

Despite their extreme poverty, indigenous communities have managed to remain remarkably stable while collectively pursuing their relatively well organized survival strategies. Their belief systems and rich knowledge of nature remain largely intact. Over 90% of indigenous peoples own their homes and farm plots.

Mexico’s indigenous groups are the subject of chapter 10 of of Geo-Mexico: the geography and dynamics of modern Mexico; variations in the quality of life within Mexico are analyzed in chapter 29.

The geography of languages in Mexico: Spanish and 62 indigenous languages

 Excerpts from Geo-Mexico  Comments Off on The geography of languages in Mexico: Spanish and 62 indigenous languages
Apr 232010
 

Most people realize that the national language of Mexico is Spanish and that Mexico is the world’s largest Spanish speaking country. In fact, its population, now numbering 105 million, represents about one-third of all the 330 million or so Spanish speakers in the world. Spanish is the majority language in nineteen other countries besides Mexico, and is the world’s third most spoken language, after English and Chinese.

Far fewer people realize that, in addition to Spanish, another 62 indigenous languages are also spoken in Mexico. This makes Mexico one of the most linguistically diverse countries in the world, in terms of the number of languages spoken, behind Papua New Guinea, Indonesia and India, but well ahead of China, Brazil and just about anywhere else.

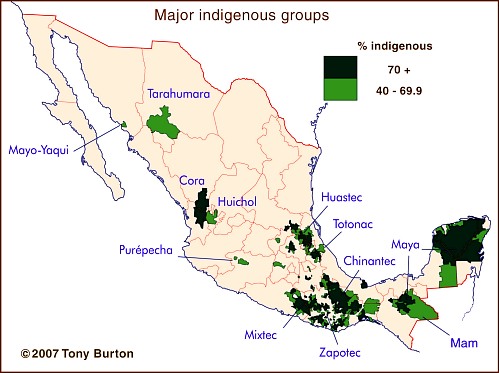
The major indigenous groups in Mexico

Some estimates put the number of different Indian languages in use at the time of the Spanish Conquest in the 16th century as high as 170. This number had dwindled to about 100 by 1900, and has continued to decline to the present day. The latest estimates are that at least 62 distinct languages (and 100 dialects) are still spoken somewhere in the country.

The largest indigenous groups are those speaking Nahuatl (2,563,000; dispersed locations, and therefore not shown on the map), Maya (1,490,000), Zapotec (785,000) and Mixtec (764,000), followed by those using Otomí (566,000), Tzeltal (547,000) and Tzotzil (514,000). Other well known groups include the 204,000 having Purépecha (or Tarasco) as their first language and the 122,000 speaking Tarahumara.

At the other end of the spectrum, only about 130 people still speak Lacandón and only 80 use Kiliwa. Only 60 people still use Aguacateco in Mexico and only 50 speak Techtiteco (or simply Teco), though both languages are spoken by several thousand Indians in neighboring Guatemala.

Of course, we shouldn’t forget that many Mexicans not only speak Spanish and/or an indigenous language, but also manage pretty well in English, French, Japanese and many others!

This is an edited version of an article originally published on MexConnect – click here for the original article

Indigenous languages and cultures are analyzed in chapters 10 of Geo-Mexico: the geography and dynamics of modern Mexico.

The importance of Mexico City’s International Airport

 Excerpts from Geo-Mexico, Updates to Geo-Mexico  Comments Off on The importance of Mexico City’s International Airport
Apr 132010
 

Mexico City’s Benito Juárez international Airport handled 26.2 million passenger movements last year, making it the world’s 43rd busiest terminal, according to the Airports Council International. In terms of flights, Mexico City airport was the world’s 30th busiest, with 366,000 take-offs and landings. For freight, it was the 48th largest in the world, with 376,000 tons of cargo going through it last year. The Airports Council International is a non-profit organization which serves as the “voice of the world’s airports”.

The numbers make Mexico City airport the most important in Latin America. The on-going modernization of Terminal 1 will expand the airport’s capacity to 32 million passenger movements a year. The airport has parking spaces for 6,514 vehicles, and is served by a metro line, city bus lines, and 1,485 licensed taxis (belonging to 7 different companies). The terminal is also served by 8 mid-distance bus lines, offering regular service to the cities of Córdoba, Cuernavaca, Pachuca, Puebla, Querétaro, Tlaxcala and Toluca.

Nationwide, of the roughly 50 million air passengers each year, about half are domestic and half international. Commercial air service started in Mexico in the 1920s. The main route was Mexico City–Tuxpan–Tampico–Brownsville, Texas. By the 1930s, flights were available to Los Angeles, Cuba, Guatemala and El Salvador. Jet services to USA and European cities started in the 1960s. The routes have expanded steadily and now connect Mexico’s 29 national and 57 international airports.

Mexico City’s airport accounts for about 35% of the national total number of passenger movements, followed by Cancún (10.5%),  Guadalajara (almost 9%), Monterrey (7.4%), Tijuana (5.3%) and Puerto Vallarta (Jalisco) and San José del Cabo (Baja California Sur) each with 3.6%.

International comparisons

Mexico averages about 370 air passenger movements per year per 1000 population, compared to 2430 for the USA, 1400 for Canada, 202 for Brazil and 179 for Argentina. While air travel is growing, it remains a distant third behind automobile and bus travel.

Mexico’s transportation systems, including airports, are discussed in chapter 17 of Geo-Mexico: the geography and dynamics of modern Mexico.

Cuisine has changed as Mexico has experienced a nutrition transition

 Excerpts from Geo-Mexico, Mexico's geography in the Press  Comments Off on Cuisine has changed as Mexico has experienced a nutrition transition
Apr 072010
 

Mexico has passed rapidly through a “nutrition transition”.

Ingredients for guacamole. Photo: Chef Daniel Wheeler. All rights reserved.

The traditional Mexican diet was based on corn and beans, supplemented by fruits and vegetables with relatively little meat and dairy products. Over a 15-year period the average Mexican ate 29% less fruits and vegetables and 6% more carbohydrates while consuming 37% more soft drinks. In fact Mexicans now enjoy the dubious distinction of being the world’s greatest consumers of soft drinks, downing 160 liters a year on average.

White bread is replacing tortillas, fast food is replacing home cooking.

This nutrition transition, together with a more sedentary lifestyle, fueled a “disease transition”, characterized by a shift from high mortality due to infectious diseases to high mortality from non-communicable chronic diseases.

To see how Mexico compares with other countries—USA, Spain, France,  Japan, Russia, Brazil, South Africa, China and India— in terms of eating habits, see this recent graphical comparison:  New York Times Business section article of April 3, 2010, entitled “Factory Food” Mexico’s per person consumption of vegetables is lower than any other country on the chart except South Africa. Mexico’s consumption of “processed, frozen, dried and chilled food, and read-to-eat meals” is lower than any country except China and India, but Mexicans make up for this with a consumption of “bakery goods” that is more than double that of any other country on the chart.

This post includes edited excerpts from chapter 28 of of Geo-Mexico: the geography and dynamics of modern Mexico. Buy your copy today!

Apr 052010
 

The soft drinks industry in Mexico is big business. Nationwide, there are about 250 bottling plants. Between them they produce some 300 million cases of soft drinks a year, worth about 15.5 billion dollars. The soft drinks industry may bring economic benefits to industrialists, but is is also related to public health issues. Public health experts link the rising consumption of soft drinks and processed foods in Mexico with the rapidly rising rates of obesity, especially childhood obesity, and of diabetes.

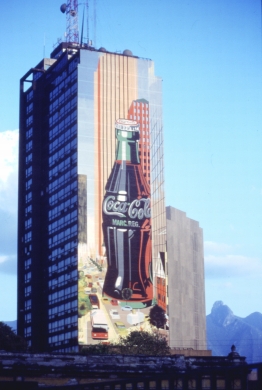
Possibly the world's largest Coca-Cola bottle, Monterrey, Mexico. Photo: Tony Burton. All rights reserved

Despite health concerns, the consumption of soft drinks in Mexico continues to rise. The per person consumption of soft drinks in Mexico has reached 160 liters a year. This means Mexico has overtaken the USA to become the world’s leading consumer of soft drinks on a per person basis, according the the Health Commission of Mexico’s Chamber of Deputies. In terms of total volume of sales, Mexico is second to the USA.

The Commission alleges that Mexico has become a “paradise” for food and drink processing firms offering products with little or no nutritive value. Alarmingly, the highest rates of increase in soft drinks consumption are in the poorer parts of the country.

A National Nutrition Survey in 1999 of 23,000 households revealed startling increases in the number of people in Mexico classified as either overweight or obese. These two categories of over-nutrition are measured by calculating the body mass index, a measure of weight adjusted for height. The percentage of women considered obese rose 160% between 1988 and 1999. In 1999 59% of women and 55% of men were either overweight or obese; by 2008 the figures were 64% and 60% respectively. Only the USA has higher rates of obesity. Even more alarmingly, the rate of childhood obesity in Mexico is also increasing rapidly. A 2002 study found that 30% of elementary school children in Mexico City and 45% of adolescents were either overweight or obese.

The increase in over-nutrition has led to rapid rises in diet-related chronic diseases such as diabetes and cardiovascular disease. The overall effects of diseases on a country’s population can be assessed by working out the disability-adjusted life years (DALY), the years of expected life lost through disease or premature death. In Mexico, the DALY lost to diseases normally thought to be more typical of the developed world such as diabetes, heart attacks and strokes is estimated to be three times greater than the DALY stemming from childhood and maternal under-nutrition.

Mexico has the highest rate of diabetes in the world, more than 11%.9 The total number of patients diagnosed with diabetes has risen seven fold since 1990. Diabetes is now the leading cause of death and costs the country more than $300 million annually, one-third of the public health care budget.

This post includes an edited excerpt from chapter 28 of of Geo-Mexico: the geography and dynamics of modern Mexico. Buy your copy today!

Mar 112010
 

Some of Mexico’s key population indicators are listed below, with the latest estimates of the 2010 values for each indicator:

  • Total population –  108.4 million
  • Crude birth rate  – 17.8 / 1,000
  • Crude death rate – 5.0 / 1,000
  • Natural population growth rate – 1.28%/yr
  • Infant mortality rate – 14 / 1,000 live births
  • Total fertility rate – 2.1 children per woman of reproductive age
  • Life expectancy – 75 years (male  73 ; female 78)

Table 9.1 of Geo-Mexico: the geography and dynamics of modern Mexico provides values for each of these indicators for the period from 1900 to 2000 inclusive, together with estimates (projections) for the period from 2010 to 2050.

Click here for a post about Mexico’s population age-sex pyramids for 1990, 2010 and 2050.

Can Mexico’s industry compete with China?

 Excerpts from Geo-Mexico  Comments Off on Can Mexico’s industry compete with China?
Feb 262010
 

In recent years, Mexico has faced increased competition in world markets from China and other Asian countries. Mexico’s contribution to US imports peaked at about 12% in 2003 but has since fallen to around 10%. Chinese imports to the USA overtook Mexican imports in 2003 and now account for 15% of the total market.

According to Mexico’s central bank, Mexico’s lost market share between 2001 and 2005 was worth $27 billion, equivalent to 15% of all non-petroleum exports. Some multinationals closed their assembly facilities in Mexico and moved them to China.

What are China’s advantages?

The two most important ones are wage rates and the much larger local market. The average hourly wage for manufacturing in China is $0.66, compared to $2.13 in Mexico. China also offers more incentives for foreign investment. The companies that have moved are manufacturers of textiles, electronic items and auto-parts; these footloose industries do not have complex and expensive plants (unlike steelworks and chemical plants for example) and can therefore relocate relatively easily. While most have relocated in China, some have preferred South Korea or India.

What are Mexico’s comparative advantages over China?

Mexico’s major advantage is proximity to the US market. Shipping a standard 40-foot container from Mexico to the USA costs less than half the cost from China. Mexico also has a more educated workforce, with about one-quarter of the population having completed secondary education, compared to less than 17% in China. The productivity of Mexico’s workforce is slightly higher than in China, and the country also retains a slight edge over China in terms of its legal system. In an effort to stem the outflow of jobs, the Mexican government has opened several high-tech industrial parks, such as Silicon Border in Mexicali, and these appear to be having some success.

[Excerpt from chapter 20 of Geo-Mexico: the geography and dynamics of modern Mexico.]

Feb 222010
 

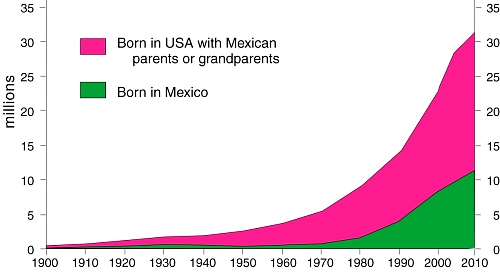
Mexicans have a long history of working and living in the USA. Migration is one of the most important linkages between North America’s two most populous countries. The Mexican diaspora in the USA is an integral part of both Mexican and US society. Each year roughly 250 million legal border crossings are made, about half by Mexicans. A much smaller number, perhaps a few hundred thousand, cross the border illegally despite US efforts to tighten border controls. The Mexican communities on either side of the border are very closely linked.

Mexicans in the USA
As of 2008 over 31 million Mexicans lived in the USA (see graph). This is more than one fifth of all Mexicans anywhere and a larger number than in any single Mexican state. Almost 19 million Mexican-Americans were born in the USA of Mexican parentage; these have always outnumbered migrants.

Roughly 10% of everyone born in Mexico now lives in the USA. This figure was only 5% as recently as 1990 and only 1.4% in 1970. Migrating Mexicans are as likely to move to the USA as within Mexico. Clearly, in recent decades, an increasing number of Mexicans have chosen to live in the USA.

[Extract from chapter 27 of Geo-Mexico: the geography and dynamics of modern Mexico]

Jan 032010
 

There are more females than males in Mexico. In fact, there are 94.8 men for every 100 women in the country.

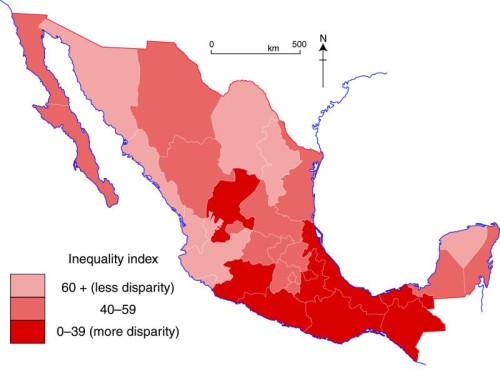
The map below shows gender inequality, using a composite gender inequality index based on the state rankings for three variables: difference in literacy rates between male and females, differences in rates of economic participation and the percentage of municipal leaders who are female. (Data sources are listed below)
map of gender inequality in Mexico
The overall pattern of gender disparity is quite similar to the pattern for female quality of life, but there are some anomalies. Southern states are those where both the quality of life for females and the gender disparities are greatest. However, while females living in the three states comprising the Yucatán peninsula have a comparatively low quality of life, the gender disparities in those states are relatively low. On the other hand, while the quality of life in and around Mexico City is quite high for females, the level of disparities in central Mexico remains considerable.

Gender inequality is not an intangible aspect of life. Figures show that there are significant differences in the median wages of male and female employees in every subsection of the workforce with the exception of skilled technicians where females’ median wages are fractionally higher. For instance, the median wage for female teachers is 91.2% that for men; for professionals, 82.7%; and for industrial supervisors 66.9%… (extract from chapter 29 of Geo-Mexico)

Sources of data for composite index:

Literacy: (Instituto Nacional de Estadística y Geografía) 2000 XII Censo General de Población y Vivienda. 2000. Aguascalientes, Mexico: INEGI.

Economic participation: INEGI-STPS 2001 Encuesta Nacional de Empleo, 2001. via .inegi.org.mx/ [13 April 2009]

Female municipal presidents: INAFED 2002 Resumen nacional de la filiación política de los presidentes municipales de México. http://www.elocal.gob.mx/
work/resources/LocalContent/9523/1/filiacion.htm.orig [15 April 2009]