The finances of Mexico’s Knights Templar drugs cartel

 Mexico's geography in the Press  Comments Off on The finances of Mexico’s Knights Templar drugs cartel
Feb 272014
 

A series of press reports over the past six months has shed interesting light on the variety of ways in which the Knights Templar cartel raises funding and manages its finances. The Knights Templar stronghold is the city of Apatzingan in Michoacán, but the cartel now operates in several states, including Guerrero.

Raising money:

1. Citrus and avocado production and exports

In January 2013, Alberto Galindo, spokesman for the Plan de Ayala National Movement, one of the largest organizations of Mexican farmers, claimed in a press interview that Mexico’s avocado farmers “have data that prove that 225 million pesos [17 million dollars] is the amount extorted by the drug cartels in Michoacán” each year. Citrus growers are also subject to regular extortion by the Knights Templar. We reported on avocado “protection money” back in 2012, and on the plight of citrus farmers in 2011.

2. Iron ore mining and exports

The Knights Templar levy “passage fees” on every ton of iron ore leaving mines in Michoacán for the port of Lázaro Cárdenas. In addition, they are alleged to have confiscated shipments of iron ore and then exported it themselves. They are also alleged to have funded illegal mining operations where iron ore is mined without the requisite environmental permits.

In response, the Mexican government has tightened the regulations for iron ore exports, which now require exporters to demonstrate that all ore being shipped has been mined legally. The main market for Michoacán iron ore is China. It is no coincidence that ore exports to China have quadrupled in the past 5 years. The federal government also ordered the military to take over the administration of the port of Lázaro Cárdenas to put an end to corrupt practices and sever this major source of funding for the Knights Templar.

The discussion related to cartel financing via iron ore exports has implicated several transnational firms who are said to have paid the Knights Templar to allow iron ore shipments from their mines to the port. Michoacán supplies about 25% of all the iron ore mined in Mexico, and about 1 million ha (almost 20% of the state) have been given in concession to transnational mining firms such as Mittal Steel, Ternium (Italy-Argenina), Minera del Norte (a subsidiary of AHMSA) and Pacific Coast Minerals.

Claims, such as those reported here and here, that Minera del Norte paid the Knights Templar $2 dollars/ton to move 10,000 tons of iron ore a week from its four mines in the Tepacaltepec region, have been categorically denied recently by the company’s Communications and Public Relations Director, Francisco Orduña Mangiola. In an e-mail to Geo-Mexico, Orduña writes that his company “has never paid any amount of money to criminals”. He points out that, “On the contrary, it was precisely our Company that denounced the illegal operations of criminal groups in iron ore deposits owned by our company and other companies in the area, from which those groups extracted iron ore that was subsequently exported illegally to China. It was reported to federal, state and military authorities… and this action ultimately resulted in the confiscation of large amounts of illegal minerals in the ports of Lázaro Cardenas and Manzanillo. It is important to say that our company does not export iron ore, and that the lump iron ore extracted in mines located in the Pacific Coast is sent by railway directly to Monclova, Coahuila, and used as a raw material in our steel facilities.”

3. Port traffic and operations

A levy of up to 10% on goods passing through the port of Lázaro Cárdenas.

4. Miscellaneous money laundering activities

Purchase and sale of property, vehicles, cattle, textiles (imported from China and sold in Guanajuato after being relabelled with major brand names), truck tires, etc.

5. Extortion payments

Extortion payments received from truck drivers, gas stations, grocery stores, bars, restaurants, pharmacies, car lots, and even direct from municipalities (in exchange for “permitting” municipal works related to drainage, street lighting, paving). The rise of self defense groups was partially due to citizens’ outrage at the various extortion payments demanded by the Knights Templar.

6. Shipments and sales of drugs (as far away as California and Texas), many of them supplied via the port of Lázaro Cárdenas.

Summary of Knights Templar income from illegal activities [dollars a month]

  • drugs, weapons, kidnapping, pirated items, vehicle thefts, etc: $2.8 million
  • extortion rackets, $1 million
  • extortion of municipalities, $1.1 million
  • investments in real estate, vehicles, textiles, electronic items, etc., $1.3 million

The port of Lázaro Cárdenas was key to the Knights Templar financial plans, and effectively served as the cartel’s “gigantic central bank”, capable of supplying an endless stream of funds to the cartel. It remains to be seen how effectively the government decision to put the military in charge of administering the port will destroy the ability of the Knights Templar to raise funds to support their illegal activities.

Where does all this money go?

Part of it goes on bribing officials. According to an investigation published in Milenio, a national daily, the Knights Templar cartel is believed to spend $2 million a month in bribing officials in the state of Michoacán, and a further $400,000 a month in other states. The Milenio articles were based on an official intelligence report that their journalists were given access to for a few hours.

Sample payments made to officials range from up to $26,000 a month to a federal police commander in an important city to $19,000 a month to officials in the prosecutor’s office and $18,000 a month to a state police commander. Officials in smaller cities and local administrations are paid less.

Recipients of drug cartel money also include journalists, with some print journalists receiving $3,000 a month and payments of about $2000 a month to a TV executive.

Related posts (chronological order):

The pattern of farm sizes in Mexico: is there a north-south divide?

 Other  Comments Off on The pattern of farm sizes in Mexico: is there a north-south divide?
Feb 242014
 

In 2007, INEGI census recorded 2.4 million “units of production” (farms) under 2 hectares in size. This number is 43.5% of all farms, and includes farms not being actively worked. 22.9% of farms were between 2 and 5 hectares in area and a further 23.4% between 5 and 20 hectares. In sum, almost 90% of all farms had an area of 20 hectares or less. At the other end of the size spectrum, 2.2% of farms were larger than 100 hectares.

In terms of land tenure, 68.5% of all farms were in ejidos (a form of collective farming), 28.5% held privately and the remaining 3% were other (communal, public, mixed). Almost three-quarters of all farms under 20 hectares in area are ejidos, whereas about three-quarters of all farms over 100 hectares in size are private.

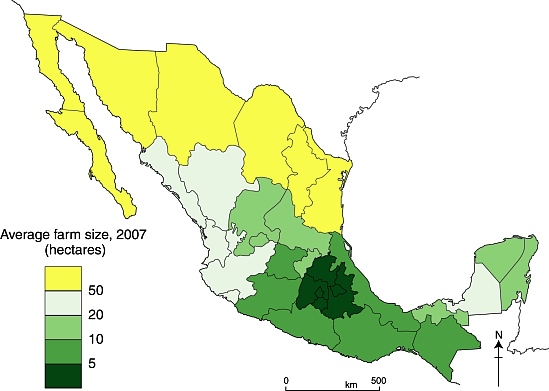
Map of average farm size in Mexico, by state, 2007

Map of average farm size in Mexico, by state, 2007. Data: INEGI. Credit: Tony Burton/Geo-Mexico

The choropleth map (above) shows the average size of farms (in hectares) by state. It is very clear that larger farms are concentrated in northern Mexico. All the states along the US border have average farm sizes in excess of 100 hectares. At the other extreme, a ring of states in central Mexico (centered on the Federal District) have average farm sizes that are below 5 hectares. The average farm size is slightly larger to the south of that ring of tiny farms, and significantly larger towards the east, including those states comprising the Yucatán Peninsula.

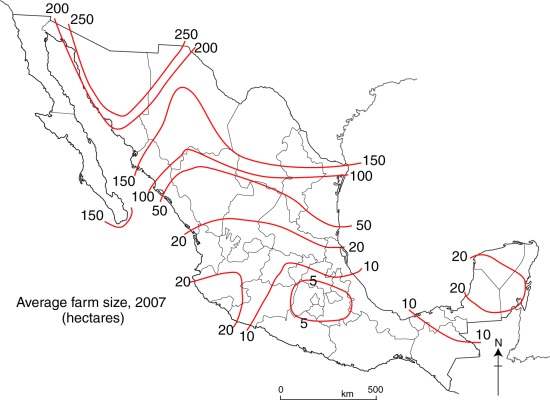
The general pattern is of a north-south division, which becomes even clearer when the average farm sizes are plotted as an isoline map. With minor exceptions, the “surface” represented by these isolines slopes steeply away form the highest values in north-western Mexico towards the south-east.

Average farm size in Mexico

Average farm size in Mexico. Data: INEGI Credit: Tony Burton / Geo-Mexico

Classroom exercise

Having recognized this pattern in farm sizes, can you think of reasons that might explain it? The short answer is that farm sizes vary in response to a multitude of factors, These include historical, demographic, and socioeconomic factors as well as relief, climate, natural vegetation and soils.

Q1. Compare the maps in this post with maps for some of the factors you think might be important. (Try our Geo-Mexico Map Index as a starting point). For example, the northern area of Mexico, the area with largest farms, is primarily semi-arid or arid. Why might farms in arid and semi-arid areas be larger than in other areas?

Q2. Have a class discussion about the relative importance of the factors that have been identified or suggested.

Q3. Discuss the relative merits of the two mapping methods used in this post (choropleth and isoline) to portray average farm sizes.

Related posts:

Geo-Mexico has many other agriculture-related posts (easily found via our tag system). They include posts about the geography of growing/producing Christmas trees, cacao, honey, sugarcane, coffee, chiles, floriculture, tomatoes, tequila, horticultural cropsand oranges. Also worth reading are:

Mexico and US agree to work together to fight trans-border wildfires

 Mexico's geography in the Press  Comments Off on Mexico and US agree to work together to fight trans-border wildfires
Feb 222014
 

Mexico’s National Forestry Commission (Comisión Nacional Forestal, Conafor) and the US Forest Service have signed an agreement aimed to ensure more efficient fire-fighting when dealing with wildfires on the border of Sonora/Arizona. The agreement, the Bi-national Convention on Forest Fires (Convenio Binacional de Incendios Forestales) is designed to increase public safety on either side of the border, reduce habitat loss, and facilitate the exchange of information about wildfires, leading to improved preventative measures and firefighter training.

The Convention establishes that when a fire is detected in the municipalities of Nogales, Naco, Agua Prieta or Santa Cruz, a united bi-national command can be established to ensure effective collaboration between the two countries’ firefighters. Firefighting brigades, together with supporting vehicles and aircraft, will be authorized to cross the border by up to 16 km (10 miles) in either direction when battling wildfires, provided they give prior notice to the relevant migration, security and customs agencies in the country concerned.

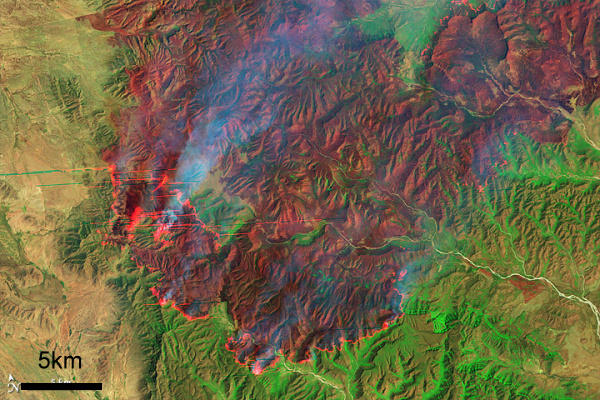
Coahuila wildfire, April 9, 2011 (Earth Observatory, Landsat-5)

Coahuila wildfire, April 9, 2011 (Earth Observatory, Landsat-5)

Mexico’s worst ever year for forest fires was in 1998, when 14,400 were recorded. In the past three years, 2011 was easily the most disastrous in terms of wildfires, with more than 12,000 fires reported:

  • 2011 – 12,113 fires, affecting  956 square km
  • 2012 –  7,170 fires, affecting 347 square km
  • 2013 – 10,406 fires, affecting 413 square km

In 2013, 99% of wildfires were attributed to “human actions”, with 36% of all fires resulting from deliberate agricultural burn-offs getting out of control.

The main wildfire season is from February to May each year. May is the critical month because it marks the end of the dry season in most of Mexico, the time when the natural landscape looks parched. During May, as the landscape waits for the start of the rainy season, precursor electrical storms are relatively common. Electrical storms can easily trigger wildfires if they ignite the tinder-dry vegetation.

Related posts:

Mexico City’s Ecobici cycle rental system enters its fifth year

 Mexico's geography in the Press  Comments Off on Mexico City’s Ecobici cycle rental system enters its fifth year
Feb 202014
 

Mexico City’s Ecobici system for public bike rentals in and around the city’s historical center celebrated its fourth birthday in February 2014. The system, established in 2010, currently has more than 60,000 24,000 registered users; between them they have already surpassed 13.5 million short trips by Ecobici. City officials calculate that the system has saved 499 metric tons of CO2 since 2010.

Ecobici bike rack
Annual membership currently costs 400 pesos (about 31 dollars). It is also possible to buy membership for a single day (90 pesos), three days or by the week. The system is intended for short trips. With membership, the first 45 minutes of each ride is free.

There are 275 Ecobici cycle stations and 4,000 Ecobici bikes in circulation. The current level of usage is 25,000 trips each day. The average trip distance per ride is 8 kilometers (5 miles), the average trip time is 20-25 minutes; 80% of users are male, and the average ride saves 7.5 kg of atmospheric emissions. Four out of five riders start or end their trip with a ride by bus, taxi, car or metro. City authorities intend to add Ecobici to the Tarjeta Ciudad travel card that can be used to pay for other forms of city transport including the Metro and Metrobús networks.

Is there a down side?

Criticisms of Ecobici have been relatively minor. Initially, some riders complained that the cycle racks were sometimes completely full, meaning they had to cycle to an alternative cycle station where there was space to leave their bike, or that a cycle rack had no bikes to rent, in which case they had the inconvenience of finding another cycle station that did have bikes. Ecobici’s organizers regarded these issues as normal “teething problems” for any system of this scale, and this sort of complaint is now unusual. Authorities hope to implement a system at some point in the future which allows users to receive, via cell phone, real-time information about where bikes are available.

Other road users have complained that some of the Ecobici riders ignore traffic rules by, for example, cycling the wrong way down one-way streets, increasing the chance of an accident.

Area served by the Ecobici system

The 21 square kilometer area served by Ecobici includes the Historic Center of Mexico City and the following neighborhoods (colonias) in the Miguel Hidalgo and Cuauhtémoc districts (delegaciones):

  • Anzures
  • Condesa
  • Cuauhtémoc
  • Escandón
  • Guerrero
  • Juárez (including theZona Rosa)
  • Polanco
  • Roma Norte
  • Roma Sur
  • San Miguel Chapultepec
  • San Rafael
  • Tabacalera

Expansion plans

The city government is now expanding the system by 14 square kilometers into the Benito Juárez district, where 171 new bike stations will be located in 22 neighborhoods, including Del Valle and Narvarte. The new cycle stations being installed allow allow casual users and tourists to pay for each individual trip by credit card.

Related posts:

Mexico’s drug cartels and their areas of operation, a 2014 update

 Mexico's geography in the Press, Updates to Geo-Mexico  Comments Off on Mexico’s drug cartels and their areas of operation, a 2014 update
Feb 172014
 

As noted in previous updates on Mexico’s drug cartels and their shifting areas (and methods) of operation, it is becoming ever harder to keep up-to-date with the geography of drug cartel territories. The current federal administration has deliberately limited the amount of hard data relating to drug violence published on government sites or in Mexico’s mainstream press. While this may help to reduce public unease at the levels of drug-related crime, it also means that it has become much harder to analyse the situation and determine overall patterns and trends.

The 2013 UN Global Report on Drugs estimates that Mexico is Latin America`s largest drugs producer, making 30 times more heroin than Colombia. The report also cites statistics showing that more methamphetamine are confiscated in Mexico than in the rest of the world combined.

Previous updates:

The main players  (February 2014) are:

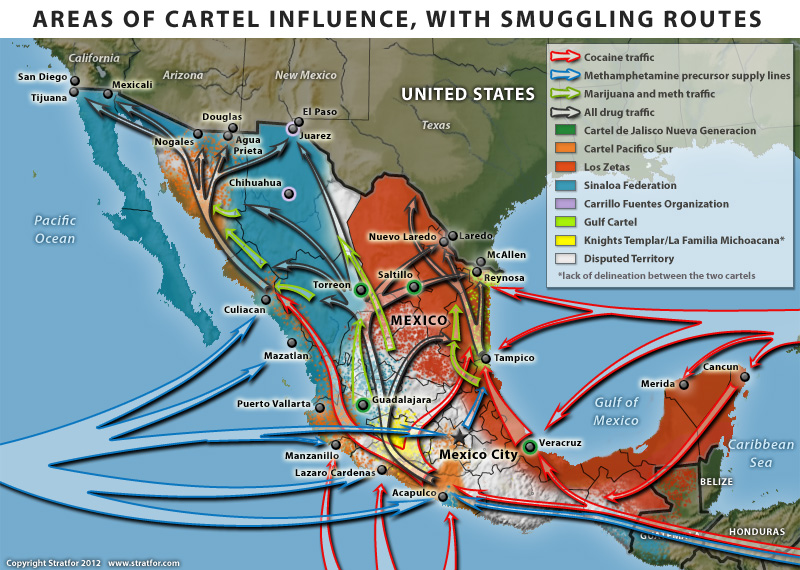
  1. Los Zetas, operating in more than half of Mexico’s 32 states (more territory than their main rivals the Sinaloa Federation), and prone to extreme violence. They have branched out into human trafficking and extortion to support their drug smuggling operations. They control much of eastern Mexico. Even the capture of their top leader in 2013 does not appear to have significantly weakened their internal cohesion.
  2. Sinaloa Federation, which remains in control of most of western Mexico, and increasingly specializes in the production of methamphetamine. The cartel is led by Joaquín “El Chapo” Guzmán, whose estimated personal net worth exceeds $1 billion dollars according to Forbes magazine. Guzmán escaped from a high secrutiy jail in 2003 but was recaptured in Mazatlán in February 2014.
  3. Gulf Cartel, still important along Mexico’s Gulf coast, but weakened due to infighting, captures of leaders, and conflicts with Los Zetas.
  4. Knights Templar (Los Caballeros Templarios), started in 2010 by former members of The Michoacán Family (La Familia Michoacana), and which now controls much of the drug-related activity in Michoacán and Guerrero. They are in near-constant conflict with the Jalisco New Generation Cartel (based in the neighboring state of Jalisco) which has resulted in continued violence along the Jalisco-Michoacán border.

Smaller, regional players:

  1. Tijuana Cartel, operating in the city of Tijuana on the Baja California/California border.
  2. Juárez Cartel, now largely limited to Cd. Juárez and the border with Texas. Mexican federal police say this group now calls itself the New Juárez Cartel (Nuevo Cartel de Juárez).
  3. Jalisco New Generation Cartel (Cartel Jalisco Nueva Generación), based in the state of Jalisco and thought to operate as enforcers for the Sinaloa Federation
  4. Cartel del Pacífico Sur; weak, and competing with Zetas, mainly in the central Mexico state of Guerrero
  5. Independent Cartel of Acapulco, small and apparently declining in importance

Splinter groups (see below):

  1. Sangre Z
  2. Golfo Nueva Generación
  3. La Corona
Cartel areas and drug routes in Mexico

Cartel areas and drug routes in Mexico, 2012. Copyright Stratfor. Click map for enlarged version

Recent changes (2013-2014)

Early in 2013, Mexico’s National Security Cabinet revealed the emergence of several new drug trafficking organizations. The new groups–Sangre Z, Golfo Nueva Generación, and La Corona– are splinter groups from Los Zetas, the Gulf Cartel, and the Sinaloa Federation respectively. The new groups formed in response to the arrest of key operatives in the large cartels. These new groups are reported to be well equipped and well-armed, generating revenue through drug trafficking and by levying protection payments on other drug traffickers who pass through their turf on their way to the USA..

In 2013, the situation in the western state of Michoacán became particularly unstable with drug-related violence (shootouts, roadblocks and the torchings of vehicles) perpetrated by the Knights Templar in many parts of the state. The town of Apatzingan in the Tierra Caliente region of Michoacán is the main bastion of the Knights Templar organization. The increased violence resulted in the well-publicized rise of civilian “vigilante” militia groups (community self-defense groups), prepared to take on cartel members in direct combat in their efforts to reduce the incidence of extortion, kidnappings and other crimes. Self-defense groups sprang up in more than 30 municipalities in Michoacán including at least 15 of the state’s 113 cities. Places with self-defense groups included Buenavista Tomatlan, Coalcoman, Tepalcatepec, Los Reyes, Aquila, Paracho, Cheran, Tancitaro, Paracuaro and Nueva Italia.

For a good summary account of the struggle between the Knights Templar and the vigilantes, see Mexican Vigilantes Beat Back Ruthless Knights Templar Cartel by journalist Ioan Grillo. We will take a closer look at the Knights Templar in a future post.

In recent months, in the wake of drug gang attacks on gas stations and electricity facilities in Michoacán, the federal government has stepped up its attempts to resolve the security problems in the state. In some places, it has replaced city officials and local police forces en masse. In the important Pacific Coast port of Lázaro Cárdenas (a main port of entry for the chemicals used for methamphetamine production, and a main export port for minerals, one of the more lucrative sources of income for the Knights Templar), the federal government sent in the military to administer the port.

In their efforts to curb the rise of civilian militia groups, the federal and state governments have announced a scheme which allows militia members to register to join new, state-controlled Rural Protection Forces (RPF). As of early February 2014, about 500 “self-defense” members had already registered to join the RPF.

The federal government has also announced the creation of a 3.5-billion-dollar purse to support 250 specific actions in Michoacán designed to reactivate the state’s economy, reinforce security and aid its social assistance programs.

Related posts (chronological order):

Feb 152014
 

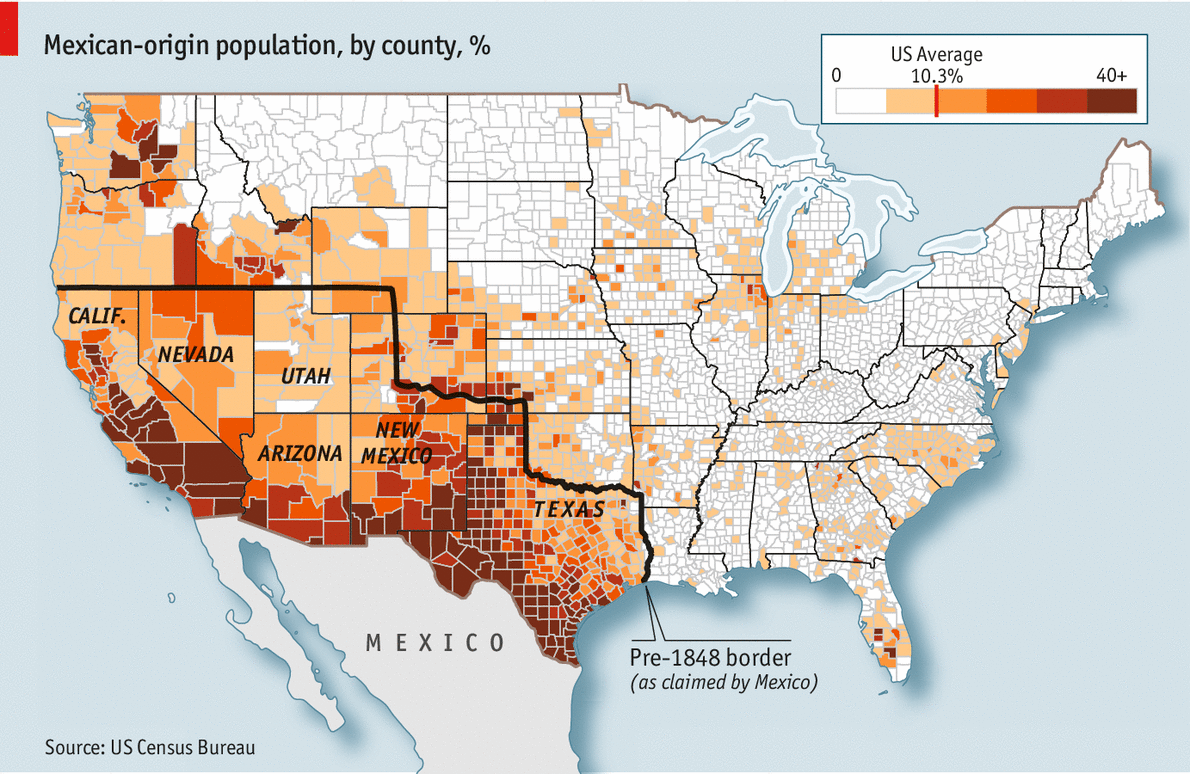
Kudos to The Economist for its short piece entitled “Old Mexico lives on” in which it points out that Mexicans and their descendents are gradually reoccupying the territory that the USA gained from Mexico in the nineteenth century. The evidence is provided by the map (below) showing “Mexican-origin population” by county for the USA. The definition is by ethnicity (origin), not citizenship.

Mexican-origin population living in USA. Source: Economist, 1 Feb 2014.

Mexican-origin population living in USA. Source: Economist, 1 Feb 2014. Click to enlarge.

In February 1848, Mexico was forced to cede more than half its territory to the USA. The area handed over included most of present-day Arizona, California, Nevada, New Mexico and Utah, plus parts of several other states. (Texas had declared its independence from Mexico in 1836).

Note the close correlation between areas that were part of Mexico prior to 1848 and those that now have the highest numbers of residents of Mexican-origin. As The Economist points out, “communities have proved more durable than borders”. Mexican migrants have been preferentially attracted to areas that were originally Hispanic, and where some residents can “trace their roots to long before the map was redrawn”. As The Economist concludes, “They didn’t jump the border—it jumped them.”

Related posts:

How well do you know Mexico? The geography of Mexico: Quiz 9

 Quiz  Comments Off on How well do you know Mexico? The geography of Mexico: Quiz 9
Feb 132014
 

Welcome to our ninth quiz about the geography of Mexico.

How many of the following can you answer correctly?

If you answer a question incorrectly, you can have more attempts at each question before the answer is revealed.

Good Luck!

[mtouchquiz 9]

Previous quizzes:

 Tagged with:

World’s longest underground river flows deep beneath the Yucatán Peninsula

 Other  Comments Off on World’s longest underground river flows deep beneath the Yucatán Peninsula
Feb 102014
 

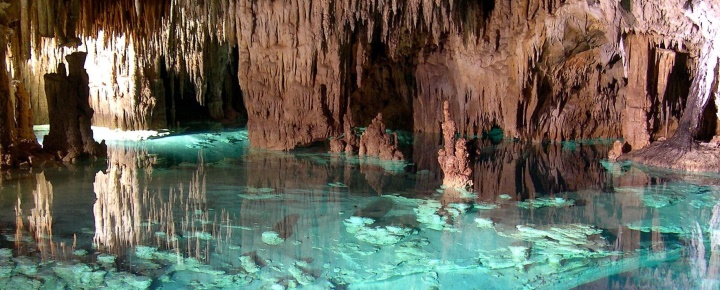
In January 2007, the world’s longest underground river was reported from Mexico’s Yucatán Peninsula. [Prior to that date, the honor was held by the Puerto Princesa Subterranean River in the Philippines]

The Sac Actun (“White Cave”) river system in the Yucatán Peninsula wanders for 153 km (95 miles) through a maze of underground limestone caves. It took British diver Stephen Bogaerts and his German colleague Robbie Schmittner four years to explore the caverns using underwater scooters and specially rigged gas cylinders, before they finally discovered a connection between the Yucatán region’s then second- and third-longest cave systems, known respectively as Sac Actun and Nohoch Nah Chich (“Giant Birdcage”). Following the discovery of a link, the entire system is now known as Sac Actun. The system has a total surveyed length (including dry caves) of 319 kilometers (198 mi), making it the longest cave system in Mexico, and the second longest worldwide. [The longest is the dry Mammoth Cave System, Kentucky, USA, which measures 643.7 km (400 mi) in length].

Sac-Actun cave system

Sac-Actun cave system

Vying with Sac Actun for the title of longest surveyed underwater cave system is the nearby Sistema Ox Bel Ha (“Three Paths of Water”), also in the Tulum municipality of Quintana Roo. As of August 2013, surveys had measured 256.7 kilometers (159.5 mi) of underwater passages.

The underground passages and caverns of the Yucatán Peninsula have been a favored site for cave explorers for decades. Formal mapping of the systems has taken more than 20 years of painstaking work. Access to the systems is via the hundreds of sinkholes (cenotes) that litter the surface of the Peninsula. The Sac Actun system alone includes more than 150 cenotes.

Water management was critical to the Maya as they developed their advanced civilization in this area, a region with very limited surface freshwater. Many of the cenotes in the Yucatán Peninsula have archaeological importance and were utilized by the Maya for ceremonies. Perhaps the best-known (and most visited) cenote is the Sacred Cenote (cenote sagrado) at the archaeological site of Chichen Itza.

The caverns of the Yucatán Peninsula were formed as a result of the slow solution of limestone over thousands of years by percolating, slightly acidic, rainwater. In some cases, cave formations, such as stalactites and stalagmites, have later grown in the caves, formed drip-by-drip from the slow deposition of calcium carbonate from calcium-saturated ground water.

Because the average elevation of the Yucatán Peninsula is only a few meters above sea level, the water in many of the caves is “layered”, with a lens of freshwater overlying a layer of salt water. Rainwater that soaks into the ground becomes ground water, which then moves slowly along the watertable to eventually reach the ocean.

Cave researchers are worried that tourist developments in the Yucatán Peninsula will have adverse impacts on underground water systems, both in terms of water quantity (because of the amounts of fresh water extracted for domestic and tourist use) and in terms of water quality, because even point sources of water pollution (such as excess fertilizers from a golf course) could contaminate underground water supplies over a wide area.

Want to read more?

Related posts

The pattern of violent crimes in Mexico in 2013

 Mexico's geography in the Press, Updates to Geo-Mexico  Comments Off on The pattern of violent crimes in Mexico in 2013
Feb 082014
 

The Consejo Ciudadano para la Seguridad Pública y la Justicia Penal AC, a Mexican non-profit, has published an interesting report looking at the levels of violent crime in Mexico in 2013:

The authors take violent crimes to include intentional homicide, kidnapping, rape, aggravated assault, robbery with violence and extortion.

At the municipal level, violent crime is concentrated in a relatively small number of municipalities. The report looks at the statistics for the 216 municipalities (including delegaciones of the Federal District) that had estimated populations of over 100,000 in 2013. Since 2012, four municipalities have joined this group: El Fuerte (Sinaloa), Tepotzotlán (México), Pánuco (Veracruz) y Playas de Rosarito (Baja California). Between them, the 216 municipalities are home to about 64% of Mexico’s total population.

Data from government agencies and INEGI were used to compile rates for each crime in each municipality. These rates were then multiplied by the following weightings (to reflect the relative severity and impacts of each type of crime),

  • 0.55 for intentional homicide
  • 0.22 for kidnapping
  • 0.13 for rape
  • 0.04 for aggravated assault
  • 0.03 for robbery with violence
  • 0.03 for extortion

and summed to give an overall index for “violent crimes”.  For the 231 municipalities, the index ranged from 106.63 for Oaxaca, Oaxaca to 0.00 for Zapotlán el Grande in Jalisco. The full details of the methodology are explained and discussed in the report. A similar methodology was also used to calculate levels of violence by state.

The worst 10 municipalities in terms of violent crime were:

  1. Oaxaca, Oaxaca – violent crime index value of 106.63
  2. Acapulco, Guerrero – 80.35
  3. Cuernavaca, Morelos – 65.30
  4. Yautepec, Morelos – 56.19
  5. San Pedro, Coahuila – 53.42
  6. Cd. Victoria, Tamaulipas – 52.48
  7. Iguala de la Independencia, Guerrero – 52.25
  8. El Fuerte, Sinaloa – 50.82
  9. Jiutepec, Morelos – 50.29
  10. Torreón, Coahuila – 49.31

The national index (ie treating the entire country as a single entity) was 23.17, meaning that the index value for violent crimes in Oaxaca, Oaxaca, was more than four times that of the country as a whole.

Municipalities which were in the worst twenty in 2012 for violent crime, but have now fallen out of that group include: Lerdo (Durango) Zacatecas (Zacatecas), Cuautla (Morelos), Zihuatanejo (Guerrero), Temixco (Morelos), Cuauhtémoc (DF), Tecomán (Colima), Navolato (Sinaloa), Centro (Tabasco) and Monterrey (Nuevo León).

Moving into the worst twenty for the first time are: Playas de Rosarito (Baja California), Hidalgo del Parral (Chihuahua) San Pedro (Coahuila), Chilpancingo (Guerrero), El Fuerte (Sinaloa) and Chalco, Cuautitlán, Cuautitlán Izcalli, Ecatepec and Naucalpan (all in the State of Mexico).

Of the 213 municipalities, Acapulco had the highest intentional homicide rate (112.81/100,000, about 6 times the national rate of 19.05/100,000). Cd Victoria had the highest kidnapping rate (23.28/100,000, 15 times higher than the national rate of 1.46/100,000, though kidnapping rates in Mexico are notoriously unreliable, and have been the subject of intense press debate in recent months).

Violent crimes by state, 2013

By state (see map), Guerrero had the highest violent crime index with 47.76 points, followed by Morelos 43.99 and Chihuahua 40.87. In general, with the prominent exceptions of the State of México and Guerrero, the southern half of Mexico appears to be somewhat safer than the northern half.

Map of Violent crime index, 2013

Violent crime index, 2013. Source of data: see post. Credit: Geo-Mexico

For individual categories of crime at the state scale, Morelos had the highest kidnapping rate (8.24/100,000). Quintana Roo had the highest rate of rape (28.31/100,000, compared to national average of 11.36/100,000). The State of Mexico had the highest rate for aggravated assault (251.64/100,000 compared to national average of 130.21/100,000). Morelos came out on top for the highest rate of robbery with violence (455.08/100,000 compared to national average of 182.61) and for the highest rate of extortion (21.96/100,000 compared to national average of 6.94/100,000).

Good news for tourists

According to this report, almost all of Mexico’s major tourist destinations (with the noteworthy exception of Acapulco) are located in areas where violent crime is below the national average.

Related posts:

Remittances fell 3.75% in 2013 but look set to rise in 2014

 Mexico's geography in the Press  Comments Off on Remittances fell 3.75% in 2013 but look set to rise in 2014
Feb 062014
 

Figures from Mexico’s central bank (Banco de México) show that the value of remittances sent home by Mexicans working in the USA fell 3.75% in 2013, compared to the previous year.

Annual remittance totals in billions of dollars:

  • 2013 – 21.596
  • 2012 – 22.438
  • 2011 – 22.802
  • 2010 – 21.303

Trends in remittance payments are closely linked to trends in the US economy, so the slight fall in the past two years is no great surprise, as the US economy struggles to regain growth following the 2008 financial crisis.

There are some positive signs. Despite the decline over the year as a whole, the month of December saw remittances entering Mexico of 1.8 billion dollars, higher than any December since 2007.

In the last quarter of 2013, remittance payments were 3.46% higher than for the same period in 2012 (mainly due to a higher number of remittance payments), suggesting that remittance payments may now be on the rise again. The average amount remitted during the last quarter of 2013 was 285.34 dollars, 3.8% less than the average for the equivalent period in 2012.

Note: These remittance figures quantify only remittances sent via “formal” channels such as banks, and do not include informal payments carried directly back to Mexico by family or friends.

Related posts:

Global literacy or geo-illiteracy? The latest entrant to our “North America” hall of shame

 Books and resources  Comments Off on Global literacy or geo-illiteracy? The latest entrant to our “North America” hall of shame
Feb 042014
 

“Mastering Global Literacy” is a collection of short articles written to explain how “educators can cultivate globally literate learners while becoming globally connected themselves.” The book’s authors (Veronica Boix Mansilla, Anthony W. Jackson, Heidi Hayes Jacobs, William Kist, Homa Sabet Tavangar and Silvia Rosenthal Tolisano) “explore ways to bring global issues into the classroom and personalize them using new digital tools.” In addition, the advertising blurb promises that readers will find “strategies for implementing global-awareness studies into the traditional school curriculum, as well as creating new types of 21st century learning environments.”

mastering-global-literacyThe aims of this book are laudable, but sadly, in many ways, this book fails to live up to its hype. This is especially true of Chapter 5 (the concluding chapter), “Interdisciplinary Global Issues: A Curriculum for the 21st Century Learner”. The overly US-centric approach adopted in this book is nowhere more obvious than in this chapter. After defining what is meant by global literacy, the chapter considers how the (U.S.) National Geography Standards (NGS) can help educators plan courses that will promote it. The NGS certainly have considerable value in this regard, but (ironically) this chapter might have benefited from also considering a more global perspective such as that adopted by the geography curriculum of the International Baccalaureate’s Diploma Program.

Many of the suggestions made in this book for how global literacy can be promoted are already being practiced (and have been for decades) by geography teachers in the U.K., Australia and elsewhere. The idea that geography can be infused into other disciplines has been around for a long time, hence the proliferation of course titles (in many disciplines besides geography) including terms like “Global” and”World”. There is no need to reinvent this particular wheel in developing courses that promote global literacy, and little advantage to be gained from adopting new terminology, such as the proposals for “Geo-economics”, “Geocommunications”, “Geo-arts and literature”, “Geohealth”, “Geosports” and “Geo-education”.

This book is also the latest entrant in our “North America” hall of shame for its description of a “subject-specific strategy” that will boost global literacy in the classroom when “a globally connected educator facilitates the learning”. The strategy is based on a geography lesson in which “A middle school class is studying South America and following, via a blog and Twitter feed, a National Geographic-sponsored trip of a man traveling by bus from the United States to Antarctica. Students learn about the traveler’s different destinations throughout South America: Mexico, Guatemala, the Panama Canal, Colombia, Argentina, and finally, Cape Horn.”

“Houston, we have a problem!”. The suggestion that Mexico, Guatemala and the Panama Canal are located in South America is a classic example of geo-illiteracy and, as such, completely out of place in a book about global literacy.

Conclusion? While this book does have some valuable sections, it offers far less to geographers than its promotional materials would suggest. Given its title, the book’s failure to engage with modern geography (as practiced outside the USA) is a major limitation.

Mastering Global Literacy. Contributors: Veronica Boix Mansilla, Anthony W. Jackson, Heidi Hayes Jacobs, William Kist, Homa Sabet Tavangar, Silvia Rosenthal Tolisano. 136 pages. Solution Tree. 2013.

Related posts:

Extreme poverty declined between 2010 and 2012

 Other, Updates to Geo-Mexico  Comments Off on Extreme poverty declined between 2010 and 2012
Feb 012014
 

As we saw in an earlier post – Poverty on the rise in some states in Mexico – the total number of people living in poverty in Mexico continues to rise, though the poverty rate (as a percentage) remains roughly the same.

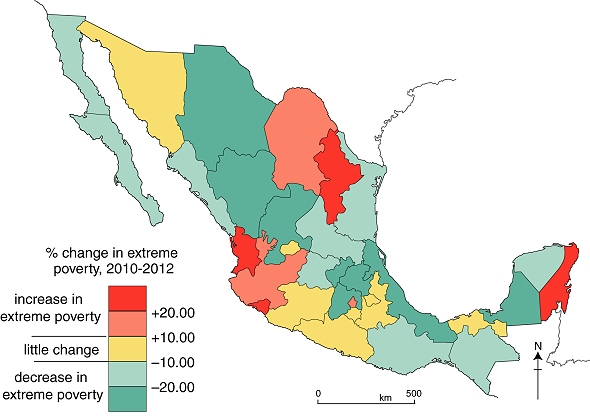
The measures of poverty used by Mexico’s National Political and Social Development Commission (Coneval) are multidimensional, and not simply based on household or personal income. This map shows the changes in “extreme multidimensional poverty” (a category that includes “the poorest of the poor”)  that occurred in Mexico between 2010 and 2012.

Changes in levels of extreme poverty in Mexico, 2010-2012.

Changes in levels of extreme poverty in Mexico, 2010-2012. Credit: Geo-Mexico; all rights reserved. Data: Coneval

In areas shaded red, a higher percentage of the population experienced “extreme poverty” in 2012 than in 2010; their personal situations and opportunities have presumably become significantly worse. Interestingly, this category includes the prosperous states of Nuevo León (economy based on manufacturing and services) and Quintana Roo (tourism).

The reverse is true for areas shaded blue where the extreme poverty rate has fallen: many of the people living in those areas have moved out of the most extreme category and presumably have seen their fortunes and opportunities improve, even if, in most cases, not sufficiently to have escaped the “poverty” category completely. This category includes more than half of Mexico’s 32 administrative divisions.

The fact that “extreme poverty” has declined in more than half of Mexico is encouraging, and suggests that government policies aimed at poverty reduction, such as Oportunidades are gradually making a difference. It remains to be seen whether or not this trend continues over the next few years.

Related posts: