Spectacular landscapes in Mexico

 Mexico's geography in the Press  Comments Off on Spectacular landscapes in Mexico
May 112017
 

We rarely post straight links to other sites without detailed commentary but every rule has exceptions and this spectacular selection of 30 Google Earth images from The Atlantic more than deserves a close look:

Previous visually-stunning or visually-interesting posts on Geo-Mexico include:

Nov 132015
 

While writing Geo-Mexico, the geography and dynamics of modern Mexico, we were surprised to find there were no books in English about the geography of Mexico aimed at readers in the upper grades of high school or beginning years of college. On the other hand, we knew of several books about Brazil aimed at that level, most of them published in the U.K.. Why are there more geography books about Brazil than about Mexico?

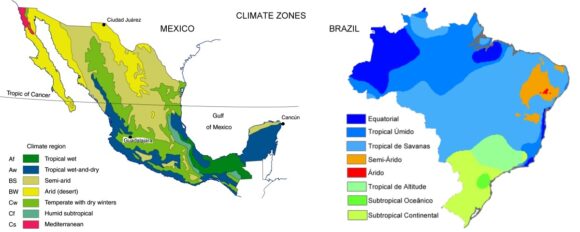
One attraction of Brazil to geographers is that the spatial patterns of activities in that country are far simpler to describe, map and analyze, than their counterparts in Mexico. For example, compare these two maps of climate zones:

Climate zones of Mexico and Brazil.

Climate zones of Mexico and Brazil. Credit: Geo-Mexico and Wikipedia, respectively.

This makes it easier to teach about the spatial patterns of Brazil than Mexico. Even though regional geography largely disappeared from U.K. schools in the 1970s, most examination syllabi for the equivalent of Grade 13 still required the study of countries at contrasting levels of economic development. Brazil was a relatively popular choice to represent either (initially) an LEDC (Less Economically-Developed Country) or (more recently) an emerging economy or “middle-income” country. Naturally, this led to textbooks based on Brazil.

If further evidence were needed that British schools have tended to ignore Mexico, then look no further than a recent article in Geography, the flagship journal of the U.K.’s Geographical Association, the leading subject association for all teachers of geography in the U.K.

Quoting its website,

The Geographical Association (GA) is a subject association with the core charitable object of furthering geographical knowledge and understanding through education. It is a lively community of practice with over a century of innovation behind it and an unrivalled understanding of geography teaching. The GA was formed by five geographers in 1893 to share ideas and learn from each other. Today, the GA’s purpose is the same and it remains an independent association.”

GEOGRAPHY_vol100_part3_COVERThe Autumn 2015 issue of Geography includes “Twenty-five years of Geography production”, an article by Diana Rolfe analyzing the content of the last 25 years of the publication. One particular section caught our eye. Rolfe lists the number of times that specific places are referred to over that time in the journal’s “place-based articles”.

The analysis shows that 78 countries were referred to in the past 25 years. The most frequently mentioned country (no surprise here) is the U.K., with (139 articles over the past 25 years). The next most frequently mentioned country is South Africa (27 mentions), followed by China (16), France (12), Australia (10), Hong Kong, Ireland and Canada (8 each). Latin American countries do not have a good showing on this list, but are represented by Peru (2), Argentina (1), Brazil (1) and Chile (1).

Astonishingly (to us at least) Mexico does not get a single mention. Neither, it must be said, do Sweden or Norway.

The omission of Mexico from the list is significant, given that it is the world’s 11th largest country in terms of total population, 14th largest in area, is the 9th most attractive country for FDI, and has the 11th largest economy on the planet!

It is an especially puzzling omission, in a U.K. context, given that U.K. investment during the nineteenth century helped unlock the mineral riches of Mexico, finance its banks, build its railway network and so much more.

We invite UK geographers to purchase a copy of Geo-Mexico, the geography and dynamics of modern Mexicocome or hop on over to geo-mexico.com to find out what they’re missing.

Related posts:

Nov 072015
 

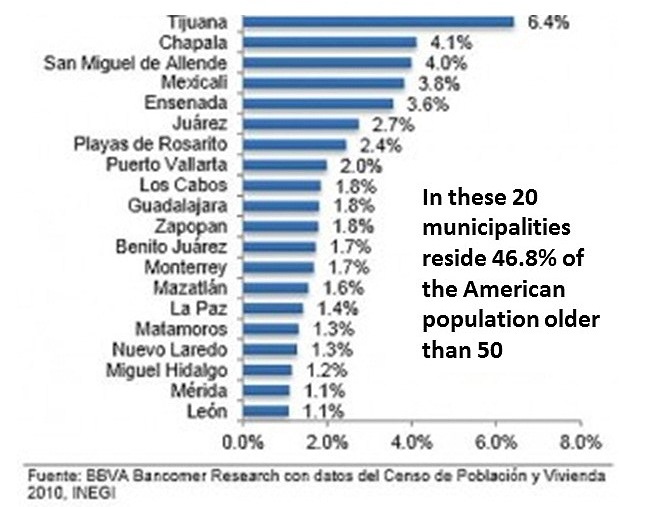
A BBVA-Bancomer report, based on Mexico’s 2010 census data includes an interesting graph showing where “Americans older than 50” live in Mexico. The data is based on place of birth, so some of the “Americans” in the data are of Mexican heritage – they were born in the USA, to parents who were born in Mexico, and have since relocated to Mexico.

americans-in-mexico-2010-graph

As the graph highlights, almost half of all Americans living in Mexico live in one of just 20 municipalities. Tijuana, just across the border from San Diego, leads the way, with 6.4% of all the Americans over age 50 living in Mexico, followed by Chapala and San Miguel de Allende, the only two non-border municipalities in the top seven locations for older Americans.

Perhaps no surprise, then, that both these areas have weekly English-language newspapers. The Chapala area is served by The Guadalajara Reporter which covers Guadalajara, Zapopan, Chapala and (to a lesser extent) Puerto Vallarta, potentially reaching 9.7% of all Americans over the age of 50 in Mexico. For its part, San Miguel de Allende has Atención San Miguel. Both locations are popular choices for retirement.

Kudos to “Madeline”, who points out in a comment (below), that there are several other English-language papers in Mexico. They include two in Puerto Vallarta: PV Mirror and the Vallarta Tribune. In Quintana Roo, Playa del Carmen has the Playa Times. In Baja California, there is the biweekly Baja Times and no doubt there are a few others, which we will add in due course! [Based in Mexico City, The News – thenews.mx – was the closest thing to a national daily in English, with distribution points in many parts of the country, but ceased publication in early 2016.]

Related posts:

Mexico’s webcams

 Books and resources  Comments Off on Mexico’s webcams
Jun 292015
 

There are thousands of webcams operating in Mexico offering armchair geographers the opportunity to see up-to-date images of active volcanoes, megacities, archaeological sties, small towns and tourist resorts.

Many of the major webcams are listed at Webcams de México, which has several great features once you’ve chosen a particular webcam, including access to prior images for any date and time, or the ability to compile an instant time-lapse video covering any period of time.

Links to webcams listed at Webcams de México:

Explore Mexico via its webcams! Enjoy!

Related posts:

Apr 092015
 

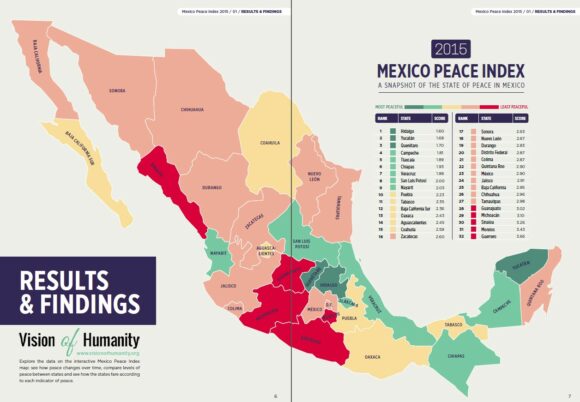
The Institute for Economics and Peace (IEP) has published its Mexico Peace Index. The following excerpts come from the Executive Summary of the Mexico Peace Index Report 2015:

The Mexico Peace Index provides a comprehensive measure of peacefulness in Mexico from 2003 to 2014. The 2015 report aims to deepen the understanding of the trends, patterns and drivers of peace in Mexico while highlighting the important economic benefits that will flow from a more peaceful society.
Mexico Peace Index, 2015

Mexico Peace Index, 2015. Credit: Institute for Economics and Peace.

The map above shows the relative values of the MPI by state, where dark blue means the most peaceful states and dark red the least peaceful (most violent) states.

Improvement since 2012

According to the report, Mexico’s peace has improved 10.5% since 2012, continuing the trend from 2011; however, 2014 saw very little improvement, improving only 0.7%. It is too early to determine whether this is a new trend. Mexico’s level of peace in 2014 approached 2007 levels, when homicide and violent crime began to increase rapidly.

The MPI indicators registering the largest improvements in the last two years were the homicide rate, which fell by 30%, and the level of organized crime, which improved by 25%. All three measures in the organized crime indicator (extortion, kidnapping and narcotics offenses) improved. There was also a significant reduction in the violent crime rate, which fell by 12%.

Furthermore, the recorded increase in peacefulness was widespread. In the last two years, 26 out of the 32 states saw improvements in peacefulness, with all of them recording reductions in the violent crime rate and 23 states recording reductions in the homicide rate. The biggest improvements were recorded in the least peaceful states; contrary to the overall trend, the most peaceful states became slightly less peaceful. These diverging trends resulted in a substantial narrowing of the gap between the least peaceful and the most peaceful states.

In contrast, during the same two-year period, weapons crime increased significantly and was up by 11%. The three other indicators that make up the MPI (justice efficiency, incarceration and police funding) have plateaued or slightly deteriorated and are now at record highs.

The justice efficiency indicator continued to decline, which is very concerning, with the number of homicides relative to the number of prosecutions doubling from 1.45 in 2006 to 3.43 in 2013. The justice efficiency indicator measures the ratio of homicide convictions to homicides in a given year and is used as a proxy for impunity.

Additionally, the rate at which people were sentenced to prison fell from 210 per 100,000 people to 104 from 2003 to 2014. Combined with the deterioration in the justice efficiency indicator, this is a troubling trend that highlights the urgent need to fully implement the current justice reforms.

It should be noted that the declines in homicides and gang-related violence do not necessarily mean that criminal organizations are less powerful; they may have become more circumspect in their activities. This reflects a paradox in Mexico: while indicators of peacefulness have greatly improved in the last four years, many Mexicans still report high perceptions of criminality. Additionally, officially recorded rates of homicide and violent crime are still very high by global standards.

Under-reporting of violent crime and other criminal activities is a serious issue in Mexico, with IEP estimating that rape is reported only eight percent of the time and assault only 23%. To create a more accurate index, IEP has adjusted all indicators for under-reporting rates.

For many, these concerns create doubt about the reliability of criminal justice statistics. To determine the veracity of the official data, IEP compared various alternative datasets and victimization surveys against the official data. The results tend to support the trend towards higher levels of peace, but with some qualifications.

Main findings of the Mexico Peace Index 2015

  • Mexico has experienced a large decrease in violence since 2011, with the national level of peace improving by 16%.
  • Progress in peace plateaued last year; it is too early to determine if this is the start of a new trend.
  • The level of peace as measured by the 2015 MPI is still 18% lower than in 2003.
  • The most peaceful state in Mexico is Hidalgo, followed by Yucatán, Querétaro, Campeche, Tlaxcala and Chiapas.
  • Of the 76 largest metropolitan areas of Mexico, the most peaceful is Orizaba in Veracruz, and the least peaceful is Culiacán in Sinaloa.
  • The eastern region remains the most peaceful in Mexico, while the northern region is still the most violent, although the gap between the north and the other regions is now at its lowest point since 2004.

Trends in Peace

Peace improved in the majority of states in Mexico in the last two years, with 26 out of 32 states improving. The largest improvements were in the northern region, which improved 17.8%. The gap in the levels of peace between the least and most peaceful states is now at its lowest point since 2006.

Over the last two years, the largest decreases in violence have been in the homicide rate, which fell almost 30%, and the level of organized crime, which fell by 25%.

The only indicator that recorded a significant deterioration in the last two years is weapons crime, which increased by 11%. The police funding indicator and the justice efficiency indicator recorded very slight deteriorations, reaching their worst levels in 2014.

The fall in the homicide rate is mainly due to a reduction in homicides related to organized crime, as the biggest reductions were recorded in the states with the worst levels of drug cartel activity.

While there is some doubt about the accuracy of government crime statistics, multiple data sources do support a decline in the homicide rate over the last two years. This strongly suggests the progress in peace is real.

On an international comparison, Mexico fell 45 places in the Global Peace Index between 2008 and 2013. It remains the least peaceful country in Central America and the Caribbean.

Economic Value of Peace in Mexico

The total economic impact of violence in Mexico in 2014 is estimated to be $3 trillion pesos or US$233 billion, equivalent to 17.3% of GDP. This represents $24,844 pesos, or almost US$1,946, per citizen. This is a 16.7% decrease from 2012, when the total economic impact of violence in Mexico was $3.57 trillion pesos.

The states with the highest per capita economic impact from violence are Guerrero, Morelos, Baja California and Tamaulipas, with the economic impact in Guerrero at $43,666 pesos/person. If the 16 least peaceful states in 2003 had experienced the same economic growth as the 16 most peaceful states in 2003, then the Mexican economy in 2014 would be $140 billion pesos or 13% larger.

Related posts:
Post and Fly Videos of Mexico

 Books and resources  Comments Off on Post and Fly Videos of Mexico
Sep 252014
 

A series of videos made by “Post and Fly Videos” provides an outstanding visual introduction to many of Mexico’s most photogenic sights. Some of the photography is truly stunning.

For a fun introduction, try this 4 minute video (turn your speakers on) which gives a quick tour of many parts of Mexico. (As yet, there are very few Post and Fly Videos of the Yucatan Peninsula, but I’m confident they will remedy this omission before too long!)

A list of the places shown in this 4 minute video is given below (with a few links to relevant Geo-Mexico posts), for those who like to know precisely where particular shots were taken.

Places in the video (in order of appearance):

Marina San José del Cabo, Baja California Sur
El Sidral, San Luis Potosí
Macroplaza Monterrey, Nuevo León
Las Pozas de Xilitla, San Luis Potosí
Tamtoc, San Luis Potosí
Las Estacas, Morelos
Peña del Aire, Hidalgo
El Naranjo, San Luis Potosí
Xochimilco, D.F.
Tamul, San Luis Potosí
Los Cabos, Baja California Sur
Ex Hacienda de Chautla, Puebla
Gran Cenote, Quintana Roo
El Salto, San Luis Potosí
Valle de Bravo, Estado de México
Los Cabos, Baja California Sur
Ex Hacienda de Santa María Regla, Hidalgo
Peña de Bernal, Querétaro
Acopilco, D.F.
Atlixco, Puebla
Kiosco Morisco, D.F.
López Mateos . Baja California Sur
Huasca, Hidalgo
Mantetzulel, San Luis Potosí
Metepec, Estado de México
Todos Santos, Baja California Sur
Tula, Hidalgo
Todos Santos, Baja California
Castillo de la Salud, San Luis Potosí
Holbox, Quintana Roo
Punta Allen, Quintana Roo
Muyil, Quintana Roo
Tepotzotlán, Estado de México
Parque Fundidora, Nuevo León
Santa Fe, D.F.
Balandra, Baja California Sur
Arcos del Sitio, Estado de México
Loreto, Baja California Sur
Tulum, Quintana Roo
Loreto, Baja California Sur
Tulum, Quintana Roo
Xochimilco, D.F.
Todos Santos, Baja California
Aktun Chen, Quintana Roo
Prismas Basálticos, Hidalgo
Marina San José del Cabo, Baja California Sur
Peña del Aire, Hidalgo
López Mateos . Baja California Sur

To see more Post and Fly Videos, explore their website, especially their “Explorando México” section.

Study finds indigenous Mexicans far more diverse than previously thought

 Other  Comments Off on Study finds indigenous Mexicans far more diverse than previously thought
Jun 262014
 

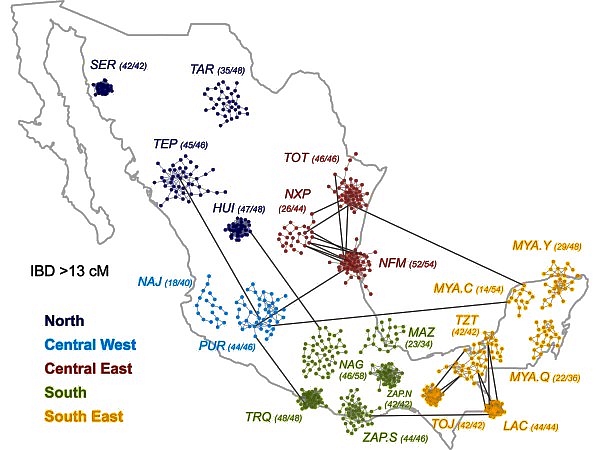
A recently released study [1] indicates that genetic diversity among indigenous Mexicans is far greater than previously thought. Ethnic Seri living in isolated parts of Sonora are as genetically different from isolated Lacandon living near the Guatemala border as Europeans are from Chinese. These differences must have existed for thousands of years before Europeans arrived in the New World. The differences are also reflected in mestizos living in geographically separated parts of Mexico.

Source: A. MORENO-ESTRADA ET AL., SCIENCE (2014)

Source: Moreno-Estrada et al. Science (2014)

The study in the June 13 issue of Science was conducted by researchers from the University of California, San Francisco and Stanford. They studied the genomic data from 511 native Mexicans from 20 of Mexico’s 65 indigenous groups scattered throughout Mexico (see map) from the Seri (SER) and Tarahumara (TAR) in the northwest, to the Purépecha (PUR) in the west, Trique (TRQ) and Zapotec (ZAP)in the south as well as three subgroups of Maya (MYA) on the Yucatán Peninsula [2]. They also analyzed similar data from 500 mestizos from ten Mexican states as well as some from Guadalajara and Los Angeles.

The findings have great implications for the study of diseases in these populations [3]. For example a lung capacity test can indicate a disease in one indigenous group while the same test results would be normal in a different indigenous group.

References:

[1] Moreno-Estrada et al. “The genetics of Mexico recapitulates Native American substructure and affects biomedical traits”, Science 13 June 2014; Vol 344 no.6189, p. 1301.

[2] Lizzie Wade. “People from Mexico show stunning amount of genetic diversity”, ScienceMag.org, June 12, 2014.

[3] Karen Weintaub,”Mexico’s Natives didn’t mix much, new study shows”, National Geographic, June 12, 2014.

Related posts:

Jun 082013
 

This 30 minute video (narrated in Spanish with English subtitles) looks at the vexed situation of Mexican workers that have been deported from the USA back into Mexico. About 200 migrants are deported daily. Almost all are male,. Many of them have lived for several years in the USA prior to deportation, and some have wives and families still living north of the border.

About 45% of all migrants from Mexico to the USA crossed the border between Tijuana and California. Since 1994 (Operation Gatekeeper) crossing the border has been made progressively more difficult. The border is now heavily protected with border guards given access to technology such as night-vision telescopes and a network of seismic monitors (to detect the minor ground movements that signal people walking or running through the desert). As the US economy ran into problems a few years ago, the flow of migrants north slowed down, even as authorities in the US launched more raids against undocumented workers, leading to an increase in the number of workers deported.

In the video, a range of stakeholders are given the chance to explain how they see the problems faced by deportees. A social anthropologist provides some background and academic insights; activists explain their position and how they seek to help deportees; several individual deportees share their experiences and invite us into their “homes”, precarious one-room shacks, some built partially underground, hobbit-like, in “El Bordo”, a section of the canalized channel of the Tijuana River that runs alongside the international border.

The garbage-strewn El Bordo has sometimes housed as many as 4,000 deportees. Mexican authorities are anxious to clean the area up and periodically bulldoze any shacks they find.

These personal stories of workers from interior states such as Puebla are harrowing. Many still seek “the dream” and openly admit they do not want to return to their families as a “defeated person”.

While parts of this video might have benefited from tighter editing, the accounts are thought-provoking and the video is an outstanding resource to use with classes considering the longer-term impacts of international migration.

There seems little doubt that a majority of the “residents” of El Bordo has a serious drug problem, and the video includes interviews about this issue with municipal police, deportees and aid workers, who discuss the problems and suggest some possible solutions, but ultimately, the city and state authorities have some tough decisions to make if they are to resolve this serious, and growing, humanitarian problem.

Related posts:

Mexican migrants and remittances: an introduction

 Books and resources, Index page  Comments Off on Mexican migrants and remittances: an introduction
Nov 072011
 

Remittances (the funds sent by migrant workers back to their families) are a major international financial flow into Mexico. Remittances bring more than 20 billion dollars a year into the economy, an amount equivalent to 2.5% of Mexico’s GDP.

On a per person basis, Mexico receives more worker remittances than any other major country in the world. An estimated 20% of Mexican residents regularly receive some financial support from relatives working abroad. Such remittances are the mainstay of the economies of many Mexican families, especially in rural areas of Durango, Zacatecas, Guanajuato, Jalisco and Michoacán.

The map below accompanied a 2007 Atlantic Magazine report by Matthew Quirk entitled “The Mexican Connection: mass migration has left many towns in Mexico half-empty, but much wealthier.” The map is based in part on work by Raúl Hernández-Coss for the World Bank. The map and article provide an excellent starting-point for considering the basic patterns and impacts associated with remittance flows between the USA and Mexico. The article is an easy-to-read introduction to many of the key issues connected to remittances.

The data used for the map come from the US Census and from the registration records held by Mexican consulates in the USA.

Summary of migration flows between Mexico and USA

Summary of migration flows between Mexico and USA; click to enlarge Source: Atlantic Magazine.

The causes and consequences of mass out-migration and large remittance payments are varied, and sometimes disputed. For background, causes and trends, try:

For some impacts of Mexican migrants on the USA (of varying importance), see:

The four subtitles used in the Atlantic Magazine article are useful reminders of some of the other major aspects of international migration from Mexico. Again, links are given to previous Geo-Mexico posts which look at good examples.

“Branching Out” emphasizes the links that exist between communities, often referred to as “migration channels”.

“The Hollow States” identifies the five major “states of origin”—Guanajuato, Jalisco, Michoacán, San Luis Potosí and Zacatecas—which receive almost 50% of all remittance payments.

“Staying Put” points out that improved economic conditions in Mexico in recent decades, have restricted out-migration from certain areas, especially the border region. Recent developments in Mexico’s war on drugs have, however, led to an increase in the number of border residents moving to bigger, safer cities further south, or seeking to emigrate to the USA.

“Community Development” stresses the important link between “hometown associations” (groupings, found in many US cities, of Mexican migrants sharing a common area of origin) and their related villages and towns in Mexico. Many community development projects in areas of high out-migration have been financed by remittances. In many cases, the three levels of Mexican government—municipal, state and federal—provide matching funds for such projects, meaning that remittances only pay for 25% of the total costs.

In future posts, we will examine some of these aspects of remittances in more detail, and take a much closer look at the precise mechanisms used to make the international financial transfers involved.