Narco-related killings in Mexico, 2006-2010

 Mexico's geography in the Press, Updates to Geo-Mexico  Comments Off on Narco-related killings in Mexico, 2006-2010
Jul 162010
 

The alarming situation in Mexico with regard to drug-related violence has led the Wall Street Journal to prepare an interesting interactive graphic.

The graphic shows narco-related killings from 2006 to 2010. The slider allows you to see the pattern for each year. Hovering over the proportional circles used to represent the deaths in each state brings up the exact number.

While drug-related violence is not new, it is clearly intensifying and now affecting areas of the country where it was traditionally very rare.

Chapter 20 of Geo-Mexico: the geography and dynamics of modern Mexico includes a brief section about the geography of drug trafficking. It focuses mainly on the spatial changes in supply systems. Buy your copy today, so you have this handy reference guide to all aspects of Mexico’s geography available whenever you need it.

Mexico has 32 states, divided into 2,456 municipalities

 Excerpts from Geo-Mexico, Updates to Geo-Mexico  Comments Off on Mexico has 32 states, divided into 2,456 municipalities
Jul 102010
 

Mexico’s 32 states are divided into municipios (municipalities). There are 2456 municipalities which vary greatly in size and population. For example, the average population of Oaxaca’s 570 municipalities is about 6000 while the average population of Baja California’s five  municipalities is over 500,000. Each municipality elects a new president and local council every three years (except for Coahuila where four-year terms now apply).

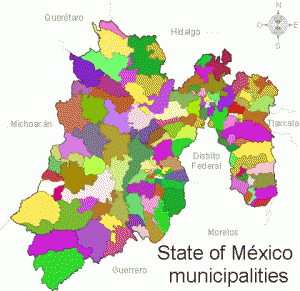
State of Mexico municipalitiesMunicipal governments have taxing authority but rely very heavily on financial support from state and federal sources.

Municipalities are responsible for a variety of public services, including water and sewerage; street lighting and maintenance, trash collection and disposal, public safety and traffic, supervision of slaughterhouses, and maintenance of parks, gardens and cemeteries.

Municipalities are also free to assist state and federal governments in the provision of elementary education, emergency fire and medical services, environmental protection and the maintenance of historical landmarks.

Municipalities are therefore akin to  counties in the USA.

Here are a selection of other facts about Mexico’s municipalities:

  • The state with the most municipalities is Oaxaca:  570; at the other extreme, the states of Baja California and Baja California Sur each have only 5 municipalities.
  • Excluding the equivalent territorial divisions of the Federal District (known as delegaciones), the largest municipalities in terms of population are Ecatepec de Morelos (in Mexico State) and Guadalajara (Jalisco). Each is home to about 1.7 million people.
  • The least populated municipality is Santa Magdalena Jicotlán (Oaxaca) which has just 102 inhabitants.
  • Only about 450 municipalities have fewer men than women. The most male-dominated municipality is Aquiles Serdán (Chihuahua) which has 1.6 men for every woman.
  • The most female-dominated municipality is San Miguel Tulancingo (Oaxaca) with 1.5 women for every man.
  • The municipality of Tulum (Quintana Roo) is one of the youngest in the country; its first council was elected in 2009.
  • The most crowded municipality in terms of people per dwelling is San Simón Zahuatlán (Oaxaca):  9.1 persons per household. The national average is 4.2. The least crowded municipality is  Santiago Nejapilla (Oaxaca) where the average occupancy is 2.7 per home.
  • The largest municipality in area is Ensenada (Baja California), 53,304 square kilometers; the smallest used to be San Lorenzo Axocomanitla (Tlaxcala), 4.34 square kilometers, but is now Santa Cruz Amilpas (Oaxaca) which is only 1 square kilometer in area.

The 2010 census, carried out in June, will necessitate revising some of these numbers when the results are released in due course.

Nezahualcoyotl, an irregular settlement which grew into a monster

 Excerpts from Geo-Mexico, Updates to Geo-Mexico  Comments Off on Nezahualcoyotl, an irregular settlement which grew into a monster
Jul 022010
 

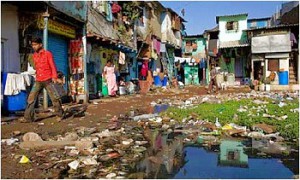
Rapid industrialization north of Mexico City after World War II brought a giant wave of immigrants aggravating a serious shortage of low income housing. With the vecindades (inner city slums) severely overcrowded, the only alternative was “irregular housing” or “colonias populares.” These were developed wherever there was vacant land, mostly in the west and north of the city on the dry former lakebed or on very steep slopes. They all followed a development pattern roughly similar to that of Nezahualcoyotl, the largest and best known colonia popular.
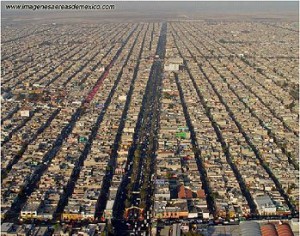
The densely packed housing of Nezahaulcoyotl in all its glory

The densely packed housing of Nezahaulcoyotl in all its glory. Image: imagenesaereasdemexico.com. Follow link at end of post for more Mexico City photos

In the late 1950s, a group of speculators gained de facto possession of roughly 78 square kilometers  (30 square miles) of former lakebed in Nezahualcoyotl just east of the Mexico City airport. They sold nearly 200,000 plots cheaply and on credit, a few dollars down, and a few dollars a month, for 10-20 yrs.

Families bought plots and immediately started to erect shacks. Aside from electricity, which was provided by the national utility, the plots initially lacked basic services such as potable water, sewerage, flood drainage, pavement, schools, etc. Without services, Nezahualcoyotl was illegal under State of Mexico law; but the government tolerated this situation.

The community became an immediate boom town. By 1970, the population was over 600,000, but still over half the area was without paved streets, water supply and drainage. Summer brought floods while the rest of the year it was an arid dust bowl.

Residents became frustrated with the broken promises of the developers, demanded that they be jailed for fraud, and stopped their monthly payments. The feud lasted for years and some developers were actually jailed. Eventually most of the area was “regularized”, meaning that residents got legal deeds and basic services. They continued to improve their houses and communities.
Nezahualcoyotl, the city of dreams

Nezahualcoyotl, the city of dreams

By 1980, the population reached about 1.3 million, making it one of the largest and most densely populated municipalities in the country.

By 2000, Nezahualcoyotl had essentially joined the mainstream. Nearly all residents had electricity and TVs, over 80% had refrigerators, 60% had telephones, nearly one in three had access to an automobile, and almost one in five had a computer. While Nezahualcoyotl has slums, gangs and crime, it also has tree-lined boulevards, parks, a zoo, banks, shopping centers, offices, libraries, hospitals, universities, cinemas, and apartment buildings. It even has a cathedral (since 2000) and an Olympic sports stadium, which hosted some 1986 FIFA World Cup matches. Currently, it is a vital part of metropolitan Mexico City and provides jobs for almost 250,000.

From irregular settlement to massive urban monster; Cd. Nezahualcoyotl has certainly come a long way!

Mexico’s cities and towns are analyzed in chapters 21, 22 and 23 of Geo-Mexico: the geography and dynamics of modern Mexico. Buy your copy today!!
How many hurricanes are likely in the 2010 Atlantic hurricane season?

 Mexico's geography in the Press, Updates to Geo-Mexico  Comments Off on How many hurricanes are likely in the 2010 Atlantic hurricane season?
Jul 012010
 

Philip Klotzbach and William Gray, of Colorado State University, have analyzed the atmospheric and oceanic conditions in the Atlantic immediately prior to the 2010 hurricane season. They conclude that this season’s hurricane activity in the Atlantic is likely to be stronger than has been the norm during the past 50 years. They predict that the Atlantic season will see 18 named storms, of which 8 will be classed as tropical storms, 5 as moderate hurricanes (1 or 2 on the Saffir-Simpson scale), and 5 as severe hurricanes (3, 4 or 5 on the Saffir-Simpson scale).

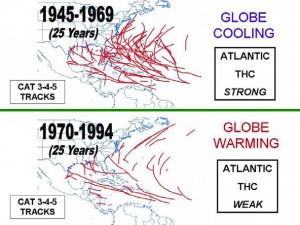
The popular press regularly warns us that on-going global warming will increase the frequency of hurricanes, and their intensity, allegedly due to warmer sea-surface temperatures in the mid-ocean hurricane-spawning areas. Klotzbach and Gray do not believe this. They studied the paths of all severe hurricanes (category 3, 4 or 5) for the fifty years from 1945-1994, dividing this time frame into two 25-year periods (see image).

Tracks of severe Atlantic hurricanes, 1945-1994

Tracks of severe Atlantic hurricanes, 1945-1994. Source: Klotzbach and Gray, 2010. Link to original article at end of this post. Click image to enlarge.

From 1945-1969 was a period of weak global cooling. There were 80 severe hurricanes in this period, some of them taking very erratic paths, with correspondingly dramatic impacts when they struck areas wholly unprepared.

Between 1970 and 1994, the Earth’s temperatures underwent a modest rise (global warming). However, in stark contrast to popular belief, far fewer severe hurricanes occurred during this period (38 in total), and they tended to follow entirely predictable paths.

Clearly the science behind hurricane formation is more complicated than some journalists would have us believe!

Klotzbach and Gray demonstrate the importance of the Thermohaline Circulation (THC) in the Atlantic. The THC is a large-scale circulation in the Atlantic Ocean that is driven by fluctuations in salinity and temperature. The 1945-1969 period coincided with a strong THC, whereas the 1970-1994 period was a time when the THC was weak.

What has happened since 1994? In the fifteen years from 1995-2009 inclusive, the THC was strong, and there were 56 severe Atlantic hurricanes. By comparison, in the preceding fifteen years from 1980-1994, when the THC was weak, only 22 severe hurricanes formed. So it appears that hurricane frequency is not linked to global warming or carbon dioxide (CO2) levels in the atmosphere, but to cyclical changes in the THC.

How accurate are the predictions for the 2010 hurricane season? Only time will tell…

Click here for Klotzbach and Gray’s original article (pdf).

Hurricane warnings in Mexico are the responsibility of the National Meteorological Service (NMS). The NMS also provides an archive of information about past hurricanes.

Hurricanes and other climatological phenomena are analyzed in chapters 4 and 7 of Geo-Mexico: the geography and dynamics of modern Mexico. Buy your copy today, so you have a handy reference guide available whenever you need it.

Unemployment rates in Mexico

 Updates to Geo-Mexico  Comments Off on Unemployment rates in Mexico
Jun 232010
 

The OECD (Organisation for Economic Co-operation and Development) has recently published unemployment rates for its member countries. Mexico fares quite well; its rate of “open unemployment”  so far this year has hovered around 5.5%. This is quite encouraging, since the average for the 31 OECD countries is around 8.7%. Note that these figures do not include “underemployment”.

The OECD members with the highest unemployment rates are Spain (19.7%), Slovakia (14.1%), Ireland (13.2%), Portugal (10.8%), Hungary (10.4%) and France (10.1%).

The lowest rates are in South Korea (3.7%), Netherlands (4.1%), Austria (4.9%), Japan (5.1%), Luxembourg (5.4%) and Australia (5.4%).

Mexico’s unemployment rate is more favorable than that of its NAFTA partners. Open unemployment is currently 8.1% in Canada and 9.7% in the USA.

Jun 112010
 

Compared to its very large and loud northern neighbor the USA, Mexico often seems like a rather minor country. But let’s take a closer look at Mexico’s major characteristics.

Mexico is among the world leaders in land size, population and economic production. These three criteria are a rational way of determining the world’s major countries. Mexico is the world’s 14th largest country in area, just behind the Congo and Saudi Arabia, but ahead of Indonesia and Libya. Mexico’s population in 2009 was about 109 million ranking it 11th in the world.  Russia (140 million) and Japan (127 million) were slightly ahead of Mexico. Trailing Mexico were the Philippines (92 million) and Vietnam (87 million).

The Gross Domestic Product (GDP) of Mexico in 2009 was about $1.5 trillion, behind Brazil ($2.0 trillion) and Italy ($1.7 trillion), but ahead of South Korea (S1.4 trillion), Spain ($1.4 trillion) and Canada ($1.3 trillion). These GDP figures are based on “Purchasing Power Parity” which illuminates distortions based on exchange rates. For example, if a hair cut of equal quality costs $20 in the USA, $5 in Mexico and $2 in China, the haircut is counted as a $20 contribution the GDP of each country.

Mexico is one of only six countries that are in the top 15 in all three categories. The other five countries in this select group are China, India, the USA, Brazil and Russia.

That Mexico is in this very select group makes a very strong case that it is indeed a major country on the world stage.

For more information about these and many other aspects of Mexico, consider buying Geo-Mexico: the geography and dynamics of modern Mexico and adding it to your library.

Mexico’s population will peak before 2050 but migration is harder to predict

 Updates to Geo-Mexico  Comments Off on Mexico’s population will peak before 2050 but migration is harder to predict
Jun 052010
 

Past data and current trends indicate that Mexico is adhering to the demographic transition model (see post of 15 May 2010).

Mexico's population is aging rapidly

Death rates first dropped precipitously and now birth rates are declining rapidly. By the middle of the 21st century, these will be roughly equal and natural population growth will drop to zero. Then birth rates will drop below death rates and the population will begin to decline. This is already happening in Russia, Italy, Germany and Japan.
Mexico is expected to reach this situation before 2050 when its population will be between 120 and 130 million. This is a rather wide spread for a demographic forecast because predicting the rates of Mexican immigration to the USA is very tricky. Net immigration was over 550,000 in 2006, but dropped to about 200,000 in 2009 because the employment situation in the USA was so bad. When the recession ends and jobs are again plentiful in the USA, immigration will jump back up, but how far and for how many years?

As Mexico’s population growth rates continue to decline and become negative, the new challenge will be coping with a rapidly aging population. Fortunately, Mexico will be able to learn from Europe and Japan who are already facing this challenge.

Mexico’s population dynamics are discussed in chapters 8 and 9 of Geo-Mexico: the geography and dynamics of modern Mexico.

Corner stores in Mexico give way to supermarket chains

 Updates to Geo-Mexico  Comments Off on Corner stores in Mexico give way to supermarket chains
May 282010
 

In the past 50 years, Mexico has become a land of supermarkets. Where small corner stores once used to be the source of staples such as bread, milk and fresh vegetables, supermarkets have now taken over in almost every town.

Here is a summary of Mexico’s main supermarket chains:

* Wal-Mart de México (Walmex), easily Mexico’s largest retailer (2009 sales: 22 billion dollars). A subsidiary of the US retail giant Wal-Mart Stores. More than 1,000 supermarkets in Mexico, from medium-sized, low-end stores specializing in low prices, to membership clubs selling flat-screen TVs and patio furniture. Walmex also owns restaurants (including VIPS) and clothing stores. Walmex is gradually expanding into Central America and currently has 519 supermarkets in that region.

* Soriana (2009 sales: 7.6 billion dollars), based in the northern industrial city of Monterrey. Soriana operates more than 500 supermarkets across Mexico. It purchased about 200 stores from smaller rival Gigante. It is opening 40 new stores in 2010.

* Comercial Mexicana (2009 sales: 4.5 billion dollars) is the third-largest retailer, with 231 supermarkets and 73 restaurants. Has faced serious financial problems in past couple of years. Popular on Wednesdays when it slashes the prices of fruits and vegetables.

* Grupo Comercial Chedraui (2009 sales: 4 billion dollars) was founded more than 80 years ago. 142 stores, mostly located in central and southern Mexico, and 21 stores in the USA, catering to the US Hispanic community.

* Grupo Gigante sold most of its supermarkets to Soriana in 2007, but continues to operate its discount format Super Precio, a restaurant chain and a home products store. It also has a joint venture with the USA-based Office Depot.

Chapter 22 of Geo-Mexico: the geography and dynamics of modern Mexico includes an analysis of retail patterns in the mid-sized Mexican city of Zitácuaro, Michoacán.

The short-lived Republic of the Río Grande

 Other, Updates to Geo-Mexico  Comments Off on The short-lived Republic of the Río Grande
May 272010
 

Leaders in the northern Mexican states of Coahuila, Nuevo León and Tamaulipas met in Laredo on 17 January 1840 and declared independence as the Republic of the Río Grande.  They hoped to gain independence from the central Mexican government as Texas had done in 1836. Unfortunately for the infant republic, the state legislatures in the three states did not support their rebellion.

The new government of the Republic of the Río Grande moved often to avoid being captured by the Mexican federal troops. They started in Laredo, the republic’s initial capital, but in the first few weeks moved to Guerrero, Tamaulipas. Next they moved to Victoria in the new Republic of Texas, where it remained.

The insurgent forces, under General Canales were composed of state militias from the three states and volunteers from the Republic of Texas, which was sympathetic to the cause of the Republic of the Río Grande, but unwilling to jeopardize their new independence by officially recognizing and providing troops to the Republic of the Río Grande.

The insurgents and federal forces battled several times during the middle of 1840.  When the federal forces won the March 24–25 Battle of Morales (Coahuila), the surviving insurgents, under General Canales, retreated to San Antonio, Texas.  In June, a group of insurgents under Colonel Jordan captured Ciudad Victoria, the capital of Tamaulipas, and had ideas of marching on San Luis Potosí.  Instead they marched to Saltillo and in October attacked the federal forces there. From there they retreated back into Texas.

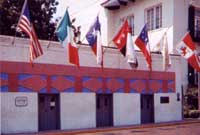
Republic of Río Grande Museum, Laredo

After that battle, it became clear that the insurgent forces could not sustain the rebellion. On November 6, 1840 the Republic of the Río Grande ended when General Canales agreed to end the rebellion in exchange for a brigadier general position in the federal army. The short-lived republic lasted a total 294 days.

Additional information is available at the Republic of the Rio Grande Museum in Laredo (photo).

The evolution of Mexico’s political boundaries is discussed in chapter 12 of Geo-Mexico: the geography and dynamics of modern Mexico.

The importance of Mexico City’s International Airport

 Excerpts from Geo-Mexico, Updates to Geo-Mexico  Comments Off on The importance of Mexico City’s International Airport
Apr 132010
 

Mexico City’s Benito Juárez international Airport handled 26.2 million passenger movements last year, making it the world’s 43rd busiest terminal, according to the Airports Council International. In terms of flights, Mexico City airport was the world’s 30th busiest, with 366,000 take-offs and landings. For freight, it was the 48th largest in the world, with 376,000 tons of cargo going through it last year. The Airports Council International is a non-profit organization which serves as the “voice of the world’s airports”.

The numbers make Mexico City airport the most important in Latin America. The on-going modernization of Terminal 1 will expand the airport’s capacity to 32 million passenger movements a year. The airport has parking spaces for 6,514 vehicles, and is served by a metro line, city bus lines, and 1,485 licensed taxis (belonging to 7 different companies). The terminal is also served by 8 mid-distance bus lines, offering regular service to the cities of Córdoba, Cuernavaca, Pachuca, Puebla, Querétaro, Tlaxcala and Toluca.

Nationwide, of the roughly 50 million air passengers each year, about half are domestic and half international. Commercial air service started in Mexico in the 1920s. The main route was Mexico City–Tuxpan–Tampico–Brownsville, Texas. By the 1930s, flights were available to Los Angeles, Cuba, Guatemala and El Salvador. Jet services to USA and European cities started in the 1960s. The routes have expanded steadily and now connect Mexico’s 29 national and 57 international airports.

Mexico City’s airport accounts for about 35% of the national total number of passenger movements, followed by Cancún (10.5%),  Guadalajara (almost 9%), Monterrey (7.4%), Tijuana (5.3%) and Puerto Vallarta (Jalisco) and San José del Cabo (Baja California Sur) each with 3.6%.

International comparisons

Mexico averages about 370 air passenger movements per year per 1000 population, compared to 2430 for the USA, 1400 for Canada, 202 for Brazil and 179 for Argentina. While air travel is growing, it remains a distant third behind automobile and bus travel.

Mexico’s transportation systems, including airports, are discussed in chapter 17 of Geo-Mexico: the geography and dynamics of modern Mexico.

Apr 052010
 

The soft drinks industry in Mexico is big business. Nationwide, there are about 250 bottling plants. Between them they produce some 300 million cases of soft drinks a year, worth about 15.5 billion dollars. The soft drinks industry may bring economic benefits to industrialists, but is is also related to public health issues. Public health experts link the rising consumption of soft drinks and processed foods in Mexico with the rapidly rising rates of obesity, especially childhood obesity, and of diabetes.

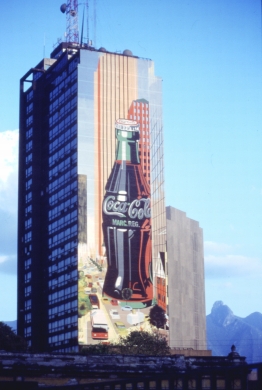
Possibly the world's largest Coca-Cola bottle, Monterrey, Mexico. Photo: Tony Burton. All rights reserved

Despite health concerns, the consumption of soft drinks in Mexico continues to rise. The per person consumption of soft drinks in Mexico has reached 160 liters a year. This means Mexico has overtaken the USA to become the world’s leading consumer of soft drinks on a per person basis, according the the Health Commission of Mexico’s Chamber of Deputies. In terms of total volume of sales, Mexico is second to the USA.

The Commission alleges that Mexico has become a “paradise” for food and drink processing firms offering products with little or no nutritive value. Alarmingly, the highest rates of increase in soft drinks consumption are in the poorer parts of the country.

A National Nutrition Survey in 1999 of 23,000 households revealed startling increases in the number of people in Mexico classified as either overweight or obese. These two categories of over-nutrition are measured by calculating the body mass index, a measure of weight adjusted for height. The percentage of women considered obese rose 160% between 1988 and 1999. In 1999 59% of women and 55% of men were either overweight or obese; by 2008 the figures were 64% and 60% respectively. Only the USA has higher rates of obesity. Even more alarmingly, the rate of childhood obesity in Mexico is also increasing rapidly. A 2002 study found that 30% of elementary school children in Mexico City and 45% of adolescents were either overweight or obese.

The increase in over-nutrition has led to rapid rises in diet-related chronic diseases such as diabetes and cardiovascular disease. The overall effects of diseases on a country’s population can be assessed by working out the disability-adjusted life years (DALY), the years of expected life lost through disease or premature death. In Mexico, the DALY lost to diseases normally thought to be more typical of the developed world such as diabetes, heart attacks and strokes is estimated to be three times greater than the DALY stemming from childhood and maternal under-nutrition.

Mexico has the highest rate of diabetes in the world, more than 11%.9 The total number of patients diagnosed with diabetes has risen seven fold since 1990. Diabetes is now the leading cause of death and costs the country more than $300 million annually, one-third of the public health care budget.

This post includes an edited excerpt from chapter 28 of of Geo-Mexico: the geography and dynamics of modern Mexico. Buy your copy today!

Mar 242010
 

Update: New Durango-Mazatlán highway officially open (Oct 2013)

Update [October 2012]: Despite earlier claims that the Durango-Mazatlán highway would be completed before the end of 2012, government officials have now confirmed that the highway will not be finished, and will not open, until sometime in 2013.

Update [5 January 2012]:

Original post:

A truly amazing feat of engineering brilliance will force the authors of Geo-Mexico to revise one of their many original maps, when preparing the book’s next edition!

Figure 17.4 of Geo-Mexico is a map using isolines to show the average driving times by road from the city of Durango to everywhere else in Mexico. The map shows that it currently takes about five hours to drive the 312 km from Durango to the Pacific coast resort of Mazatlán, whereas driving south-east for five hours can take you as far as Encarnación de Díaz, 460 km away. The reason for this difference is that the rugged mountains of the Western Sierra Madre separate Durango from Mazatlán, whereas no significant relief obstacles lie between Durango and Encarnación de Díaz.

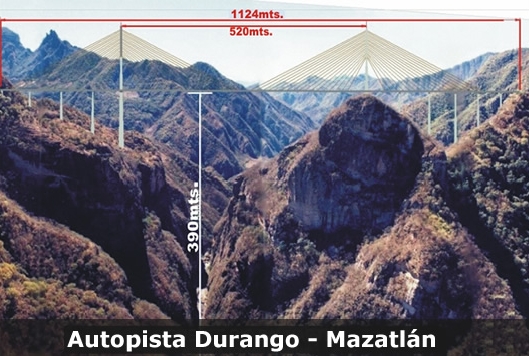
However, this pattern will change significantly once a new 1.2-billion-dollar highway between Durango and Mazatlán is complete. The four-lane, 230-kilometer-long highway is already well advanced; it will greatly reduce the travel time between the two cities. The major ‘missing piece’ remaining to be finished is the Puente Baluarte Bicentenario (Baluarte Bicentennial Bridge).

Puente Baluarte Bicentenario. Photo: TRADECO

This will be the biggest cable-stayed bridge ever built in Latin America. It is 1.124 km long and 4 lanes wide. Its central span extends 520 meters. At its highest point, it is a gravity-defying 390 metres (1280 feet) above the River Baluarte from which it takes its name. The bridge’s largest supporting pillar is 153 meters high, with a base measuring 18 meters by 30 meters.

Construction, by Mexican firm TRADECO, has required 103,000 tons of cement and almost 17,000 tons of steel. The bridge joins the states of Durango and Sinaloa and removes the need for drivers to negotiate a very dangerous stretch of highway known as the Devil’s Backbone.

Meanwhile, the authors of Geo-Mexico are busy preparing a map to show the next best example in Mexico where extreme differences of terrain influence travel times between major cities! Hopefully, the government won’t immediately use the new map in the next edition of Geo-Mexico to decide where to build their next major highway!

Mexico’s North-South economic divide weakens slightly in 2009

 Mexico's geography in the Press, Updates to Geo-Mexico  Comments Off on Mexico’s North-South economic divide weakens slightly in 2009
Mar 222010
 

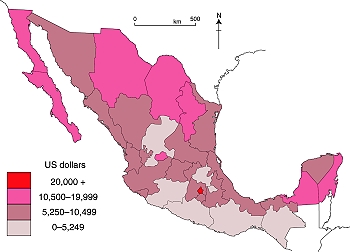
The rapid rates of economic growth in recent decades in the north of Mexico has led to a pronounced economic north-south divide, mapped and analyzed in some detail in chapter 14 of Geo-Mexico: the geography and dynamics of modern Mexico.

GDP/person in Mexico, 2007 (Color version of Fig. 14-3 of Geo-Mexico). All rights reserved.

In 2009, this divide weakened slightly. However, this was not so much a case of the south catching up but more a case of the north stumbling in its progress, due to its heavy reliance on economic ties to the USA.

Northern border states, where manufacturing is important, saw their GDP fall by more than 10% on average during 2009, according to Banamex’s Regional Economic Activity Indicators (Indicadores Regionales de Actividad Económica), published in mid-March. This decline in GDP was accompanied by a fall in employment and also by a significant fall in remittances sent home from Mexican migrant workers in the USA. It should be remembered, however, that these states all experienced marked rises in their GDP in the years immediately prior to the worldwide economic downturn.

No fewer than 29 of Mexico’s 32 states (counting the Federal District as a state for simplicity) saw their GDP decline in 2009. Only 3 states—Zacatecas, Chiapas and Oaxaca—bucked the trend and saw a rise in their GDP in 2009. In the state of Zacatecas GDP grew 1.6% (helped by a resilient construction sector), in Chiapas 1.1% and in Oaxaca 0.8%. It is noteworthy that none of these three states is particularly well integrated into the global economy. As a result, what was happening outside Mexico’s boundaries had little effect on their economic progress.

The list below gives the % change in GDP during 2009 for a sample of states, alongside the national average for comparison:

Zacatecas           + 1/6%
Chiapas               + 1.1%
Oaxaca                + 0.8%

State of México       – 5.6%
Jalisco                     – 6.0%
Federal District       – 6.4%
Querétaro               – 6.3%

National average    – 6.7%

Tamaulipas            – 7.8%
Nuevo León           – 9.3%
Baja California        -10.5%
Chihuahua              -13.6%
Coahuila                -14.4%

Mar 172010
 

Geo-Mexico looks in some detail at air quality issues in several Mexican cities, focusing on trends in carbon monoxide, ozone and microparticulates (PM10) from 1995-2008. Among other things, it concludes that,

“As a result of aggressive government efforts, the quality of air in Mexico City has improved significantly. Since 1990 the number of hours that air pollution exceeded the city’s quality standard has declined by about two-thirds. Ozone continues to be a problem as do minute particulates under 10 microns (PM10), both of which can have serious health consequences.”

Mexico City air quality in 1980. Credit: Tony Burton

In the two years since 2008, the trend towards improvement of the air quality in Mexico City has continued according to this article which has appeared in numerous newspapers including the online version of The Independent, a UK daily.

That is very good news indeed. Hopefully air quality in all Mexico’s major cities will improve over the coming decade. When last we looked, Monterrey’s air pollution statistics were still headed in the wrong direction.

Mexico’s richest individuals in 2010

 Mexico's geography in the Press, Updates to Geo-Mexico  Comments Off on Mexico’s richest individuals in 2010
Mar 122010
 

The Forbes magazine list of the world’s richest individuals in 2010 consists of 1011 individuals, each with a wealth of one billion dollars or more. Nine Mexicans (all men this year) made the list. The nine richest Mexicans are:

World rank / Name / Estimated wealth according to Forbes / Main business interests

#1 Carlos Slim Helú, 53.5 billion dollars, making him the richest man in the world. Fixed line telephone provider Telmex, cell phone provider América Móvil, Grupo Carso, Inbursa

#63 Ricardo Salinas Pliego, 10.1 billion dollars. Television company Televisón Azteca, domestic appliance store Elektra, bank Banco Azteca,
and cell phone company Iusacell

#72 Germán Larrea, 9.7 billion dollars. Grupo México – mining for copper and other minerals

#82 Alberto Bailleres, 8.3 billion dollars. Mining giant Peñoles, department store El Palacio de Hierro and Grupo Profuturo

#212 Jerónimo Arango, 4 billion dollars. Founder of Aurrerá supermarket chain and Grupo Cifra which controlled VIPS and El Portón restaurant chains, Suburbia department stores and tourist developments in Baja California Peninsula and Acapulco

#655 Emilio Azcárraga, 1.5 billion dollars. Television and media conglomerate Televisa,and Nextel cell phones

#828 Roberto Hernández, 1.2 billion dollars. Banker, one of main shareholders of Citigroup, and tourist developments in the Yucatán Peninsula

#937 (equal) Alfredo Harp Helú, 1 billion dollars. Shareholder in Citibank, telecommunications firm Avantel

#937 (equal) Joaquín Guzmán Loera (aka “El Chapo”), 1 billion dollars. Mexico’s most wanted man, head of the Sinaloa drugs cartel, the main supplier of cocaine to the US market

The combined total wealth of these 9 individuals is a staggering 90.3 billion dollars, equivalent to almost 6% of Mexico’s GDP.

The average earnings of Mexican workers registered in IMSS (Mexico’s Social Security Institute) is about 220 pesos a day or $6,300 (dollars) a year. The combined wealth of Mexico’s nine richest individuals is therefore equivalent to the total annual salaries of 14.3 million Mexicans earning this average salary!

Clearly, there are a handful of extremely wealthy individuals living in Mexico, alongside millions of Mexicans who are living at or below the poverty line. These income disparities have existed for a very long time, and are examined in detail in chapter 14 of Geo-Mexico: the geography and dynamics of modern Mexico. That chapter also analyzes the spatial patterns of wealth in Mexico, and discusses whether the gap between rich and poor has widened or narrowed in recent years.

Chapter 29 discusses Gender inequities in Mexico and  Oportunidades, a poverty reduction program (both links are to excerpts from that chapter).

Mexico’s population in 1990, 2010 and 2050

 Books and resources, Teaching ideas, Updates to Geo-Mexico  Comments Off on Mexico’s population in 1990, 2010 and 2050
Feb 082010
 

Want your very own Geo-Mexico bookmark?

This link – Population of Mexico in 1990, 2010 and 2050 – is to a pdf file of three age-sex pyramids showing the population of Mexico in the years 1990 and 2010, and the predicted population for the year 2050.

Print the file to make your own Geo-Mexico bookmark and get a fascinating insight into Mexico’s likely future population. Mexico’s population growth rate has fallen dramatically since 1990. More surprisingly, between now and 2050, the average age of people in Mexico will rise rapidly. Mexico is set to move from a predominately young population to a predominately old population in only a couple of generations.

What else can you say about Mexico’s population from a close analysis of the population pyramids? (Feel free to post your comments below)

Oil exports to USA

 Updates to Geo-Mexico  Comments Off on Oil exports to USA
Feb 062010
 

According to the US Department of Commerce, Mexico overtook Saudi Arabia to become the third largest oil exporter to the USA in 2009, behind Canada and Venezuela. Mexico’s exports of crude to the USA last year totaled almost 380 million barrels.
Mexico had been the second largest exporter of oil to the USA in 2007, but fell back to fourth in 2008.

 Tagged with:

Basic facts about Mexico

 Updates to Geo-Mexico  Comments Off on Basic facts about Mexico
Jan 222010
 

Area = 1,964,375 sq. km (758,449 sq. miles) World rank: 14
Population, 2008: 106,682,518 World rank: 11
Economy: GDP (PPP*), 2008: US$1.58 trillion World rank: 11
GDP per person, 2008: US$14,810 World rank: 70+
Length of coastline 11,122 km (6911 miles) World rank: 14
Highest point: Pico de Orizaba 5610 m (18,406 ft) World rank: na
*PPP = purchasing power parity
[Source: Table 1.1 of “Geo-Mexico, the geography and dynamics of modern Mexico.”]