The impacts of the US border wall with Mexico

 Books and resources, Teaching ideas  Comments Off on The impacts of the US border wall with Mexico
Jan 162021
 
Judy King cover

This Guardian article – ‘My neighbourhood is being destroyed to pacify his supporters’: the race to complete Trump’s wall – highlights the problems created (not solved) by US efforts to build a wall along its southern border.

Geo-Mexico is reader-supported. Purchases made via links on our site may, at no cost to you, earn us an affiliate commission. Learn more.

Judy King coverFor what it’s worth, here is my own take on the wall, written a few years ago as a short chapter for Judy King’s book, Echoes from the Wall: Real Stories of Mexican Migrants (Mexico Insights, 2019). The majority of King’s book is based on her one-on-one interviews with a varied and fascinating selection of Mexican migrants who at one time or another lived and/or worked in the US. King’s personal, in-depth approach was time consuming but was amply rewarded and she acquired some extraordinary individual accounts. The book also includes short “backgrounders” on the history of Mexican-US migration and the practicalities involved.

My chapter focused on the geography related to the wall building.

The Border Story: the effects of a barrier wall (written in 2018)

The U.S.-Mexico border is unique in terms of its geography. It is the longest land border in the world between a developed economy and an emerging economy. The continental U.S.-Mexico border (excluding offshore limits) is about 1990 miles (3200 km) long. At roughly the mid-point, the cities of El Paso and Ciudad Juárez face each other across the boundary line. East of these cities, the border follows the course of the Río Grande (Río Bravo as it is known to Mexicans) to the Gulf of Mexico; west of these cities, it crosses the Sonoran desert to reach the Pacific Ocean between San Diego and Tijuana.

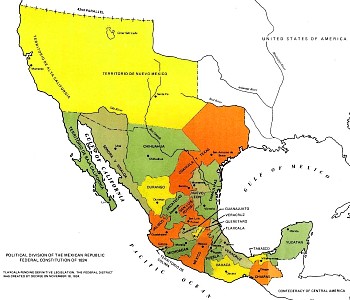
Map of Mexico, 1824

Map of Mexico, 1824

This boundary was established in the middle of the 19th century. After the Mexican‑American War (1846‑1848) the 1848 Treaty of Guadalupe Hidalgo ceded over half of Mexico’s territory to the USA. A few years later, under the 1853 Gadsden Purchase (Treaty of La Mesilla), northern portions of Sonora and Chihuahua were also transferred to the USA. This more or less established the current border between the two countries.

Minor disputes have occurred since due to the constantly migrating meanders of the Río Grande/Bravo. Flooding during the early 1860s moved the river channel south, shifting an area of about 2.6 square kilometers (1 square mile) from Ciudad Juárez in Mexico to El Paso in the U.S. Both countries claimed the area, giving rise to the El Chamizal dispute. This dispute went to international arbitration in 1911 and was only finally resolved in 1963 with the ratification of the Chamizal Treaty by President John F. Kennedy and his Mexican counterpart, Adolfo López Mateos.

A permanent memorial to Chamizal was established in El Paso in 1966 to commemorate the two nations’ laudable international cooperation, diplomacy and respect for cultural values in arriving at a mutually acceptable resolution to the conflict. A later dispute about changes in river meanders – the Ojinaga Cut – was amicably resolved in 1970.

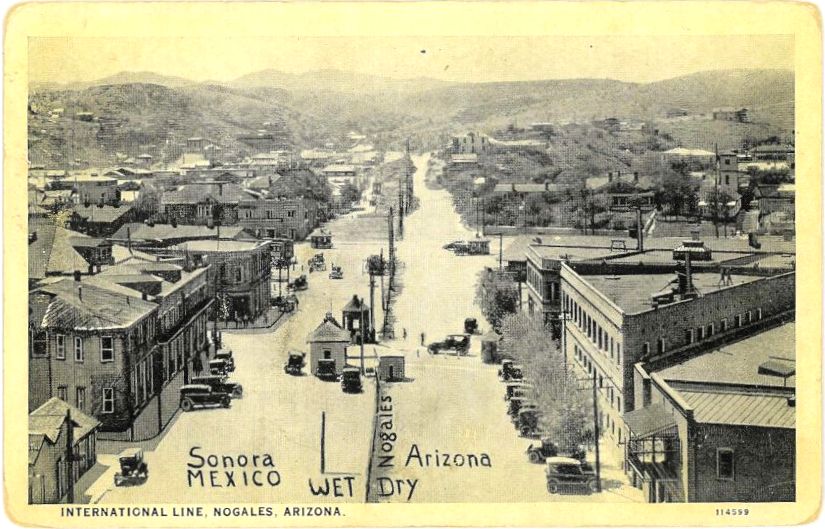
There are about fifty places where people can legally cross the U.S.-Mexico States border but only one where the cities on either side of the border have the same name: Nogales. Historically, straddling the international border was not a drawback to residents of the “Two Nogales” (Ambos Nogales).

Postcard of Ambos Nogales, ca 1915

Postcard of Ambos Nogales, ca 1915

A century ago, one street in Nogales – International Avenue – actually ran east‑west along the border, with one side of the street in the U.S. and the other in Mexico. Even before a boundary fence was erected down the middle, residents were apparently still required to cross at one of two entry points: either the Morley Avenue crossing or the Grand Avenue crossing. The 60-foot-wide avenue had been created in 1897 after all buildings close to the border were razed to the ground as a way of limiting customs fraud. A permanent border fence was built in 1918 following the Battle of Ambos Nogales (La batalla del 27 de agosto).

During the prohibition years (1919-34) in the U.S., Mexican cities close to the border benefited from an influx of free-spending visitors. These years were boom times for the bars, casinos, brothels and race tracks of cities such as Ciudad Juárez and Tijuana. These cities also did well during World War II, when many of the large number of U.S. military personnel stationed near the border were able to circumvent wartime rationing at home by hopping south.

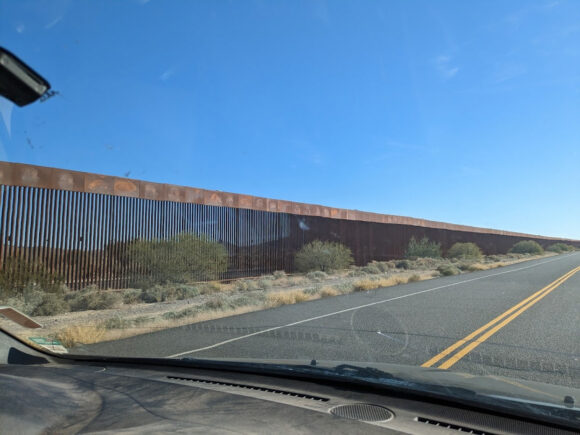
Beginning in the mid-1990s, physical barriers (fences, walls) were erected along some sections of the border to try and stem the flow of migrants from Mexico. Other sectors are closely monitored via electronic sensors, drones, cameras and mobile and satellite surveillance systems. In total, about 30% of the border already has some form of barrier, physical or virtual.

Existing barriers have already made life very difficult in many places. For example, it used to be a ten minute walk for residents of Ejido Jacume in Baja California to cross the border into Jacumba Hot Springs, California, to go to school, work, shop or attend the health clinic. With the barrier, it is now a two hour drive via Tecate.

Most of the physical barriers already built are along the western half of the border (where California, Arizona and New Mexico meet Baja California, Sonora and Chihuahua), They aim to prevent undocumented crossings into the major cities, especially San Diego and El Paso. They have forced would-be migrants to take on crossing the border somewhere in the largely unpopulated Sonoran Desert west of Nogales. The arduousness of this trip has cost the lives of many, many migrants, with the number of deaths of border-crossers since 2004, in this section alone, averaging more than 200 a year.

One of the many ironies associated with demands to build more and higher barriers between the two countries, given their extremely close social and economic ties, is that there is a simultaneous demand (in other quarters) to ease the movement of people and goods across the border in order to boost tourism and facilitate trade. For instance, in December 2015, a 120-million-dollar pedestrian bridge, known as The Cross Border Xpress (CBX), opened to allow passengers living in California to walk across the border into Tijuana International Airport. This helped ease border congestion at the existing land crossings into Tijuana.

Similarly, U.S. and Mexican border officials have piloted joint customs inspection procedures to cut border-crossing times for freight by up to 80%. Trade between the two countries is worth 1.4 billion dollars a day. The first tests of the new joint system were at Laredo international airport in Texas (for vehicle, electronic and aerospace components being flown to eight cities in Mexico), the Mesa de Otay in Baja California (for Mexican farm products entering the U.S.) and San Jerónimo in Chihuahua (for computers and other electronic exports from Mexico). The project has been warmly welcomed by business representatives on both sides of the border.

Finding the right location to build any barrier/wall may prove harder than many would anticipate. While most existing sections of barriers along the western half of the border are located very close to the true boundary line, this is not possible east of El Paso where the boundary runs (theoretically) down the deepest channel of the Río Grande/Río Bravo. Here, a wall or barrier along the boundary is impracticable.

Several protected National Wildlife Refuge (NWR) areas sit on or astride the boundary. They include the Lower Rio Grande Valley NWR and the Santa Ana NWR in Texas, the the Tijuana Slough NWR in California, and the Cabeza Prieta NWR in Arizona (the 3rd largest national wildlife refuge in the lower 48 states) which is contiguous to the UNESCO-designated World Heritage site of El Pinacate y Gran Desierto de Altar Biosphere Reserve in Sonora. In west Texas, Big Bend National Park extends to the border where it meets the Cañon de Santa Elena National Park in Chihuahua.

Ecologists have grave concerns about animal migration corridors and the future of numerous trans-border species. Up to now, only rudimentary and superficial Environmental Stewardship Plans (ESPs) have been prepared for the border areas where barriers have been constructed. These ESPs almost invariably claim that any adverse impacts on plant and animal populations will be only short-term, even in the absence of any scientific studies assessing existing populations.

Barriers such as walls prevent some species from crossing the border and can separate existing cross-border populations into two distinct groups, reducing their viability and increasing the risks of in-breeding, reducing their resilience to changes in climate or food sources. One major study identified 93 currently endangered species likely to be affected by a wall, including jaguars, ocelots, Mexican gray wolves and Quino checkerspot butterflies. Black bears in Texas that currently migrate across the border annually will have their natural territory sliced in half, as will the pronghorn antelope herds further west. Several species, including the jaguar, arroyo toad, the cactus ferruginous pygmy owl (which flies close to the ground) and Peninsular bighorn sheep, have critical habitats either side of the border.

People, too, have cross-border territories. Spare a thought for Native American groups such as the Tohono O’odham people whose ancestral lands now lie on either side of the Arizona-Sonora border. Their divided territory originated in 1853 with the Gadsden Purchase. Most of the estimated 25,000 Tohono O’odham alive today reside in Arizona but about 1500 live in northern Sonora. For decades, the two groups of Tohono O’odham, never granted dual citizenship, kept in regular contact for work, religious ceremonies and festivals, crossing the border as needed without any problem. Stricter border controls have made this impossible today.

Repeated efforts to solve the “one people‑two country” problem by granting U.S. citizenship to all registered members of the Tohono O’odham, regardless of their residence, have so far not succeeded. Ironically, because of its relatively remote location, the Tohono O’odham Nation has often been called upon to provide emergency assistance to undocumented workers (and drug traffickers) attempting to cross the border who have underestimated the severe challenges of crossing this section of the harsh Sonora desert.

Land ownership along any wall-building line is another issue. Building it on federal land is relatively easy, especially if the U.S. administration continues to utilize mechanisms that ignore, or they claim trump, dozens of existing environmental and cultural laws. Costs and protests rise where the planned barrier is located on privately-owned land.

Some sections of barrier have already been built in the wrong place. In 2008, for instance, one Native American human rights delegation reported that the official International Boundary obelisks marking the Arizona/Sonora boundary had been moved about 20 meters south during barrier construction, a clear violation of international law. Costs escalate still further whenever the barrier needs to be relocated.

The effective implementation of many cross-border agreements will be adversely affected by a barrier. For instance, the U.S. Forest Service and Mexico’s National Forestry Commission have a co-operation agreement, the Bi‑national Convention on Forest Fires, for dealing with cross-border wildfires on the Arizona/Sonora border. It aims to increase public safety on both sides of the border, reduce habitat loss, and facilitate the fighting of wildfires. It allows for a united bi‑national command to be established and for firefighting brigades, together with supporting vehicles and aircraft, to cross the border by up to 16 km (10 miles) in either direction in order to battle ongoing wildfires, provided advance notice is given. With a wall, this is clearly impossible.

Quite apart from the cost implications and the potential adverse impacts for people, communities, trade and fauna in the border regions, building a wall is not the answer. Animals may not have a viable choice after a wall is built but if people still want to cross, and can’t do so by land, they will surely turn to the air, the oceans, or (as has already happened repeatedly with smugglers in both directions) underground tunnels.

In fact, despite fear-mongering news reports in the U.S. press, the flow of migrants over the past decade has actually reversed: the number of people now crossing the border from the U.S. to live in Mexico is higher than the number of Mexicans moving north. While some of the migrants moving south are Mexicans returning home, others are estadoudienses preferring to retire, live or work in Mexico.

Judy King’s Echoes from the Wall: Real Stories of Mexican Migrants (Mexico Insights, 2019) is available worldwide via Amazon. The case studies of individual migrants are excellent starting-points for geography classes about international migration in high schools and colleges.
Mexico and Ireland: a lasting relationship forged by potatoes. Happy St. Patrick’s Day!

 Other  Comments Off on Mexico and Ireland: a lasting relationship forged by potatoes. Happy St. Patrick’s Day!
Mar 152017
 

In honor of St. Patrick’s Day, we offer this short list of references highlighting some of the more significant connections between Ireland and Mexico.

Séamus Ó Fógartaigh in his “Ireland and Mexico“, published in Irish Migration Studies in Latin America by the Society for Irish Latin American Studies (based, curiously, in Switzerland) looks at the early links between Ireland and Mexico, including suggestions that the travels of St. Brendan the Navigator may have inspired Christopher Columbus and that the famous “Plumed Serpent” of Mexican mythology may have originated from the deification of an Irish monk.

Much better known are the later links. During colonial times, several of the Spanish administrators sent to New Spain (now Mexico) were direct descents of Irish exiles to Spain. They include the 63rd and last Spanish Viceroy of New Spain Juan O’Donojú (formerly O’Donoghue) who arrived in the New World shortly before Mexico became Independent in 1821.

A generation later, Irish soldiers who chose to leave (deserted) the US army formed the backbone of Mexico’s St. Patrick’s Battalion (Batallón San Patricio) which fought the invading Americans in 1846-48. They are especially remembered for their bravery in the Battle of Churubusco (in Mexico City) in 1847. Their story is well remembered by Mexicans today, their exploits commemorated every year at a ceremony in Mexico City, and the basis of several books and the movie One Man’s Hero. The single, best account is that by Michael Hogan in The Irish Soldiers of Mexico. For a summary account, try “The St. Patricio Battalion, The Irish Soldiers of Mexico” by Jaime Fogarty, published in UNAM’s Voices of Mexico magazine, April-June, 2000.

San Patricio Melaque (Google Earth)

San Patricio Melaque (Google Earth)

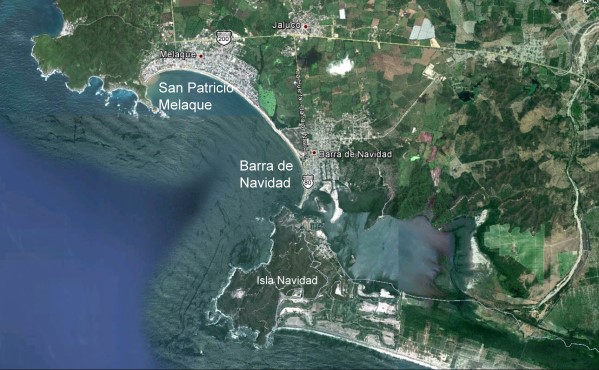
On the Jalisco coast, the small town of San Patricio Melaque (around the bay from Barra de Navidad and the Isla de Navidad tourist development) holds an annual fiesta that celebrates both the town’s patron saint and the achievements of the Irish soldiers. Nine days of activity (church services, fireworks, parades, bullfights, fairground games) come to a climax on 17 March. (It is sometimes claimed that San Patricio Melaque is the only settlement named San Patricio in Mexico, but that is not quite true, since there are at least three others: two tiny hamlets called San Patricio, relatively close to Cd. Victoria in Tamaulipas, and one named San Patricio de la Mesa in the mountains east of Hermosillo in Sonora.)

In the twentieth century, Álvaro Obregón (family name O’Brien) was President of Mexico from 1920 to 1924. (We will take a critical look at his relationship with the indigenous Yaqui Indians of Sonora in a later post). The city of Ciudad Obregón in Sonora is named in his honor. Artists of Irish descent also impacted Mexico’s national life. They included architect, painter and muralist Juan O’Gorman (1905-1982), responsible for the monumental mosaic that adorns the walls of the National University (UNAM) Library in Mexico City, and a striking, colorful mural in Pátzcuaro that depicts an erupting volcano; this mural was completed just one year before the unexpected eruption nearby of Paricutín Volcano.

Today, according to Wikipedia, there are between 300,000 and 600,000 people of Irish descent living in Mexico, mostly in either northern Mexico or Mexico City.

Dr. Michael Hogan has done far more than most to publicize the links between Ireland and Mexico.

Most of the links we’ve described might never have happened if Mexico had not sent an unwanted export to Ireland in the middle of the nineteenth century. The census of 1841 in Ireland recorded a population of about 8 million. The staple Irish food at that time was the humble potato and Ireland’s rapid population growth during the early part of the nineteenth century was based on the so-called “potato economy”.  Ireland was bursting at the seams in 1841, but just a decade later, after the potato famine, the population had fallen to 6.5 million. The cause of the Irish potato famine was a water mold (Phytophthora infestans) that originated in Mexico and crossed the Atlantic in the 1840s, reaching Europe in 1845 before rapidly spreading across the continent to reach Ireland.

If a Mexican water mold had not provoked the Irish potato famine, maybe there would have been no settlements named San Patricio in Mexico today, and no cause to celebrate St. Patrick’s Day in Mexico! Wherever you may be, have a very Happy St. Patrick’s Day!

Related links:

Trump’s U.S.-Mexico Border Wall is already almost complete

 Books and resources  Comments Off on Trump’s U.S.-Mexico Border Wall is already almost complete
Mar 242016
 

A recent National Geographic piece about the U.S.-Mexico border wall has some stunning photos of exactly what the wall looks like in various different places.

U.S. business magnate, and would-be politician Donald Trump has repeatedly promised to completely seal the U.S.-Mexico border with a wall if he is elected President, and has vowed that he would make Mexico pay for the expense. At present, the parts of the border not already walled or fenced off have security via border guards, drones and scanners.

The National Geographic article has photographs taken by James Whitlow Delano, who has visited the border several times in the past decades as the walls have gone up.

The Border Wall © 2023 Allan Wall.

One photo shows the border wall separating Jacumba, California, from Jacume, Mexico, in the high desert. Until September 2001, several years after the first border barricade was built here in the mid-1990s, “residents of Jacume could cross freely into Jacumba to buy groceries or to work, and children would be brought across to go to school or to the health clinic.” Now, what was formerly a 10-minute walk has become a 2-hour drive through the official border crossing at Tecate.

Another photo shows the infamous Smuggler’s Gulch fence, part of a 60-million-dollar project to ensure security between San Diego and Tijuana by completing a triple line of fencing.

The photos are thought-provoking images of one of the world’s most significant land borders. The situation along the border has changed dramatically in recent years. When the first fences were built, Mexican migration to the U.S. was on the rise. Now, however, the net flow of people between the two countries each year is close to zero:

For more about the U.S.-Mexico border zone, see these related Geo-Mexico posts:

May 282015
 

Remittances sent home by Mexican migrants (almost all of them residing in the USA) rose to $2.26 billion in March 2015, 7.6% higher than the same month a year earlier. This was the highest monthly figure since May 2012, and the highest ever figure for March.

The average remittance sent to Mexico in March 2015 was $311.30, the highest figure since July 2012, and the number of transfers was 7.25 million.

The March figure brought the total remittances for the first quarter of this year to $5.7 billion, 4.9% higher than the same period in 2014.

Workers in California sent remittances worth $1.59 billion home during the first three months of this year, more than the workers in any other state. Texas came in second place with $763.9 million and Illinois placed third at $199.3 million.

The three main receiving states in Mexico were:

  • Michoacán – $603 million
  • Jalisco – $539 million
  • Guanajuato – $509 million

For an introduction to the topic of remittances, with links to some of the key posts on this blog, see

A comprehensive index page listing all the posts oon Geo-Mexico related to migration and remittances can be found at Migration and remittances: an index page.

May 182015
 

We have frequently commented on the importance of migration channels linking specific towns in Mexico to particular places in the USA.

quinonesIn his latest book, Dreamland: The True Tale of Americas Opiate Epidemic, journalist Sam Quinones, one of our favorite writers about Mexico, describes the fascinating details of how one particular migration channel – from the small, nondescript town of Xalisco in the western state of Nayarit, to the city of Denver – has fueled an innovative delivery network for black tar heroin, a network that now spreads its tentacles across much of the USA.

Quinones relates the work of narcotics officer Dennis Chavez, who joined the narcotics unit of the Denver Police Department, and was determined to understand the reasons behind the escalation of black tar heroin dealing. Chavez listened carefully to his informants and a key breakthrough came when one particular informant told Chavez that while “the dealers, the couriers with backpacks of heroin, the drivers with balloons of heroin”, all looked very random and scattered, they were not. They were all connected. “They’re all from a town called Xalisco.”

Indeed they were, and the system they had set up was enterprising, innovative, and designed to avoid undue attention.

Read an excerpt:

This excerpt from Dreamland: The True Tale of Americas Opiate Epidemic, published on Daily Beast, explains how “in the 1990s, innovative drug traffickers from Mexico figured out that white kids cared most about service and convenience.”

Sam Quinones’ latest book is a gripping account of many previously murky aspects of the U.S. drug scene. It should interest anyone who wants to understand the human stories behind drug trafficking, international migration and globalization. A must-read!

Related posts:

Feb 152014
 

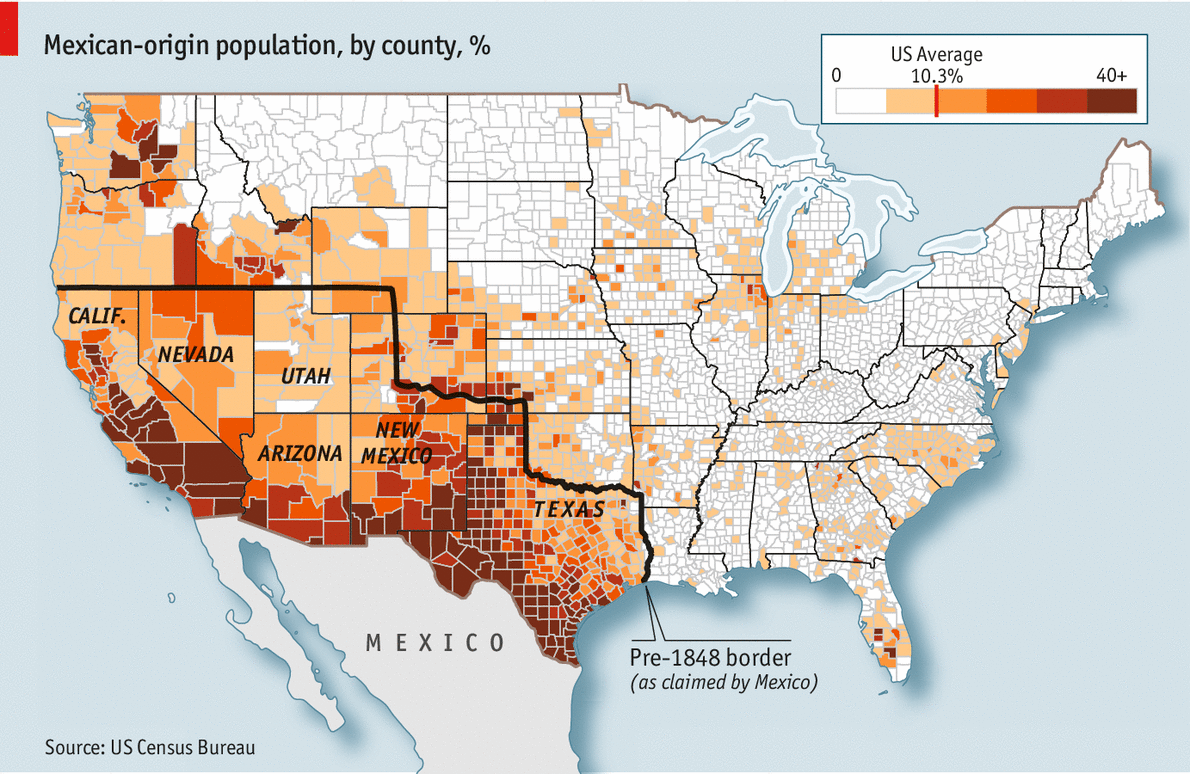
Kudos to The Economist for its short piece entitled “Old Mexico lives on” in which it points out that Mexicans and their descendents are gradually reoccupying the territory that the USA gained from Mexico in the nineteenth century. The evidence is provided by the map (below) showing “Mexican-origin population” by county for the USA. The definition is by ethnicity (origin), not citizenship.

Mexican-origin population living in USA. Source: Economist, 1 Feb 2014.

Mexican-origin population living in USA. Source: Economist, 1 Feb 2014. Click to enlarge.

In February 1848, Mexico was forced to cede more than half its territory to the USA. The area handed over included most of present-day Arizona, California, Nevada, New Mexico and Utah, plus parts of several other states. (Texas had declared its independence from Mexico in 1836).

Note the close correlation between areas that were part of Mexico prior to 1848 and those that now have the highest numbers of residents of Mexican-origin. As The Economist points out, “communities have proved more durable than borders”. Mexican migrants have been preferentially attracted to areas that were originally Hispanic, and where some residents can “trace their roots to long before the map was redrawn”. As The Economist concludes, “They didn’t jump the border—it jumped them.”

Related posts:

Remittances fell 3.75% in 2013 but look set to rise in 2014

 Mexico's geography in the Press  Comments Off on Remittances fell 3.75% in 2013 but look set to rise in 2014
Feb 062014
 

Figures from Mexico’s central bank (Banco de México) show that the value of remittances sent home by Mexicans working in the USA fell 3.75% in 2013, compared to the previous year.

Annual remittance totals in billions of dollars:

  • 2013 – 21.596
  • 2012 – 22.438
  • 2011 – 22.802
  • 2010 – 21.303

Trends in remittance payments are closely linked to trends in the US economy, so the slight fall in the past two years is no great surprise, as the US economy struggles to regain growth following the 2008 financial crisis.

There are some positive signs. Despite the decline over the year as a whole, the month of December saw remittances entering Mexico of 1.8 billion dollars, higher than any December since 2007.

In the last quarter of 2013, remittance payments were 3.46% higher than for the same period in 2012 (mainly due to a higher number of remittance payments), suggesting that remittance payments may now be on the rise again. The average amount remitted during the last quarter of 2013 was 285.34 dollars, 3.8% less than the average for the equivalent period in 2012.

Note: These remittance figures quantify only remittances sent via “formal” channels such as banks, and do not include informal payments carried directly back to Mexico by family or friends.

Related posts:

Mexicali receives more deportees than any other Mexican border city

 Mexico's geography in the Press  Comments Off on Mexicali receives more deportees than any other Mexican border city
Jan 182014
 

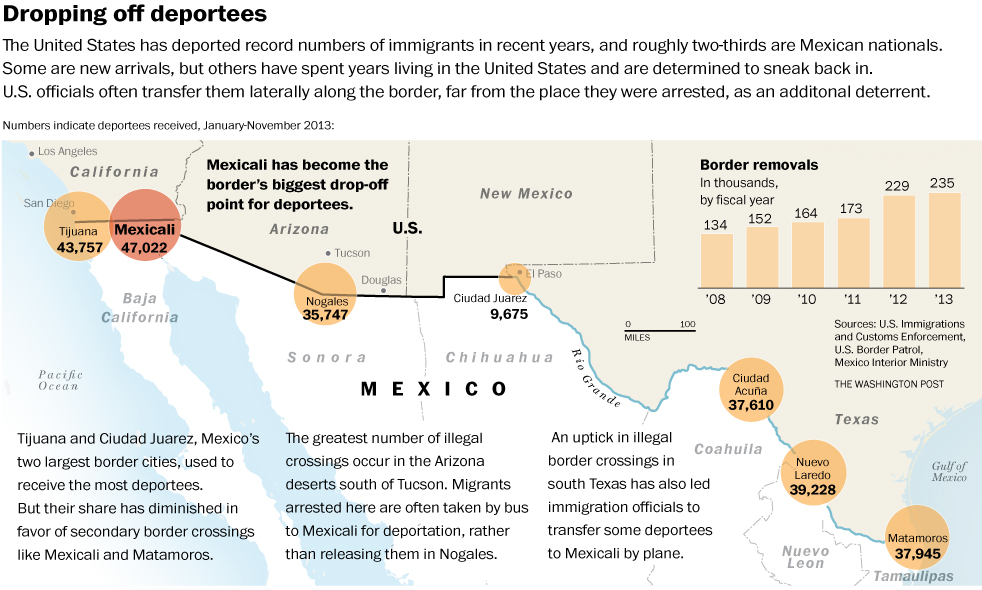
A recent Washington Post article – Mexicali has become Mexico’s city of the deported as U.S. dumps more people there – highlights the fact that Mexicali now has the dubious distinction of receiving more deportees from the USA than any other Mexican border city.

As the article points out, “Once, border cities like Mexicali (population 700,000) were flooded with newcomers trying to go north. Today, they are filling with obstinate deportees, cut off from U.S.-born children, jobs and car payments, adrift in a kind of stateless purgatory that is beyond the United States but not really in Mexico either. They face a U.S. border that is tougher and more expensive to cross than ever.”

The U.S. Immigration and Customs Enforcement (ICE) agency deported more than 400,000 migrants in the 2012 fiscal year, and close to 370,000 in 2013, about two-thirds of them to Mexico. Mexican government statistics for that time frame show that more than 110,000 were “repatriated” to Mexicali, even though it was not their point of origin, or even the closest Mexican border city to where they were detained.

According to the Mexican Ministry of Foreign Affairs (SRE) the deportees from the USA in 2012 included 13,454 unaccompanied Mexican minors under the age of 18.

This Washington Post graphic (click image to enlarge) neatly summarizes the situation.

Number of people deported to Mexico's border cities

Number of people deported to Mexico’s border cities. Click to enlarge. Credit: Washington Post.

The Washington Post article makes for some sober reflections on the plight of many of those deported from the USA, especially those individuals who have very strong family ties to that country.

The longer term social effects of such deportations are the focus of this article by Joanna Dreby, assistant professor of sociology at the University of Albany, State University of New York.

Related posts:

Dec 052013
 

After studying 22 countries with sizable retirement communities, International Living (a consultancy group) rated Mexico as the fourth most attractive country for foreigners to retire to in 2013, after Ecuador, Panama and Malaysia. The study looked at eight factors: real estate, benefits for retired people, cost of living, integration, entertainment, health, infrastructure and climate.

According to the US Census Bureau, there are 41 million people of retirement age in the USA. More than half of them have annual incomes of between 70,000 and 150,000 dollars, and they are expected, on average, to live to the age of 83; 80% are home owners. This number will swell to 72.8 million by 2030, 40% of whom may have difficulties maintaining their previous lifestyles during retirement. Given its proximity, this makes Mexico an attractive destination for many baby-boomers seeking a comfortable retirement lifestyle.

But where in Mexico will these retirees choose to live?

According to this analysis by the consultancy Aregional, there are 36 specific areas in Mexico where the real estate market is targeting US baby boomers seeking a place to retire. About half of these locations (see map) are in central and western Mexico. Locations in these regions include Guanajuato and San Miguel de Allende (both in the state of Guanajuato), Colima, Comala and Manzanillo (Colima); Chapala, Ajijic and Puerto Vallarta (Jalisco); and Nuevo Vallarta and Punta Mita (Nayarit).

Locations of retiree real estate developments. Credit: Aregional

Locations of retiree real estate developments. Credit: Aregional

Locations in northern Mexico important for retiree real estate include Rosarito, Ensenada and Los Algodones (Baja California); Los Cabos, La Paz and Loreto (Baja California Sur); Puerto Peñasco (Sonora) and Mazatlán (Sinaloa). [Kudos to RickS for noticing that Puerto Peñasco is not located very accurately!]

Retiree real estate is also prominent in several places in the south and south-east of Mexico, including  Acapulco and Punta Ixtapa (Guerrero); Huatulco (Oaxaca); Playa del Carmen and Cancún  (Quintana Roo); Puerto Progreso (Yucatán), as well as the cities of Campeche and Veracruz.

It is not known how many US retirees have already chosen to live in Mexico. While it is relatively easy to quantify the number of retiree tourists (those staying more than one night, but less than six months), it is impossible to accurately quantify the number of non-working, non-Mexicans who have chosen to relocate full-time to Mexico. Technically, these “residential tourists” are not really tourists at all but longer-term migrants holding residency visas.

Residential tourists already form a very distinct group in several Mexican towns and cities, with lifestyle needs and spending patterns that are very different from those of regular tourists. Their additional economic impact is believed to exceed $500 million a year.

A case study of residential tourism, and its pros and cons, in Chapala-Ajijic on the northern shore of Lake Chapala is an integral part of chapter 19 of Geo-Mexico: the geography and dynamics of modern Mexico.

Posts related to retirees in Mexico:

Many Mexican Bracero workers still trying to claim their pay

 Excerpts from Geo-Mexico, Updates to Geo-Mexico  Comments Off on Many Mexican Bracero workers still trying to claim their pay
Nov 302013
 

In response to severe labor needs during the second world war, the governments of Mexico and the USA initiated the Bracero guest worker program in 1942. The program enabled Mexico to contribute to the war effort by sending temporary agricultural workers to the USA. Mexicans were granted renewable six month visas to work on selected farms. Most migrants under the Bracero program came from the same three states, Michoacán, Jalisco and Guanajuato. They worked mostly in California and other states along the Mexican border.

Los BracerosAs a result of the Bracero program, some farmers in the USA became very dependent on relatively cheap Mexican labor. The program was considered a great success by farmers. Unfortunately mistreatment of Bracero laborers was widespread. In protest, the Mexican Government threatened to stop the flow of migrants. During the war many Mexicans who were not recruited under the Bracero program entered the USA illegally looking for work. Tolerance for unauthorized migration developed on both sides of the border. With a large dependency in the USA on Mexican farm workers and a large supply in Mexico, there was virtually no way to put a halt to this migration stream.

Labor unions, churches and Latino groups in the USA opposed the Bracero program on the grounds that it held down farm wages and impeded the upward mobility of US Hispanics. They convinced the US Congress to halt the Bracero program in 1964. Between 1942 and 1964 an estimated 4.5 million Mexican Bracero workers entered the USA. At its height in the late 1950s more than 500,000 workers migrated each year. Most were temporary migrants who returned to Mexico within a year, often settling in larger cities, exacerbating the flow of migrants from rural areas to the growing cities. The Bracero program set the stage for the continued high volume of Mexican labor migration to the USA.

In an effort to ensure that the Bracero workers were only temporary migrants to the USA, the US government withheld 10% of all their earnings. The US government then remitted this amount to the Mexican government for payment to the workers on their return home. More than 70 years after the Bracero program started, many braceros are still trying to claim money that they earned legitimately years ago and that is still owed to them by the Mexican government.

The struggles of temporary bracero workers who were never repaid the 10% that had been withheld, are detailed in a short October 2013 article entitled “Bracero Guestworkers, Unpaid”, written by Adam Goodman and Verónica Zapata Rivera (history doctorate students at, respectively, the University of Pennsylvania and Mexico’s National Autonomous University).

The article also describes some of the other injustices faced by Bracero workers, including forced whole-body fumigation with DDT as they crossed the US border.

For more information about the Bracero program, see The Bracero Archive

Related posts:

Remittances to Mexico from USA decline slightly in 2013

 Updates to Geo-Mexico  Comments Off on Remittances to Mexico from USA decline slightly in 2013
Nov 232013
 

Using recent World Bank data, the Pew Research Center conducted an in-depth analysis of remittances sent from the USA to Latin American countries.

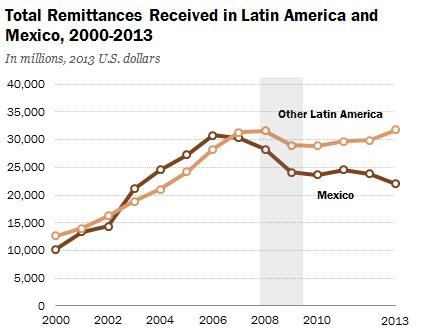
Remittances to Mexico peaked at over $30 billion in 2006, but as a result of the Great Recession, have declined by roughly 29% to an estimated $22 billion in 2013. (The analysis is based on constant 2013 US dollars).

Figure 1 of Pew Report

Figure 1 of Pew Report. Shaded area is period of recession.

On the other hand, remittances to all other Latin American countries reached almost $31 billion in 2008, declined slightly but were up to almost $32 billion in 2013 (see graph).

Note that the data are for remittances sent through formal channels such as banks and formal money transfer businesses. The average cost of sending these formal remittances is significant, an estimated 7.3% in late 2013. If all informal remittances were included, the remittances to Mexico would be an estimated 50% higher, or over $30 billion.

The study focuses particular attention on Mexico because it receives more than 40% of all remittances from the USA to Latin America. Mexico ranks 4th worldwide in total remittances, behind India ($71 billion), China ($60 billion) and the Philippines ($26 billion). These three other countries get remittances from many countries throughout the developed world while 98% of Mexico’s remittances come from the USA. The remaining 2% come mostly from Spain and Canada. No other country in Latin America receives more than 90% of their remittances from the USA. Spain is a bigger source of remittances than the USA for Argentina, Bolivia, Paraguay and Uruguay. This is a bit surprising given the horrible current economic situation in Spain. Many Spaniards are now migrating to Mexico in search of work.

The USA is by far the largest source of all worldwide remittances with $123 billion, followed by Saudi Arabia $28 billion and Canada $24 billion. However, on a per capita basis or percentage of GDP basis, Saudi Arabia, Canada and many other countries send significantly more in remittances than the USA.

The main reason why remittances to Mexico declined after 2006 is that the Great Recession very seriously hurt the construction industry, a main source of jobs for Mexican immigrants. Related to this, the overall loss of jobs in the USA meant that many immigrants returned to Mexico. In recent years it appears that more have returned to Mexico than have migrated to the USA. Thus the number of Mexican-born residents in the USA is declining very slightly for the first time since the Great Depression in the 1930s.

While remittances are extremely important to specific Mexican households, particularly rural households in western Mexico, remittances are not as important to the overall Mexican economy as they are to some other countries. Remittances account for about 2% of the overall Mexican GDP compared to 17% in El Salvador, 16% in Honduras and 10% in both Guatemala and Nicaragua.

The average amount of remittances sent by Mexican immigrants is rather low compared to immigrants from other countries. On average immigrants from Mexico over age 18 sent $2,115 in remittances per year, compared to $5,558 for immigrants from Guatemala, $5,231 for Honduras, $3,076 for Dominican Republic and $2,939 for El Salvador. We do not know if immigrants from these other countries had higher paying jobs than those from Mexico.

Source:

D’Vera Cohn, Ana Gonzalez-Barrera and Danielle Cuddington, “Remittances to Latin America Recover – but Not to Mexico”, Pew Research Center, November 15, 2013.

For more detail about remittances in Mexico, see:


“Los que llegaron”, Spanish language videos about Mexico’s immigrant groups

 Books and resources, Teaching ideas  Comments Off on “Los que llegaron”, Spanish language videos about Mexico’s immigrant groups
Oct 052013
 

Once TV México (“Eleven TV Mexico”) is an educational TV network owned by the National Polytechnic Institute (Instituto Politecnico Nacional) in Mexico City. Over the years, Once TV México programs have won numerous national and international awards.

Many of its programs are available as webcasts or on Youtube. Once TV México has made hundreds of programs that provide valuable resources for Spanish-language geography classes or for students of Spanish or anyone wanting to improve their Spanish-language skills. For example, their long-running program “Aquí nos tocó vivir” (“Here We Live”) has explored all manner of places throughout Mexico over the past 35 years, and has received UNESCO recognition for its excellence.

Of particular interest to us is “Los que llegaron” (“Those Who Arrived”), a series of programs looking at different immigrant groups in Mexico. Each 20-25 minute program focuses on a different group and explores the history of their migration to Mexico, their adaptation to Mexican life, their integration into society, the areas where they chose to settle, and the links between their home countries and Mexico.

Mexico has a long history of welcoming people from other countries, including political refugees. Each of these programs offers some fascinating insights into the challenges faced by migrants arriving in Mexico for the first time.

Sister city of Segusino, Italy

Sister city of Segusino, Italy

For instance, the program about Italian immigration to Mexico (above), explains why Mexico was seeking colonizers in the middle of the 19th century in order to populate and develop rural areas. One group of Italians settled in Veracruz (in present-day Gutiérrez Zamora); another group, 3,000 strong, and from the Veneto region in northern Italy, settled in Chipilo, near the city of Puebla. (For anyone not familiar with Chipilo, one of our favorite bloggers, Daniel Hernandez, has penned this short but memorable description of a typical Sunday morning there: Cruising in Chipilo, an Italian village in Mexico).

Italian immigration increased dramatically after the 1914-1918 war. Today, according to the program, there are approximately 13,000 Italian citizens residing in Mexico and an estimated 85,000 Mexicans of Italian descent. Note, though, that most sources quote a much higher figure for the latter category, perhaps as high as 450,000.

[Aside: In chapter 4 of “Mexican National Identity, Memory, Innuendo and Popular Culture”, William H. Beezley looks at the role of itinerant puppet theater in molding Mexico’s national identity. The largest and most famous single troupe of all was the Rosete Aranda troupe, formed by two Italian immigrants in 1850. The troupes went from strength to strength in the next half-century. By 1880, the Rosete Aranda company had 1,300 marionettes and by 1900 a staggering 5,104. Their annual tours around the country helped influence national opinions and attitudes.]

Program list for the “Los que llegaron” series:

  • Españoles (Spaniards)
  • Alemanes (Germans)
  • Húngaros (Hungarians)
  • Italianos (Italians)
  • Argentinos (Argentines)
  • Ingleses (English)
  • Japoneses (Japanese)
  • Estadounidenses (Americans)
  • Coreanos (Koreans)
  • Franceses (French)
  • Chinos (Chinese)
  • Libaneses (Lebanese)
  • Rusos y Ucranianos (Russians and Ukrainians)

Related posts:

Where do most Hispanics in the USA live?

 Other  Comments Off on Where do most Hispanics in the USA live?
Sep 232013
 

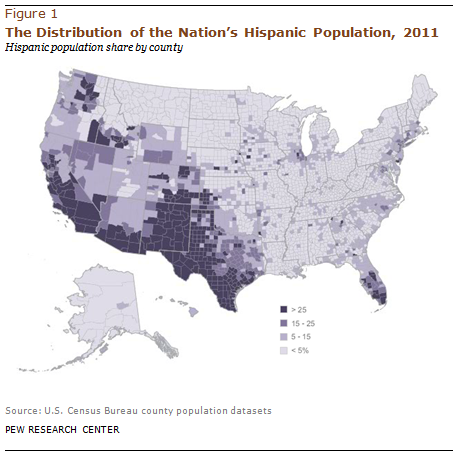
A recent study by Pew Research analyzes the geographical distribution of the over 53 million Hispanics who currently live in the USA. The “Hispanic” or “Latino” population is composed of many different segments. It includes families that have lived in the USA for numerous generations as well as recent immigrants from many countries. Mexicans are by far the largest Hispanic origin group. There are 34.7 million Mexicans in the USA accounting for 64% of all Hispanics. A future post will look at the geographic distribution of Mexicans in the USA. Several previous posts, including “Recent trends for Mexicans living in the USA”, have investigated the socio-economic characteristics of Mexicans living in the USA.

Though Hispanics are spreading throughout the country, they still tend to be concentrated in the west, particularly states that border Mexico [see map]. Almost half (46%) of Hispanics live in California (14.4 million) or Texas (9.8). Other states with relatively large Hispanic populations include Florida (3.5m), Illinois (2.1m) and Arizona (1.9m). Almost 47% of New Mexico’s population is Hispanic compared to 38% in both California and Texas.

Map of Hispanic population in USAFully 44% of Hispanics live in only 10 metropolitan areas. Almost half (46%) of the Greater Los Angeles population is Hispanic. The Los Angeles–Long Beach metro area has 5.8 million Hispanics and the neighboring Riverside–San Bernadino metro area has another 2.1 million, giving Greater Los Angeles 7.9 million Hispanics, 15% of the USA total. The New York–Northeastern New Jersey metropolitan area is next with 4.3 million Hispanics. Other metro areas with large Hispanic populations include Houston (2.1m), Chicago (2.0m), Dallas (1.8m), Miami (1.6m), San Francisco–San Jose (1.6), Phoenix (1.2m), San Antonio (1.1m) and San Diego (1.0m).

Over 80% of the Greater Los Angeles Hispanic population is Mexican. Mexicans also dominate the Hispanic populations in Houston (78%), Chicago (79%), Dallas (85%) as well as most other metro areas in the USA. In metro New York, Puerto Ricans are most numerous among Hispanics (28%) followed by Dominicans (21%) and Mexicans (12%). Puerto Ricans are also most numerous in Orlando (51%), Tampa–St Petersburg (34%), Philadelphia (56%), Boston (29%) and Hartford (69%). Cubans dominate the Hispanic population in Miami (55%), Fort Lauderdale (21%) and West Palm Beach (21%). In metro Washington DC, Salvadorians are most numerous among Hispanics (32%).

Roughly one third (36%) of all Hispanics in the USA are foreign-born; the rest were all born in the USA. Miami has the highest proportion of foreign-born Hispanics with 66%. No other metro area with over a million Hispanics has more than 43% foreign-born. On the other hand, only 17% of Hispanics in the San Antonio area are foreign-born with 83% born in the USA.

Source of data:

Related posts:

Cross-border tribe faces a tough future

 Other  Comments Off on Cross-border tribe faces a tough future
Sep 162013
 

In this post, we consider the unfortunate plight of the Tohono O’odham people, whose ancestral lands now lie on either side of the Mexico-USA border.

How did this happen?

Following Mexico’s War of Independence (1810-1821), the rush was on to draw an accurate map of all of Mexico’s territory. Mexico’s boundaries following independence were very different to today. At that time, the major flows of migrants linking the USA to Mexico were from the USA to Mexico, the reverse of the direction of more recent flows, where millions of Mexicans have migrated north.

As this map of Mexico in 1824 shows, Mexico’s territory extended well to the north of its present-day limits.

Map of Mexico, 1824

Map of Mexico, 1824

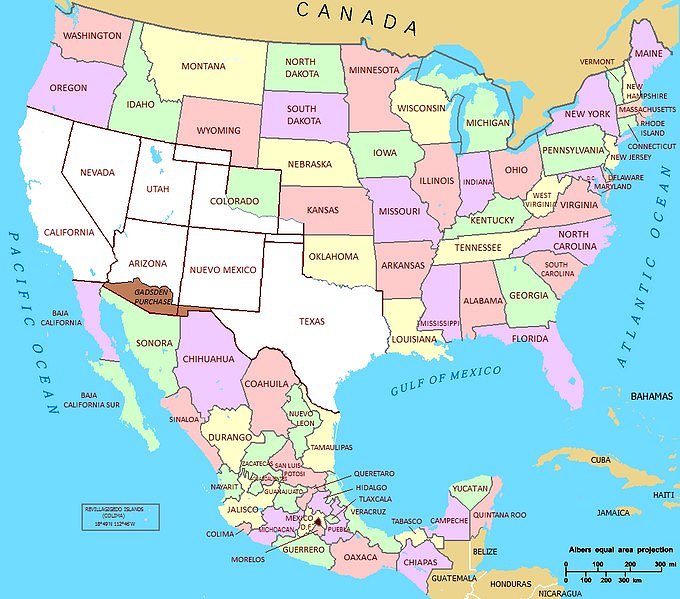
At the end of the Mexican-American War (1846-1848) the 1848 Treaty of Guadalupe Hidalgo ceded over half of Mexico’s territory to the USA. A few years later, under the 1853 Gadsden Purchase (Treaty of La Mesilla), northern portions of Sonora and Chihuahua (shaded brown on the map below) were transferred to the USA.

Mexico 1853

Source: National Atlas of the United States (public domain)

With minor exceptions since, to take account of changes in the meanders of the Río Bravo (Grande), this established the current border between the two countries.

Impacts on the Tohono O’odham people

One of the immediate impacts of the Gadsden purchase was to split the lands of the Tohono O’odham people into two parts: one in present-day Arizona and the other in the Mexican state of Sonora, divided by the international border. The O’odham who reside in Mexico are often known as Sonoran O’odham.

There are an estimated 25,000 Tohono O’odham living today. Most are in Arizona, but about 1500 live in northern Sonora. In contrast to First Nations (aboriginal) groups living on the USA-Canada border who were allowed dual citizenship, the Tohono O’odham were not granted this right. For decades, this did not really matter, since the two groups of Tohono O’odham kept in regular contact for work, religious ceremonies and festivals, crossing the border when needed without any problem. Stricter border controls introduced in the 1980s, and much tightened since, have greatly reduced the number of Tohono O’odham able to travel freely. This is a particular problem for the Tohono O’odham in Sonora, most of whom were born in Mexico but lack sufficient documentation to acquire a passport.

Tohono o'odhum border protest

Tohono O’odham border protest

Since 2001, several attempts have been made in the USA to solve the “one people-two country” problem by granting U.S. citizenship to all registered members of the Tohono O’odham, regardless of their residence. So far, none has succeeded.

The largest community in the Tohono O’odham Nation (the Arizona section of Tohono O’odham lands) is Sells, which functions as the Nation’s capital. The Sonoran O’odham live in nine villages in Mexico, only five of which are offically recognized as O’odham by the Mexican government.

The border between the two areas is relatively unprotected compared to most other parts of the Mexico-USA border.

The Tohono O’odham Nation is often called upon to provide emergency assistance to undocumented workers (and drug traffickers) from south of the border who have underestimated the severe challenges of crossing this section of the harsh Sonora desert. Tribal officials regularly complain about the failure of the U.S. federal government to reimburse their expenses.

ABC News reports (Tohono O’odham Nation’s Harrowing Mexican-Border War) that the border “has made life a daily hell for a tribe of Native Americans” and that drug seizures on the Tohono O’odham Nation’s lands have increased sharply.

Want to read more?

  • The Sonoran O’odham lieutenant governor continues to help after 16 years
  • A story passed down from generation to generation  (Lisa Palacios, a Tohono O’odham anthropology student at the University of Arizona with relatives on both sides of the border shares her grandparents’ story)

The impact of immigrants on U.S. public budgets

 Updates to Geo-Mexico  Comments Off on The impact of immigrants on U.S. public budgets
Sep 052013
 

As the US Congress debates new immigration reform legislation there is considerable confusion concerning the fiscal impact of immigrants. One side argues that immigrants pay relatively little in taxes and absorb costly benefits in terms of public health, education, welfare, etc. Others note that immigrants often pay significant amounts in taxes and get little back in terms of benefits. Obviously, it depends on the immigrant and perhaps on their legal status.

OECD-migrationIn June 2013, the OECD published “International Migration Outlook,” a study on the budgetary impacts of immigrants to OECD countries. (OECD countries Mexico and 29 other mostly rich and mainly European countries). The study compares native-born with foreign-born residents, some of whom may have already become citizens. The study suggests that immigrants may have a slightly positive impact on fiscal budgets. The average for all OECD countries was 0.3% of GDP; the comparable figure for the USA was 0.03%.

Immigrants tend to have lower incomes, pay a bit less in taxes, but receive less in benefits. They tend to be younger and thus receive less in public health benefits. If they have children, they receive considerable education benefits. Obviously these are gross generalizations as some immigrants are highly paid executives and scientists, who pay significant taxes, while others may work as domestics or laborers, paying far less in taxes. Given that many public costs, including defense and debt service, are very hard to allocate to migrants versus native-born, the study suggests that immigration appears to be neither a drain nor a gain on fiscal budgets.

A big issue in the USA is the specific impact of Mexican immigrants on the fiscal budget, particularly the impacts of undocumented immigrants. Many legal immigrants from Mexico are family members joining their relatives. They may or may not be employed and thus may not pay income taxes. On the other hand, virtually all illegal immigrants seek employment. Furthermore, many obtain formal sector jobs by using fake Social Security cards or “Individual Tax Identification Numbers.” Their employers deduct federal and state income tax from their paychecks and forward these funds to government tax agencies.

Undocumented immigrants rarely file tax returns and thus very rarely receive the tax refunds to which they might otherwise be entitled. All immigrants pay considerable amounts in gasoline and sales taxes as well as property taxes, either directly or indirectly as part of their rent. Given that most illegal immigrants are rather young, relatively healthy and without children, they may have only a small impact on public education and health expenses. Their children are often born in the US, are US citizens, and should not be considered immigrants. It appears that undocumented immigrants might be paying more into the public coffers than they receive in benefits. A closer look at the data may provide some answers.

A 2007 study by the US Congressional Budget Office (CBO) entitled “The Impact of Unauthorized Immigrants on the Budgets of State and Local Governments” directly addressed this issue. The study notes that at the Federal level roughly 50% of illegal immigrants pay income or payroll taxes, which include Medicare taxes. But they generally are excluded from such Federal benefits as Social Security pensions, Medicare and Medicaid (other than emergency services), Food Stamps, and Assistance to Needy Families. The data suggest that in general illegal immigrants usually pay more in federal taxes than they receive in benefits. On the other hand, a number of court cases mandate that state and local governments cannot withhold from illegal immigrants certain services such as education, selected health care, or law enforcement. Many illegal immigrant children do not speak English; therefore their education may be more costly.

In assessing the fiscal impact on state and local government budget, the CBO analyzed 29 reports published since 1990. The study noted that undertaking such an analysis is very challenging and involves many big assumptions. Still the CBO analysis concluded that the relatively small amount spent by state and local governments on services for illegal immigrants is not fully offset by the even smaller amount of tax revenues collected from them including federal revenues they may receive for this purpose.

In conclusion, available research suggests that the impact of immigrants on public budgets is not very clear. With respect to all immigrants, there appears to a slight positive fiscal impact according to a recent OECD study. The older CBO analysis indicates that undocumented immigrants appear to have a positive impact of the federal budget, but a negative fiscal impact for state and local governments. Of course, the impact varies enormously among migrants depending on their incomes, tax brackets, consumption patterns and needs.

Related posts:

Recent trends for Mexicans living in the USA

 Updates to Geo-Mexico  Comments Off on Recent trends for Mexicans living in the USA
Jul 152013
 

The population of Mexican origin in the USA now totals more than 33.7 million, including 11.2 million born in Mexico and 22.3 million who identify themselves as being of Mexican origin. Mexicans account for 64% of all Hispanics in the USA and 11% of the country’s total population.The changing profile of Mexicans living in the USA.

A Pew Research Hispanic Center analysis of US Census data shows that the portion of the US population that is of Mexican origin is undergoing a gradual transformation. The average age of residents of Mexican origin is becoming younger and average education levels are on the rise. In 1990, only 25% of the Mexican migrants had a high school diploma, compared to 41% today. Even so, among Hispanics, Mexicans have the lowest rate of university education and the highest percentage of people without any health insurance.

Currently, 71% of the Mexicans who live in the USA have lived in the country from more than 10 years, compared to around 50% in 1990. The proportion of migrants that is male fell slightly from 55% in 1990 to 53% in 2010.

The average household income of households with at least one member of Mexican origin was $38,884, compared to a USA-wide average of $50,502. About 49% of families of Mexican origin own their own homes, compared to a 64.6% rate for the USA as a whole.

In terms of jobs, 26.7% of people of Mexican origin living in the USA work in services, 21.1% in sales positions or offices, 18% in transportation, 17.8% in construction, and 16.4% in administration, business, science and the arts

Related posts:

Jun 082013
 

This 30 minute video (narrated in Spanish with English subtitles) looks at the vexed situation of Mexican workers that have been deported from the USA back into Mexico. About 200 migrants are deported daily. Almost all are male,. Many of them have lived for several years in the USA prior to deportation, and some have wives and families still living north of the border.

About 45% of all migrants from Mexico to the USA crossed the border between Tijuana and California. Since 1994 (Operation Gatekeeper) crossing the border has been made progressively more difficult. The border is now heavily protected with border guards given access to technology such as night-vision telescopes and a network of seismic monitors (to detect the minor ground movements that signal people walking or running through the desert). As the US economy ran into problems a few years ago, the flow of migrants north slowed down, even as authorities in the US launched more raids against undocumented workers, leading to an increase in the number of workers deported.

In the video, a range of stakeholders are given the chance to explain how they see the problems faced by deportees. A social anthropologist provides some background and academic insights; activists explain their position and how they seek to help deportees; several individual deportees share their experiences and invite us into their “homes”, precarious one-room shacks, some built partially underground, hobbit-like, in “El Bordo”, a section of the canalized channel of the Tijuana River that runs alongside the international border.

The garbage-strewn El Bordo has sometimes housed as many as 4,000 deportees. Mexican authorities are anxious to clean the area up and periodically bulldoze any shacks they find.

These personal stories of workers from interior states such as Puebla are harrowing. Many still seek “the dream” and openly admit they do not want to return to their families as a “defeated person”.

While parts of this video might have benefited from tighter editing, the accounts are thought-provoking and the video is an outstanding resource to use with classes considering the longer-term impacts of international migration.

There seems little doubt that a majority of the “residents” of El Bordo has a serious drug problem, and the video includes interviews about this issue with municipal police, deportees and aid workers, who discuss the problems and suggest some possible solutions, but ultimately, the city and state authorities have some tough decisions to make if they are to resolve this serious, and growing, humanitarian problem.

Related posts:

Mexico’s population: now over 117 million and expected to peak at about 138 million

 Updates to Geo-Mexico  Comments Off on Mexico’s population: now over 117 million and expected to peak at about 138 million
Feb 282013
 

Mexico’s population in January 2013 was 117.4 million; 57.3 million males (48.8%) and 60.1million (51.2%) females according to a December 10, 2012 report by CONAPO (Consejo Nacional de Población) in Proyecciones de la población de México 2010-2050”. By January 2014 it will grow by over a million to 118.6 million. However demographic trends indicate that population growth in Mexico is declining significantly.

The birth rate is expected to fall from 19.7 births per 1,000 population in 2010 to 14.0 in 2050. As the Mexican population ages the death rate is projected to increase from 5.6 per 1,000 in 2010 to 9.2 in 2050. Consequently the annual rate of natural population growth is expected to decline from 1.41% in 2010 to 0.48% in 2050. Extrapolating the trends from the CONAPO projection suggests that death rates will surpass birth rates sometime in the by 2070s and natural population change will become negative. Of course, we must also take emigration into account.

According to the CONAPO report net emigration from Mexico was 321,000 in 2012, though some have noted that due to the Great Recession net emigration to the USA is near zero or less [Pew Research Center’s “Net Migration from Mexico Falls to Zero – and Perhaps Less”]. CONAPO expects net emigration to peak at about 689,000 by 2020 and then gradually decline to 590,000 by 2050. Given the current low levels of emigration to the USA and the rapid growth of the Mexican economy, some feel that these levels are rather high.

As a result of trends in birth rates, death rates and emigration, Mexico’s population growth rate is declining. Annual population growth is expected to fall below a million in 2017, below 500,000 in 2032 and below 100,000 by 2049. Extrapolating the rates in the CONAPO projection, Mexico’s population growth is expected to peak in 2053 at 137.6 million and then start to gradually decline. Of course, it is very difficult to accurately project emigration figures. If emigration is a third less than projected by CONAPO, then Mexico’s population could peak at 145 million.

Related posts:


Women’s Migration Networks in Mexico and Beyond (review)

 Other  Comments Off on Women’s Migration Networks in Mexico and Beyond (review)
Nov 172012
 

As long ago as 1885, Ernst Georg Ravenstein, a German-English cartographer, proposed seven “laws of migration” that arose from his studies of migration in the U.K.

The original seven laws, as expressed by Ravenstein, were:

  • 1) Most migrants only proceed a short distance, and toward centers of absorption.
  • 2) As migrants move toward absorption centers, they leave “gaps” that are filled up by migrants from more remote districts, creating migration flows that reach to “the most remote corner of the kingdom.”
  • 3) The process of dispersion is inverse to that of absorption.
  • 4) Each main current of migration produces a compensating counter-current.
  • 5) Migrants proceeding long distances generally go by preference to one of the great centers of commerce or industry.
  • 6) The natives of towns are less migratory than those of the rural parts of the country.
  • 7) Females are more migratory than males.

These laws, though certainly not accepted uncritically, have provided a basic framework for many later studies of migration. Surprisingly, despite the wording of law 7, there has been remarkably little focus on female migration in the literature, with far more attention being paid in most studies to the migration of men.

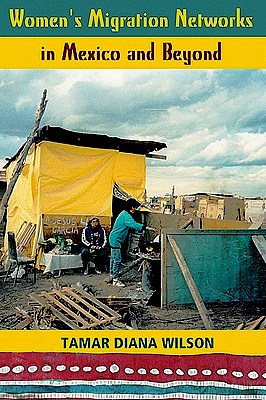
Wilson-Tamar-Diana-coverRecognizing this, anthropologist Tamar Wilson provides a detailed account of several important aspects of female migration in her Women’s Migration Networks in Mexico and Beyond (University of New Mexico Press, 2009).

Wilson’s book focuses on the experiences and thoughts of doña Consuelo [all names are pseudonyms], a woman she met while researching in Colonia Popular, a Mexicali squatter settlement, in 1988, and her daughters Anamaria and Irma.

Over a period of several years, and in small part due to marrying a man from Colonia Popular, the author was able to become an insider, invited to all family functions, helping pay for expenses of other family members for such things as tuition, gaining a unique perspective that extends far beyond that usually available to researchers. Yet, at the same time, she remained an observer, recording conversations and impressions and arranging interviews as she felt necessary in order to tease out the details relating to the migration network involved.

The book is solidly grounded in migration theory and the early chapters call heavily on secondary sources. The first chapter (Herstories) provides a useful summary of the history of Mexican migration to the USA since the mid-nineteenth century, and of the increasing participation of women in international migration from Mexico.

Chapter 2 summarizes the history of female employment in Mexico over the same time period, and changes in gender relations in recent decades, while Chapter 3 provides the theoretical background, emphasizing the key concepts of migration networks, social capital and the peculiarities of transnational migration.

Wilson summarizes the findings of previous studies as suggesting that, “Women migrants within Mexico tend to be disproportionately single and either separated, abandoned, or widowed, and single mothers tend to accompany parents. Young, single women seem to be attracted to the border by the possibilities of finding work in the maquiladoras, underscoring women’s generally ignored status as labor migrants. ” However, based on her fieldwork between 1988 and 1992, she found that  “None of the women in Colonia Popular had migrated to Mexicali in order to work in the maquiladoras, but some of their teenage daughters were employed in those assembly plants”.

Six chapters then focus on the personal experiences of doña Consuelo and her family and friends. Extensive quotations (translated into English) from interviews are linked with a clear narrative. These chapters are full of interest as the reader is drawn into the lives of the women and family members involved.

In the final chapter, Wilson draws nine general conclusions from her research:

  1. Poor women in Mexico engage in a variety of income-producing activities in both the formal and informal economies that may involve migration.
  2. Many if not most women accept the system of male domination but may opt out of an unhappy marriage if men do not live up to certain standards they consider fair. This is especially true in urban areas where women can find work.
  3. Although many women migrate under the auspices of husbands or fathers, women’s migration in Mexico can take [place independently of males.
  4. Extended family migration to a given city often also involves migration to a specific colonia or neighborhood within that city.
  5. The social capital provided by networks exists on individual, familial and community levels
  6. Strong ties can be either reinforced or weakened over time and the family life cycle, and weak tie can be converted into strong ties or abandoned. Transnational migration networks multiply in urban centers when siblings or offspring marry.
  7. Transnational migration networks can be anchored in a multiplicity of locales, including place of origin, place of anterior (internal or transnational) migration, or place of one’s current residence or that of one’s parents, spouse’s parents or other kin
  8. Adaptation networks for urban-origin migrants at destination may be, to a great extent, composed of work-site acquaintances converted into friends or ritual kin, and both friends and ritual kin may introduce migrants to future friends and ritual kin.
  9. Transnationalism involves individuals embedded in households, families and networks who, through their ability to cross borders, provide connecting links between kin in Mexico and kin in the United States.

Related posts:

Nov 152012
 

In a previous post, we quoted a press release from the Pew Hispanic Center suggesting that the net migration flow from Mexico to the USA had slowed down to a trickle, and possibly even gone into reverse (ie with more migrants moving from USA to Mexico than in the opposite direction):

We also looked at data related to the vexed question of which Mexicans, if any, may still want to move to the USA:

There are some slight signs now that the net migration flow northwards is on the increase again. According to this press article, the National Statistics Institute (INEGI) has reported that out-migration from Mexico started to rise again in the second quarter of this year.

During the second quarter, international immigration into Mexico was estimated (based on survey evidence) at 14.3 / 10,000 total population, and emigration from Mexico to another country at 41.9 / 10,000, meaning a net migration outflow from Mexico of 27.6 / 10,000.

It seems like the average age of migrants is also slowly rising. For instance, INEGI data suggest that 31% of emigrants were between 30 and 49 years of age during the period from 2006 to 2008, compared to 35% for the 2009-2011 period.

It is still far too early to say whether or not the flow of migrants from Mexico to the USA will become as strong, and involve as many people, as in the 1990s and 2000s, but watch this space.

Related posts:

Have Mexicans given up on the dream of moving to the USA?

 Updates to Geo-Mexico  Comments Off on Have Mexicans given up on the dream of moving to the USA?
Jul 092012
 

A recent post noted that net migration from Mexico to the USA has dropped to essentially zero. Does this mean that Mexicans no longer have any interest in moving to the USA? The answer to this question is complicated. Obviously, many Mexicans living in Mexico would like to join their family members in the USA if it were legally possible. Others might feel that their career ambitions or the aspirations of their children might be better served by living in the USA. On the other hand, many Mexicans in the USA might feel that their lives would be better if they lived in Mexico.

A face-to-face survey in April 2012 by the Pew Research Center of 1,200 Mexicans in Mexico sheds light on this issue. According to the survey, 56% had a favorable view of the USA, compared to 52% in 2011. Only 34% had an unfavorable view of the USA, down from 41% in 2011. The views varied significantly by age and education. Sixty percent of 18 to 29-year-olds had a positive view compared to only half of those over age 50. Fully 66% of those with a post-secondary education had a favorable view compared to less than half (48%) of those with less education.

Over half (53%) think that Mexicans who move to the USA have a better life, up sharply from 44% in 2011. This suggests that there is still considerable interest in migration. Only 14% indicated they had a worse life, down from 22% a year earlier. However, 61% said they would not move to the USA if they had the means and opportunity. On the other hand, 37% said they would move to the USA and of these 19% indicated they would move even without legal documentation. Not surprisingly, younger Mexicans and those with more education were more interested in moving to the USA.

The survey data indicate that when/if US unemployment declines and there are again ample job opportunities in the USA, many Mexicans may migrate legally or illegally to fill those jobs. Of course, employment opportunities in Mexico will be a very important factor affecting decisions about migration. While the Mexican economy has recovered from the severe recession far better than the USA, still 62% of surveyed Mexicans described the economy as “bad”, down from 75% in 2010 and 68% in 2011. But Mexicans remain optimistic, 51% say the economy will improve in the next year compared to 32% who think it will remain the same, and only 16% who believe it will be worse. The Mexicans more willing to migrate, those with higher educations and incomes, are more optimistic about Mexico’s economic future. If the gap between US and Mexican economic opportunities continues to shrink in the decades ahead, we can expect Mexicans to become less interested in moving to the USA.

Related posts:

A round-up of news items about the Mexican diaspora in the USA

 Other  Comments Off on A round-up of news items about the Mexican diaspora in the USA
Jun 162012
 

This is part of an occasional series of updates featuring news items relating to the Mexican diaspora, especially that part of it residing in the USA. Links to previous news round-ups appear at the end of the article.

Sharp drop in number of illegal border crossings

Julian Aguilar, writing for The Texas Tribune, attributes the sharp drop in apprehensions by the US Border Patrol (from about 540,000 in 2009 to 327,500 in 2011) to “a sour economy, increased enforcement by the Border Patrol and skyrocketing smuggling fees” that combine to keep “more would-be crossers at home.”

Undocumented Mexican migrants in the USA

According to a Department of Homeland Security report published in the American media, including The Economic Times, the number of undocumented Mexican migrants in January 2011 stood at 6.8 million, 59% of the total number of undocumented migrants. The total number was around 11.5 million, down slightly from the figure of 11.6 million the year before. The number of undocumented migrants peaked in 2007 at 11.8 million. The report claims that only 14% of all undocumented migrants in January 2011 had entered the USA after 2005. The figure for undocumented migrants includes more than 1 million minors.

The Pew Hispanics Center estimates that 35% of undocumented adults have been in the USA for 15 years or longer.

Mexican migrants: a million more in poverty in just four years, but rich Hispanics get richer
According to a study published by the banking giant BBVA the number of first generation Mexicans living in poverty in the USA rose from 2.6 million in 2007 to 3.5 million in 2011. Nationwide, about 15% of Mexicans live in poverty, according to US statistics, only half the 30% figure for first generation Mexican migrants. The report’s authors blame the economic crisis and steep rises in unemployment.

It was not all doom and gloom in the BBVA report. The report also found that the proportion of Mexican migrants earning less than 30,000 dollars a year fell from 30% in 1997 to 12.6% in 2011, while the proportion of migrants earning more than 40,000 dollars a year rose from only 4.7% to 15%.

Size of the Hispanic market

This ties in nicely with a study by leading market research firm Packaged Facts which found that 8.2 million Hispanic adults live in households with an income of 75,000 dollars or more. The number of “upscale Latino households” doubled between 2000 and 2010. The report estimates that the buying power of these households will reach 680 billion dollars by 2016. Noting that this group accounts for more than two-thirds of all Hispanics who annually spend $1,000 or more online, Packaged Facts suggested that retailers may wish to rethink their marketing strategies and realign advertising campaigns targeting the massive Hispanic market.

According to the Selig Center for Economic Growth, the buying power of minorities in the USA has grown into a diverse and formidable consumer market in the last decade. Jeff Humphreys, director of the Selig Center, in the Selig Center’s annual Multicultural Economy report, writes that, “In 2012, the $1.2 trillion Hispanic market is larger than the entire economies of all but 13 countries in the world.”

First generation Mexican-American children healthier than succeeding generations

A study published in the Journal of Nutrition shows that first generation Mexican-American children are thinner and eat better than subsequent generations. The study conducted by the Arnold School of Public Health at the University of South Carolina looked at 2,300 Mexican-American youth aged 12-19.

Health experts believe that the diet of first generation Mexican-Americans is closer to traditional Mexican cuisine, and is therefore relatively rich in meat, beans, fruit and vegetables. The study found that second-generation Mexican-Americans were 2.5 times as likely to be obese as their first-generation peers; third-generation Mexican-Americans were two times more likely to be obese.

Cultural identity: what’s in a name?

The Pew Hispanic Center (PHC) has published the results of a survey of 1200 Hispanic adults that explores how migrants in the USA see themselves. Entitled “When Labels Don’t Fit: Hispanics and Their Views of Identity”, the report opens by saying that,

Nearly four decades after the United States government mandated the use of the terms “Hispanic” or “Latino” to categorize Americans who trace their roots to Spanish-speaking countries, a new nationwide survey of Hispanic adults finds that these terms still haven’t been fully embraced by Hispanics themselves. A majority (51%) say they most often identify themselves by their family’s country of origin; just 24% say they prefer a pan-ethnic label.

Moreover, by a ratio of more than two-to-one (69% versus 29%), survey respondents say that the more than 50 million Latinos in the U.S. have many different cultures rather than a shared common culture. Respondents do, however, express a strong, shared connection to the Spanish language. More than eight-in-ten (82%) Latino adults say they speak Spanish, and nearly all (95%) say it is important for future generations to continue to do so.”

The PHC report makes many interesting points about migrants’ cultural identity, race, language and core values.

About half (47%) of all Hispanics say they consider themselves to be very different from the typical American. Only 21% say they use the term “American” most often to describe their identity. However, regardless of where they were born, large majorities of Latinos say that life in the USA is better than in their family’s country of origin and 87% say it is important for immigrant Hispanics to learn English in order to succeed.

Related posts:

Remittances are on the rise

 Updates to Geo-Mexico  Comments Off on Remittances are on the rise
Jun 092012
 

The annual total of remittances sent back to families in Mexico by migrant workers in the USA increased year-on-year to 22.731 billion dollars in 2011, and looks set to rise again this year.

Mexico’s central bank (the Bank of Mexico) recently released figures showing that remittances to Mexico increased in April 2012 by more than 8% compared to the same month a year earlier, bringing the cumulative total for the first four months of this year to 7.4 billion dollars, 6% higher than in the same period in 2011.

These increases in remittance flows come despite increasing evidence that the net flow of migrants leaving Mexico to work in the USA has come to a standstill:  Net migration flow from Mexico to the USA falls close to zero or has possibly reversed.

For more detail about remittances in Mexico, see:


Net migration flow from Mexico to the USA falls close to zero or has possibly reversed

 Books and resources, Updates to Geo-Mexico  Comments Off on Net migration flow from Mexico to the USA falls close to zero or has possibly reversed
Apr 262012
 

The following are extracts from the text of a press release from the Pew Hispanic Center entitled “Net Migration from Mexico Falls to Zero—and Perhaps Less“, by Jeffrey Passel, D’Vera Cohn and Ana Gonzalez-Barrera:

The largest wave of immigration in history from a single country to the United States has come to a standstill. After four decades that brought 12 million current immigrants—more than half of whom came illegally—the net migration flow from Mexico to the United States has stopped—and may have reversed, according to a new analysis by the Pew Hispanic Center of multiple government data sets from both countries. The report is based on the Center’s analysis of data from five different Mexican government sources and four U.S. government sources. [see original article for sources]

The standstill appears to be the result of many factors, including the weakened U.S. job and housing construction markets, heightened border enforcement, a rise in deportations, the growing dangers associated with illegal border crossings, the long-term decline in Mexico’s birth rates and changing economic conditions in Mexico.

Among the report’s key findings:

  • In the five-year period from 2005 to 2010, about 1.4 million Mexicans immigrated to the United States and about 1.4 million Mexican immigrants and their U.S.-born children moved from the United States to Mexico.
  • In the five-year period a decade earlier (1995 to 2000), about 3 million Mexicans had immigrated to the U.S. and fewer than 700,000 Mexicans and their U.S. born-children had moved from the U.S. to Mexico.
  • This sharp downward trend in net migration has led to the first significant decrease in at least two decades in the number of unauthorized Mexican immigrants living in the U.S.—to 6.1 million in 2011, down from a peak of nearly 7 million in 2007.
  • Mexicans now comprise about 58% of the unauthorized immigrants living in the United States. They also account for 30% of all U.S. immigrants.
  • Apprehensions of Mexicans trying to cross the border illegally have plummeted by more than 70% in recent years, from more than 1 million in 2005 to 286,000 in 2011—a likely indication that fewer unauthorized immigrants are trying to cross.
  • As apprehensions at the border have declined, deportations of unauthorized Mexican immigrants—some of them picked up at work or after being arrested for other criminal violations—have risen to record levels. In 2010, nearly 400,000 unauthorized immigrants—73% of them Mexicans—were deported by U.S. authorities.
  • Looking back over the entire span of U.S. history, no country has ever sent as many immigrants to this country as Mexico has in the past four decades. However, when measured not in absolute numbers but as a share of the immigrant population at the time, immigration waves from Germany and Ireland in the late 19th century equaled or exceeded the modern wave from Mexico.

– – – end of quotations from press release – – –

Related posts:

Why do Mexican seasonal farmworkers in Leamington, Ontario, have their own consulate?

 Other  Comments Off on Why do Mexican seasonal farmworkers in Leamington, Ontario, have their own consulate?
Jan 122012
 

The list of Mexican consulates in Canada on the website of the Mexican Embassy in Ottawa includes one massive surprise. In addition to consulates in such obvious locations as Toronto, Vancouver, Montreal and Calgary, it also includes one in the small city of Leamington in Ontario, designated to provide service to Essex County (South).

Just why is there a Mexican consulate in a city of only 31,000 people?

Tacos Tony. Photo Steve Cylka

Tacos Tony. Photo Steve Cylka (www.theblackpeppercorn.com)

Leamington, established in 1890, is a small city (population 31,000) 50 km southeast of Windsor, on the shores of Lake Erie, near Point Pelee, Canada’s southernmost point. The city is a mix of different ethnic groups. From the 1920s to the 1940s, it attracted waves of German-speaking immigrants from Europe, including some German-speaking Mennonites from Russia, as well as Italians and Portuguese. In the 1950s, it became home to returning Mennonites from Mexico, whose families had lived in Canada prior to the 1920s when they had relocated to Mexico. The city reflects its ethnic diversity, with German bakeries, an Italian fountain, Tony’s Mexican tacos, and a Lebanese Club.

For the fascinating perspectives of two generations in a single family on (im)migration, settlement, and home-making in a small city in Ontario with close ties to Mexico, see Leamington, Ontario: Bloom or Bust by Tonya Davidson and Katherine Davidson.

Leamington is home to H.J. Heinz’s second largest plant in the world. The city is Canada’s greenhouse capital, with 485 ha (1200 acres) of greenhouses which yield 500 million tomatoes a year and provide several thousand jobs, many of them seasonal. Since 1974, as many as 4000 Mexican farm laborers come to Leamington for up to eight months each year to harvest the tomatoes. They are not the latest wave of permanent migrants but belong to the Seasonal Agricultural Workers’ Program. To qualify for the program workers have to be male, married, with limited education and strong family ties back home in Mexico. When seasonal work ends, they have to return home.

Their life in Canada, a mixture of opportunity and exploitation, was the subject of El Contrato: The Contract, Min Sook Lee’s 2003 National Film Board of Canada movie. El Contrato looks in detail at the lives of two migrant workers: father-of-four Teodoro Bello Martinez and “M” who wears a mask in the movie to disguise his  identity.

At the time the film was made, Mexican farm workers worked “seven days a week, ten hours a day for a flat rate of $7.25 per hour, no overtime, no holidays”. A quarter of their salary is deducted for taxes, employment insurance, board and transportation, but anyone who gets sick or challenges their employer is sent back to Mexico. In the words of one of the workers in the film, “Slavery has not disappeared.” This hard-hitting film (dialogue in Spanish, with English commentary and subtitles) is a very valuable starting point for discussions about globalization, migration and many other aspects of geography.

Since the movie, several things have changed. The Mexican consulate in Leamington was opened in 2005,  in response to the inability of the Mexican consulate in Toronto to keep up with the need to provide consular services to migrant workers in Leamington. The migrant workers are also now supported by several migrant agricultural support centers, including one in Leamington established by Canada’s United Food and Commercial Workers Union.

Jan 092012
 

Mexico’s 2010 census found that 961,121 individuals living in Mexico had been born outside the country. In 2000 there were only about half as many (492,617). The 2010 figure is less than 1% of Mexico’s total population of 112 million. (Compare Canada where 21% are foreign-born and USA where 13% are foreign born). Of the total number of foreign-born residents in Mexico, 76.6% were born in the USA. Sadly, INEGI has not released any information relating to the country of birth of current residents who were born in countries other than the USA.

The map below shows the total number of foreign-born residents for each state.

Map of foreign-born residents of Mexico in 2010

Foreign-born residents of Mexico in 2010. Credit: Tony Burton/Geo-Mexico.

As can be seen on the map, the states with most foreigners are Baja California (about 123,000), Jalisco (84,000), Chihuahua (80,000), the Federal District (72,000) and Tamaulipas. The two states with fewest are Tlaxcala and Tabasco. (These are absolute numbers, and are heavily influenced by the relative size of each state).

Which states experienced the largest increases in foreigners between 2000 and 2010? The number of foreigners grew fastest in those states with relatively few foreigners in 2000, namely Hidalgo (up 402% over the decade), Tlaxcala (333%), Tabasco (281%), and Veracruz and Oaxaca (both with 272%).

Related posts:

How might the USA adjust to “narco-refugees” from Mexico?

 Books and resources  Comments Off on How might the USA adjust to “narco-refugees” from Mexico?
Jan 072012
 

The impacts of Mexico’s “War on Drugs” in recent years have been apparent in many parts of the country, particularly in the Mexico-USA border region. Apart from the obvious and well-documented increased levels of violence in several northern border states, we have looked briefly in a previous post at how some businesses closed their factories or offices in northern Mexico and relocated to the relative safety of Mexico City and central Mexico. Individuals living in the areas where drug-related violence has increased have also had tough choices to make, and many families have chosen to move, either to other areas of Mexico or to the USA or Canada.

Canada recorded a sharp spike in the number of Mexicans entering the country and claiming asylum on the grounds that their lives were in danger if they returned to Mexico. The number rose from 2,550 in 2005 to 9,309 in 2009, with about 10% being accepted as legitimate claims. Canada’s response to the sudden increase in applicants was to impose strict visa restrictions which made it far harder for Mexicans to enter Canada legally. The changes led to an 80% drop in the number of Mexicans applying for asylum in 2010.

Several US border cities have also experienced an influx of Mexican migrants. In Mexico’s “Narco-Refugees”: The Looming Challenge for U.S. National Security, Dr. Paul Kan, Associate Professor of National Security Studies and the holder of the Henry L. Stimson Chair of Military Studies at the U.S. Army War College, looks at how Mexican “narco-refugees” (who leave Mexico “unwillingly”) could influence US policymakers and force them to reconsider national security priorities.

Dr. Kan considers three alternative scenarios, which, he argues, “would force the narco-refugee issue onto the [US] national policy-making agenda”:

  • 1. the “new normal”, in which drug-related violence in the USA and Mexico becomes “a fact of life in relations between the two countries”, as drug gang and cartel activities spread into the USA along the corridors used to transport drugs.
  • 2. an “accidental narco” syndrome developing in Mexico, in which the Mexican government, in order to demonstrate its commitment towards lowering cartel violence,  may collude with one or more smaller cartels to help gain intelligence about the larger, more violent cartels prior to clamping down on them. Such a policy could lead to a sharp increase in the number of narco-refugees, as the core areas of stronger cartels see increasing violence as the cartels fight for survival.
  • 3. the emergence of a “Zeta state.” In this third scenario, a kind of “parallel state” emerges, in which private security firms play a much larger part as wealthy Mexicans seek to protect themselves, relying on their own resources, rather than on the government’s law and order or security forces.

As Dr. Kan emphasizes, these three scenarios are not mutually exclusive, and could coexist in different areas of the country simultaneously. Equally, some parts of the country might escape the effects of all three of the scenarios he analyzes.

Kan repeats anecdotal and other evidence which suggests that “narco-refugees” are becoming an important trend, with serious consequences for Mexico’s economy. For example, “One young Mexican executive at cement giant Cemex SAB, which has headquarters in Monterrey, said he can count at least 20 different families from his circle of friends who have left—nearly all of them for nearby Texas.” Reduced US investment in Mexico is not a good sign. According to the US Chamber of Commerce in Mexico, 25% of its members are “reconsidering their investments in Mexico as a result of worries over security”, with 16% having suffered extortion and 13% having experienced kidnappings. According to J.P. Morgan’s chief economist for Mexico, “the country likely lost approximately $4 billion in investment in 2010 when companies reconsidered such plans because of drug violence.”

At a more local level, in Ciudad Juárez, “more than 2,500 small grocery stores have closed due to extortion or because customers have left the city; the Mexican social security administration believes that 75,000 residents there have lost their jobs since 2007.”

Clearly, the impacts of Mexico’s “war on drugs” are far-reaching. Let’s hope that the situation improves in 2012, despite it being a year of federal elections in both Mexico and the USA.

Previous posts about the geography of drug trafficking and drug cartels in Mexico:

Mexican Home Town Associations (HTAs) and their considerable effectiveness

 Updates to Geo-Mexico  Comments Off on Mexican Home Town Associations (HTAs) and their considerable effectiveness
Dec 292011
 

Home Town Associations (HTAs) are associations created by migrants to promote links between their hometown communities of origin (Mexico) and their communities of residence in the USA. Many HTAs raise money (via dances, raffles, beauty pageants and other events) to fund public works and social projects in Mexico.

Mexico offers important additional funding to multiply the impact of “collective remittances” sent home from HTAs. Every dollar sent home is matched by three dollars, one from each level of Mexico’s political administration: federal, state and municipal. This means that a relatively small input of dollars from an HTA can be the catalyst to fund a school or new road.

From 1993 to 2000, investments financed by the program totaled $16.2 million, for projects ranging from street paving, irrigation and drainage to new or revamped cemeteries, parks, plazas, community centers and athletic facilities. The average cost of these projects is $56,000; almost two-thirds of projects are in communities of fewer than 2000 inhabitants.  [Source: “Migrant’s Capital for Small Scale Infrastructure and Small Enterprise Development in Mexico,” World Bank, January 2002.]

Case study of the 3×1 scheme: Atacheo de Regalado (Michoacán)

Atacheo de Regalado has a population of fewer than 2000 inhabitants, and is only 15 km. northeast of the large commercial city of Zamora, in the state of Michoacán.

Atacheo de Regalado has implemented five productive community projects under the “3 dollars for 1” scheme, based on remittances sent home from migrants in the USA, mainly in Illinois. The projects, involving 336 families, have been organized by the priests of a local church, and include a turkey farm, a goat farm, hydroponics green houses to grow vegetables and flowers for export, a factory for loudspeakers and baffles, and a bull-fighting ring. These five projects represent a total investment of about $1.5 million (dollars). The community exported 220 tons of tomatoes to the USA in 2003.

Two more projects, will need investments of about $2 million to complete, are planned:

  • 1. A rastro (meat factory) to process up to 2000 turkeys a day for sale to supermarket chains.
  • 2. A pasteurization plant for goat milk, to process up to 40,000 liters daily for export to the USA.

[This post is based on the World Bank Working Paper by Raúl Hernández-Coss, entitled “The U.S.–Mexico Remittance Corridor: Lessons on Shifting from Informal to Formal Transfer Systems”.]

Related posts:


The typical remittance, the last mile, and the effects of remittances on recipient communities

 Updates to Geo-Mexico  Comments Off on The typical remittance, the last mile, and the effects of remittances on recipient communities
Dec 262011
 

What are the characteristics of a “typical” remittance? The average remittance amount has remained fairly stable in the past decade. Migrants sending remittances do so about once every month, and send between $280 and $370 each time. Remittance amounts tend to decrease over time; migrants who have lived in the USA for a long time send fewer dollars back home than those in their first year or two. Some migrants continue to send funds back home even after living for 20 years or more in the USA. [This post is based on the World Bank Working Paper by Raúl Hernández-Coss, entitled The U.S.–Mexico Remittance Corridor: Lessons on Shifting from Informal to Formal Transfer Systems.]

The recipients

Remittance payments do not only go to Mexico’s poorest families. Recent surveys show that the there is very little difference between the monthly income of recipients of remittances in Mexico and the national average monthly income. The educational level of recipients is also close to that of the overall population.

The last mile: how do recipients receive remittances?

Depending on how they are sent, remittances can be collected by recipients in Mexico in several different places. These include banks, some department stores, post offices, casas populares (akin to credit unions), microfinance institutions, neighborhood stores and currency exchange outlets.

Effects of Remittances on Recipient Communities

These effects can be examined at a variety of scales.

At the household level, remittances are believed to have an overall positive effect on the recipient economy. Some studies have reported that remittances from the USA account for 20% of the capital invested in micro-enterprises in Mexico. The spending of remittances has a multiplier effect in local communities. On the other hand, remittances may also have some negative effects on households. Some families may become overly dependent on regular remittance payments and lose the incentive to work or improve labor skills.

At the community level, remittances from the USA are often used for community projects in the migrants’ “home” towns and villages in Mexico. This implies a much greater degree of organization (than for household-level impacts) and carries socio-political implications. There are dozens of “Home Town Associations” in the USA, each linking migrants to their home community. In many cases, these give migrants an on-going, increasingly effective, voice in the decisions taken in their home communities.

On the flip side, remittances have inflated the price of land and property in some communities, as many migrants use remittances to purchase property in their native community with the intention of eventually returning to live there. In some villages, the large houses they have built remain empty most or all of the year, too expensive to rent at local rates.

Migrants have acquired some political power. This has been recognized by the Mexican government which has introduced mechanisms allowing Mexican migrants to register and vote in presidential elections.

Case study: remittances received by Tlacolula (Oaxaca).

The city of Tlacolula, in Oaxaca, has about 13,500 inhabitants and is a marketing center for surrounding municipalities. Remittance funds sent back to Tlacolula is first used to pay off any debts incurred in financing the trip to the USA. Most of the remainder is then used to build houses. In the past decade, the value of land and building materials has risen extremely rapidly. For instance, it is reported that a 400-square-meter building plot that cost $10,000 (dollars) a decade ago now costs about $60,000. Returning migrants do not always bring savings back with them, but do bring new skills, and possibly tools, such as those required to be an electrician or plumber.

Active participants in globalization

As the World Bank study states, “The families and communities affected by remittances are active participants in globalization. In addition to exchanging funds, they maintain ties between migrants and their origins, as people move north, and money moves south. The exchange does not stop with personal family remittances. Links between communities on either side of the border are also fostered through home town associations (HTAs).” We will look more closely at HTAs in a future post.

Related posts:


What factors influence the decision about how to send remittances home?

 Other  Comments Off on What factors influence the decision about how to send remittances home?
Dec 122011
 

In an earlier post –International financial flows: how do Mexican migrants send remittances back home?– we looked at some of the ways used by Mexican migrants to send remittance payments back to their families and friends in Mexico. The World Bank study headed by Raúl Hernández-Coss (2005) breaks down the discussion about how remittance payments are made into three distinct stages (see diagram):

1. First Mile – how the sender of a remittance payment decides where and how to initiate the transfer.
2. Transfer (intermediary stage) – several financial systems combine to transfer funds.
3. Last Mile – how the recipient gains access to the funds that have been sent.

Summary of remittance flows. Source: World Bank report (details in text)

Summary of remittance flows. Source: World Bank report (details in text)

This post looks at the “First Mile“.

What factors influence the choices made by the sender of the remittances?

The World Bank researchers conclude that several factors are important considerations for the senders of remittances.

  • the ease of access to formal channels. Is there a bank or credit union close to where they live or work?
  • their level of financial awareness. Many migrants have limited experience of international financial transactions. Many do not have bank accounts.
  • the perceived reliability of the service. Many Mexican do not trust banks.
  • familiarity with the company providing the service. This is strongly influenced by “cultural” familiarity. Sending a wire transfer from a US branch of a Mexican supermarket chain, for example, might be preferred over a US bank with an unfamiliar name.
  • the desire for anonymity. Using formal channels requires photo-identification. Some migrants prefer informal channels for this reason alone.
  • their knowledge of “the Final Mile”. If they are sending funds to a remote village, far from a bank, they may opt to rely on a friend or relative carrying cash on their behalf back to their families, rather than involve their family in a lengthy and potentially costly trip to the nearest bank. This factor is becoming less of an issue. In recent years, formal banking channels have extended into many (though not yet all) small towns in the migrants’ home states in Mexico, offering recipients of remittances easier access to funds sent through formal channels.
  • the costs (see below) of the alternative transfer methods available
  • their legal status. For formal transfers, some form of photo-identification is normally required. Undocumented migrants do not normally have this option. (but see below)

Two recent trends are worth examining in more detail:

1. The declining cost of making a remittance transfer

Remittance senders have to take into account the relative expenses associated with competing transfer options. The average cost of making transfers has dropped dramatically in recent years. The sharpest falls came about a decade ago. For example, the average fee fell from $26.12 in 1999 to $12.84 in 2003, a drop of more than 50%.

Why has this happened?

  • The Mexican government has policies that encourage lower fees at the recipient’s end of the transfer.
  • Increased competition among private sector companies for a share of the international transfer market has forced prices down.
  • Improved technologies have made transfers faster (close to instantaneous), and lowered administrative costs associated with transfers [think automatic computerized systems instead of paper-pushing clerks!]

Lower prices have made it less attractive to use unregulated informal methods. In many cases informal methods are now significantly more expensive than most of the options involving a formal bank-to-bank transfer.

2. High-security consular certificates

In order to make it easier for undocumented workers to send funds back home safely, the Mexican government issues an official identity document through its consulates in the USA.

Mexican consulates began issuing these certificates as long ago as 1871! The certificates are now called the Matrícula Consular de Alta Seguridad (MCAS).  The Mexican government negotiated for their acceptance by US authorities, including homeland security.

The current high-security version of the MCAS, recognized by international law, is accepted in more than 30 states, 400 cities, 1,000 police agencies and 280 banking institutions, including Wells Fargo, Bank of America, US Bank, Citibank and HSBC. It has allowed many Mexicans to access, for the first time, formal channels for sending remittances back home.

There are four basic requirements to get an MCAS:

  • Proof of nationality (eg Mexican birth certificate, passport, or formal declaration of Mexican nationality)
  • Proof of identity (any official ID card issued in Mexico or elsewhere, including any passport, drivers licenses, voter card, official school records, etc)
  • Proof of residency (a utility bill or official correspondence with that address)
  • Payment of a processing fee of $26.

Related posts: