admin

Are Mexican females overtaking males in literacy?

 Updates to Geo-Mexico  Comments Off on Are Mexican females overtaking males in literacy?
May 142011
 

For at least the last century, literacy for Mexican males has been significantly higher than that for females. According to the 2010 census 93.7% of Mexican males aged 15 and over were literate compared to only 91.1% of females. Males have higher literacy levels in all 32 Mexican states except for Sinaloa (males – 94.1%, females – 94.7%) and Sonora (males – 96.2% and females – 96.3%). We introduced the spatial aspects of literacy in Mexico in an earlier post:

The greatest gaps between literacy among males and females are in states with relatively low literacy levels (Pearson correlation = 0.89). For example, in Chiapas male literacy is 86.0% while that for females is only 77.5% for a difference of 8.5%. Other states with large gaps are Oaxaca (87.3% – 79.4%, gap of 7.9%), Guerrero (85.4% – 79.8%, gap of 5.6%), and Puebla (91.7% – 86.8%, gap of 4.9%). The data suggest that as literacy levels in states increase, the gap between males and females should decline.

Will the gap between male and female literacy levels decline in the decades ahead? Date from the 2010 census indicates that both illiteracy rates and the gap between males and females are far greater for older Mexicans. For those over age 75, male literacy is 71.2% while that for females is only 62.3% resulting in a gap of 8.9%. The gap is 8.4% for those between 60 and 74 years of age (83.3% versus 74.9%) and 4.4% for the 45 – 59 age group (93.1 versus 88.7%). The gap for those between 30 and 44 years of age is only 1.1% (96.4% versus 95.3%) and for the 15 to 29 age group, males and females are equal at 98.1%.

Does this trend suggest that female literacy will surpass male literacy in the future? The answer to this question appears to be yes. Data from the 2010 census on children between ages six and 15 indicates female literacy (87.32%) is already 1.33% higher than male literacy (85.98%). These levels seem rather low because literacy levels for children below age ten, particularly males, are generally lower. For example, among children age seven, literacy for females is 3.06% higher than that for males (73.91% versus 70.85%). That nearly 30% of seven-year-olds are illiterate suggests a problem; but most of these will become literate by age 15. Among children between age 14 and 15, female literacy is 98.40% compared to 98.09% for males.

The census provides data on the literacy of children for each age between age six and 15 for all 32 Mexican states. Literacy rates for female children are higher than those for males in all 288 observations (9 age groups times 32 states), expect for five (ages 11, 12, 13 & 14 in Chiapas and age 12 in Tlaxcala).

The largest gap between females and males is 4.6% for six-year-olds in Zacatecas (females – 43.51%, males – 38.91%). Other large gaps exist for seven-year-olds in Zacatecas (4.41%), six-year-olds in Querétaro (4.37%), seven-year-olds in Tamaulipas (4.34%), and seven-year-olds in Tabasco (4.33%). These findings are consistent with other evidence indicating that females develop language skills at younger ages than males. The data clearly indicate that female literacy is surpassing male literacy. Perhaps more importantly, both males and females are now approaching universal literacy.

We assume that the literacy gap between female and male children will continue in future decades. After a decade or two, we expect adult literacy rates for females to catch and surpass those for males. On the other hand, this gap will be very small because Mexico is quickly approaching universal literacy. When data become available we will analyze the gap in total years of education between females and males. We expect the situation in Mexico to move slowly towards the pattern in the USA, where females now have more years of education and more university degrees than males.

Literacy rates are, of course, only one of the many aspects of gender inequality in Mexico.

Why did CONAPO underestimate Mexico’s population by almost two million people? Mexico’s changing population dynamics

 Updates to Geo-Mexico  Comments Off on Why did CONAPO underestimate Mexico’s population by almost two million people? Mexico’s changing population dynamics
May 122011
 

Making population projections is risky business. Birth and death rate trends can change unexpectedly. Perhaps more difficult to forecast accurately, in Mexico’s case, are international migration rates. The most recent official population projection available from the Mexican Government’s CONAPO (Spanish acronym for National Population Commission) website estimates that the Mexican population will peak at 130.3 million in 2044, before declining gradually thereafter. However, this projection is many years old, and does not incorporate the data from the 2010 Mexican census, nor the impact on immigration of the employment recession in the USA.

CONAPO projected that Mexico’s total population in 2010 would be only 110,619,340, about 1.7 million fewer than the 2010 census figure of 112,336,538. Their estimate for net migration for 2005 to 2009 was 2,012,904, which is quite close to the more recent Pew Hispanic Center figure of 2,036,000 (“Mexican Immigrants: How Many Come? How Many Leave?” July 22, 2009). The Pew numbers are limited to net Mexican migration to the USA, but that migration stream represents almost all Mexican migrants.

However, the two sources have very different values for individual years. The CONAPO net migration projection gradually increased from 400,000 in 2005 to 405,000 in 2009, peaking at 406,000 in 2011 and gradually declining to 303,000 in 2050. The more current Pew estimates reached 547,000 in 2006-2007, before declining to 374,000 for 2007-2008 and only 203,000 for 2009-2009. Current evidence and continued lack of real job opportunities for Mexicans in the USA suggests that net migration has stayed at about this level for the past few years.

The CONAPO projection forecasts that the Mexican rate of natural population increase would decline gradually from 1.39% per year in 2005 to 0.06% per year in 2050. The average of the values they used for 2005 to 2010 was 1.313% per year. Using the actual 2010 census figure and the Pew migration numbers, we calculate that the actual average rate of natural increase for 2005 to 2010 was 1.443%. This suggests that the actual rates of natural increase were about 10% higher than the values used in the CONAPO projection. Apparently, birth rates in Mexico did not decline as fast as expected by CONAPO, consequently their estimate of Mexico’s 2010 population was significantly less than the census figure.

In a later post, we will attempt to update the existing CONAPO projection using the 2010 census figure, more recent net migration values and adjusted natural increase rates.

More problems for residents of Valle de Chalco on the south-eastern edge of Mexico City

 Mexico's geography in the Press  Comments Off on More problems for residents of Valle de Chalco on the south-eastern edge of Mexico City
May 112011
 

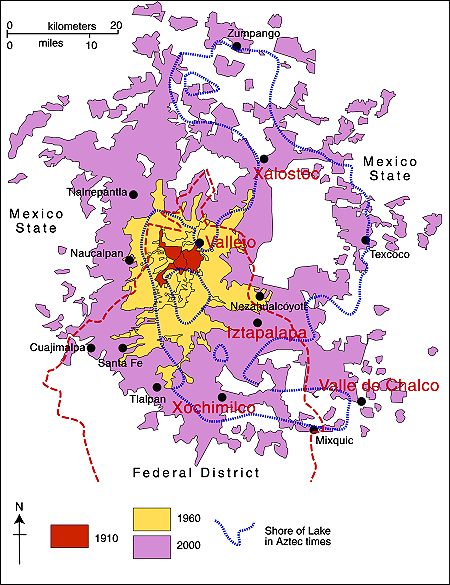
More than 200 homes in the low-income settlement of Valle de Chalco on the south-eastern edge of Mexico City, in the State of México, were flooded by raw sewage last month. The affected homes were in San Isidro and La Providencia, in Valle de Chalco (see map).

Mexico City cracks map
Locations in Valley of Mexico with high incidence of ground cracks. Cartography: Tony Burton; all rights reserved.

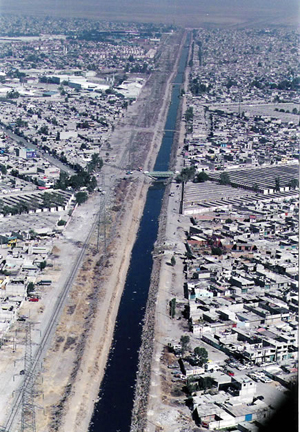
At least 500 residents faced a grim clean-up following several days of flooding. The problem was caused by a 30-meter-long crack in a surface sewage canal known as the Canal de la Compañia. The crack allowed 6,000 cubic meters a second of raw sewage to inundate nearby streets and homes. The federal water authority, Conagua, said that it would take three weeks to complete repairs to the canal wall.

Canal de la Compañia, Chimalhuacán

Canal de la Compañia, Chimalhuacán

The canal wall is thought to have been put under too much pressure due to the unfortunate combination of unusually heavy rains and a blockage occasioned by accumulated garbage such as plastic bags. It is possible that continued ground settling –More ground cracks appearing in Mexico City and the Valley of Mexico – also contributed to the problem. José Luis Luege Tamargo, the head of Conagua, placed much of the blame for the most recent flooding on the local municipal authorities of Ixtapaluca for not having ensured that no garbage was dumped anywhere in or near the Canal.

The 260 families and small businesses affected were all given some immediate financial assistance via 20,000-peso payment cards valid at any Soriano supermarket. In addition, authorities have pumped out basements and begun an emergency vaccination campaign.

The Canal de la Comañia’s walls have failed three times in the past decade, with serious flooding each time; the most recent disaster was in February 2010, when 18,000 people were forced to flee the rising wastewater. Conagua has reportedly proposed a more permanent remedy involving the rerouting of 7 km (almost 5 miles) of canal. The project would take two years to complete, with an estimated cost of 300 million pesos ($25 million).

Access to services is worst in the smallest rural localities of Mexico

 Updates to Geo-Mexico  Comments Off on Access to services is worst in the smallest rural localities of Mexico
May 102011
 

Access to services such as schools, public transport or the internet are better in cities than in rural areas (localities in Mexico with fewer than 2,500 inhabitants). However some rural areas have far better access than others. Perhaps not surprisingly, the number of inhabitants of a rural locality is directly related to its access to services.

The 2010 census indicates that 26.0 million Mexicans (about 23.2% of the population) live in rural areas. A total of 9.0 million live in Mexico’s 5,921 large rural communities (those with 1000–2499 inhabitants) compared to 11.3 million living in the 22,852 mid-sized rural localities (250–999 people) and 5.7 million in the 159,820 small rural settlements (fewer than 250 residents). The average population in the last group is only 36 inhabitants indicating that many Mexicans live in very tiny communities.

The percentage of communities with access to a health center or clinic is 74.9% for the large rural areas, 50.7% for the mid-sized, and only 37.9% for the small rural areas. The percentages for access to either a secondary school or telesecundaria (Mexico’s satellite-fed secondary schools, see Geo-Mexico, page 126) also differ with the size of the community: 79.6%, 51.5% and 27.0%, respectively. Though these percentages are far lower than those for larger, urban communities, they have improved very significantly. The census indicates that rural areas are catching up with the rest of Mexico, especially with respect to education, life expectancy and fertility, three very important, inter-related variables.

In turn, this suggests that government programs such as Oportunidades are achieving something positive in some areas beyond poverty reduction.

The network of roads providing access to rural villages has improved significantly. 81.2% of the smallest localities now are connected by road, compared to 96.7% for the mid-sized and 98.3% for the large rural areas. However, these data indicate that almost 31,000 rural Mexican communities are still not accessible by road. Only 63.5% of the small rural villages are served by public transport, compared to 74.6% of the mid-sixed and 89.3% of the large rural localities. A total of almost 107,000 rural communities do not have any public transport and are consequently quite isolated. This isolation is a very serious constraint to their economic opportunities and quality of life. The people who live in communities without access to a paved road are among Mexico’s poorest; fully 88% are classified as “very marginalized” (see Geo-Mexico, page 184).

Internet access is only beginning to penetrate into rural areas. Only 3% of the smallest rural villages have public access to the internet (via school, cybercafé, etc.). About four times as many (11%) of mid-sized rural localities have public internet access. Almost half (45.6%) of the large rural communities have public internet access compared to 74.3% of larger communities between 2500 and 4999 inhabitants. Current trends suggest that by 2020, virtually all Mexicans will have some type of internet access, perhaps by cell phone.

Fertility decline not as fast as expected, but faster in some areas of Mexico than others

 Updates to Geo-Mexico  Comments Off on Fertility decline not as fast as expected, but faster in some areas of Mexico than others
May 092011
 

Data from the 2010 census indicate that the fertility rate did not decline as fast in the last decade as previously expected. On the other hand, the actual reduction was significant and consistent with Mexico’s demographic transition which will lead it to zero natural population growth by mid-century. See our 15 May 2010 post: Mexico’s demographic transition and flirtation with overpopulation.

At mid-decade Mexico’s National Population Council (CONAPO) projected that the total fertility rate would decline to an average of 2.1 children per women for the 2010 census. The new census data indicate that the fertility rate for 2009 was actually 2.4 compared to 2.9 in 1999. This decline is still significant but not quite as rapid as previously expected.

Fertility rates vary greatly for different areas of the country. Like many other socio-economic variables, fertility is closely related to community size. It declines systematically with increasing community size. Rural areas (localities of less than 2,500 population) had the highest rate of 2.9 in 2009, equal to the national level in 1999. If this ten year lag relationship continues, we might expect the fertility rate in rural areas in 2019 to be equal to the 2009 national rate of 2.4. The fertility rate in rural areas declined the fastest in the past decade, a full 24% from their 3.8 rate in 1999.

Towns between 2,500 and 15,000 dropped 16% from 3.1 to 2.6. Small cities between 15,000 and 100,000 declined by 14% from 2.8 to 2.4, the national average. For cities of over 100,000 the 2009 rate was 2.1 (the theoretical replacement level), compared to 2.4 in 1999.

The Federal District has the lowest fertility rate by far, for example women between age 35 and 40 have had an average of 1.8 children compared to the national average of 2.5. Using this measure, other states with low fertility levels include Nuevo León with 2.3, followed by Baja California Sur, Colima, State of Mexico, Morelos, Quintana Roo and Yucatán with 2.4. The highest fertility rates are in Chiapas and Guerrero where women between age 35 and 40 have had 3.2 children on average, followed by Oaxaca with 2.9.

The demographic transition model and its application to Mexico is described in depth in chapter nine of “Geo-Mexico; the geography and dynamics of modern Mexico”.

The on-going transformation of Mexico City

 Mexico's geography in the Press  Comments Off on The on-going transformation of Mexico City
May 082011
 

A feature article in thestar.com (link below) summarizes some of the reasons behind our long-held view that Mexico City has started, and is still undergoing, a noteworthy transformation. Change is happening not only in the urban fabric but in many aspects of the daily lives of “capitalinos“, the most polite of the various  terms used in Mexico for residents of Mexico City.

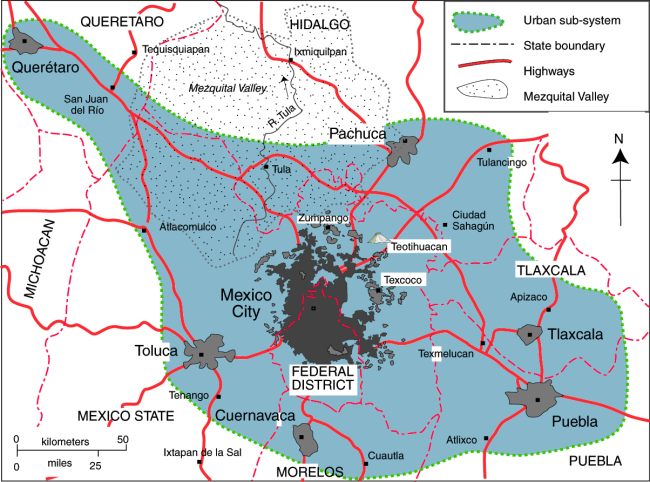
Map of Mexico City urban system

Map of Mexico City urban system. Click to enlarge. All rights reserved.

We will continue to offer occasional updates on the transformation taking place in Mexico City in future posts. Previous posts on this blog have examined many different aspects of Mexico City’s on-going transformation:

Mexico’s cities and towns are analyzed in chapters 21, 22 and 23 of Geo-Mexico: the geography and dynamics of modern Mexico. Buy your copy today!!

Our top 10 list of “googled” phrases which led to Geo-Mexico.com

 Other  Comments Off on Our top 10 list of “googled” phrases which led to Geo-Mexico.com
May 072011
 

Our trusty server stats include these “top ten” search phrases. Each of them (when entered into a certain famous leading search engine) magically brought one or more viewers to Geo-Mexico.com:

  • 10- parangaricutiro tongue twister – our post Geographic tongue-twister relating to a volcano explains this tricky-to-pronounce search
  • 9- what kind of aztec indian would you have been if u lived in El Salto mexico – perhaps an Aztec Indian?? Or, given the qualifier of “El Salto”, possibly a leaping Aztec Indian? [salto = jump or waterfall]
  • 8- what are the five countries in Mexico – We acknowledge that Mexico has suffered national identity crises various times in its tumultuous history, but fortunately never quite to this extent!
  • 7- are canada and Mexico equally linguistically diverse -Even counting the languages spoken by the various “First Nations” groups (as Canadians call their native peoples), Mexico wins this one easily. Some 60+ languages (not dialects) are spoken in Mexico
  • 6- what kind of cars do mexican cartels drive – hmm…hopefully, NOT the car you were driving just before they stopped you at a fake roadblock and took your set of wheels! [Unfortunately, this tactic has been used by drug cartels all too frequently in the past couple of years.]
  • 5- non churches in the 1600s – this intriguing concept needs narrowing down slightly before we can venture a more detailed response
  • 4- mexican cartel 1911 – possibly this was meant to be 2011 not 1911. However, Pancho Villa would indeed have been a powerful cartel leader, given half the chance; his cross-border excursions would have been very useful in that line of work, though his preferred method (horseback) was nowhere near as imaginative as the tunnels, catapults, aircraft and mini-subs used by cartels in 2011
  • 3- geographical routes from mexico to US – beyond the obvious road, railway and airline routes, we think “Geo-Mexico, the geography and dynamics of modern Mexico” has this well covered, since our chapters are clearly linked to the four major traditions of geography in the USA, and the five themes identified by the Association of American Geographers and the National Council for Geographic Education in 1984 for the teaching of geography – click the link to buy your copy today!
  • 2- names of all the volcanoes in mexico – definitely a challenging request. Assuming all categories—active, dormant and extinct—are included, the number must certainly run well into the hundreds
  • 1- spanish speaking states in mexico map – The answer to this, or the parallel question of “How many English-speaking states are there in the USA?”, might not be as obvious as it appears. However, to clear up any possible confusion, click HERE for our map of Spanish-speaking states in Mexico, and HERE for a fascinating, interactive map showing the distribution of Spanish-speakers (and other languages) in the USA. Zoom in for detailed views of individual states.

Our previous “Top Ten” list:

The Battle of Puebla is re-enacted each year on Cinco de Mayo (May 5), but in Mexico City

 Other  Comments Off on The Battle of Puebla is re-enacted each year on Cinco de Mayo (May 5), but in Mexico City
May 052011
 

The Mexican holiday of Cinco de Mayo (5 May) commemorates the Battle of Puebla, fought on May 5, 1862. Puebla is a major city about 100km east of Mexico City, on the historically important route to the port of Veracruz.

In 2012, to mark the 150th Anniversary of the Battle of Puebla, a major re-enactment of the Battle was held in Puebla, attended by the President and many cabinet members and officials. A commemorative bi-metallic 10-peso coin was also issued to commemorate this anniversary.

Since the 1930s, a re-enactment of the Battle of Puebla has been held each year at Peñón de los Baños, a rocky outcrop close to Mexico City’s international airport. Of geographical and geological interest, the rocky outcrop of Peñón de los Baños was formerly an island in the middle of Lake Texcoco. The prominent landmark was visited by Alexander von Humboldt when he toured parts of Mexico in 1803-4. Among other things, Humboldt analyzed the chemical composition of its thermal springs, thought to have curative and medicinal properties.

The re-enactment of the Battle of Puebla at Peñón de los Baños attracts tourists, history buffs, and Mexico City residents looking for an unusual experience.

Re-enactment of Battle of Puebla.

Re-enactment of Battle of Puebla. Photo credit: Jose Carlo González (La Jornada)

In an earlier post, we noted that the Cinco de Mayo holiday is less celebrated in Mexico these days than in the USA:

Celebrations of 5 May in the USA date back to the third quarter of the nineteenth century (only a few years after the Battle in 1862), though they gained prominence only after the 1950s and 60s when major Mexican beer makers associated their brands with Cinco de Mayo celebrations north of the border.

Mexican beer may be one of the country’s most important exports but, as the annual re-enactment in Peñón de los Baños shows,  the commemorations of Cinco de Mayo still held on Mexican soil are far more authentic.

Mexico’s population keeps growing, but at a slower pace

 Updates to Geo-Mexico  Comments Off on Mexico’s population keeps growing, but at a slower pace
May 052011
 

The 2010 census indicates that since 1960 Mexico’s population has more than tripled to 112.3 million. However, the growth rate between 2000 and 2010 (1.4% per year) is less than half the 3.4% rate of increase experienced in the 1960s. If Mexico’s population had continued to grow at 3.4% since 1960, it would have been over 186 million by now!

Population growth has slowed because the fertility rate has declined dramatically. The total number of children born per women dropped from about 8 in 1960 to 2.9 in 1999 and 2.4 in 2009. It is expected to reach the replacement level of 2.1 by 2010. The fertility rate dropped in the last ten years for women in all age groups. It dropped an impressive 54% for women aged 45 to 49 and 28% for women aged 40 to 45. However, women in these age groups have relatively few babies. Fertility in the prime childbearing age groups; 20 to 24, 25 to 29 and 30 to 35; decreased by 15%, 18% and 15% respectively. The smallest drop was 12% for females ages 15 to 19, suggesting that the incidence of teen pregnancies may remain an issue.

Increased female education is closely linked with fertility reduction. The 2010 census indicates that women with university education had an average of 1.1 children, whereas those who completed secondary school had 1.6 children. Those completing only primary school had 3.3 children, while women with no formal  education had 3.5 children. Because these women may have additional children in the future, these numbers are not directly comparable to the total fertility rates referred to earlier.

With female education levels rising and total fertility rates declining, worries about “overpopulation” in Mexico do not seem warranted at this time. As we have stressed elsewhere, the really significant characteristic of Mexico’s population is no longer how rapidly total numbers are growing, but how rapidly the average age is rising as the population ages. An earlier post here includes a link to a pdf file showing Mexico’s predicted population pyramid for 2050, which shows just how fast Mexico’s population will age if present trends continue. The changing age distribution will require substantial shifts in public services over the next 20-30 years.

Related posts include:

Several chapters of Geo-Mexico: the geography and dynamics of modern Mexico discuss additional insights into Mexico’s population dynamics and trends, and their implications for future development. Buy your copy today!

May 032011
 

Somewhat surprisingly, the number of Mexicans speaking indigenous languages has increased significantly in the past 20 years. In 2010 there were 6.7 million indigenous speakers over age five compared to 6.0 million in 2000 and 5.3 million in 1990.

There are two factors contributing to this finding:

  • First, indigenous speakers are teaching their children to speak their indigenous language.
  • Second, indigenous speakers have higher than average birth rates.

The number of indigenous speakers that cannot speak Spanish decreased slightly from 1.0 million in 2000 to 981,000 in 2010.

The most widely spoken indigenous languages are:

  • Nahuatl, with 1,587,884 million speakers, followed by
  • Maya (796,405),
  • Mixteca (494,454),
  • Tzeltal (474,298).
  • Zapotec (460,683), and
  • Tzotzil (429,168).

[Note: language names used here include all minor variants of the particular language]

About 62% of all indigenous language speakers live in rural areas, communities with under 2,500 inhabitants. Nearly 20% live in small towns between 2,500 and 15,000, while about 7% in larger towns, and 11% live in cities of over 100,000 population. Indigenous speaking areas tent to have low levels of development. Over 73% of the population In Mexico’s 125 least developed municipalities speak an indigenous language.

States with the most indigenous speakers tend to be in the south. In Oaxaca, almost 34% of the population over age three speak an indigenous language followed by Yucatán (30%), Chiapas (27%), Quintana Roo (16%) and Guerrero and Hidalgo (15%). States with the fewest indigenous speakers are Aguascalientes and Coahuila (0.2%), Guanajuato 90.53%) and Zacatecas (0.4%).

A total of 15.7 million Mexicans over age three consider themselves indigenous. Surprisingly, 9.1 million of these cannot speak any indigenous language. There are 400,000 Mexicans who can speak an indigenous language, but do not consider themselves indigenous.

Related posts:

Chapter 10 of Geo-Mexico: the geography and dynamics of modern Mexico is devoted to Mexico’s indigenous peoples. Many other chapters of Geo-Mexico include significant discussion of the cultural and development issues facing Mexico’s indigenous groups.

Cultural adaptation: the Cinco de Mayo holiday is far more widely celebrated in the USA than in Mexico

 Other  Comments Off on Cultural adaptation: the Cinco de Mayo holiday is far more widely celebrated in the USA than in Mexico
May 022011
 

The Mexican holiday of Cinco de Mayo (5 May) commemorates the Battle of Puebla, fought on May 5, 1862. The battle marks Mexico’s best-known military success since its independence from Spain in 1821.

Today, in a curious example of cultural adaptation, the resulting holiday is celebrated far more widely in the USA than in Mexico.

The background to the Battle of Puebla

The nineteenth century in Mexico was a time of repeated interventions by foreign powers, including France, Spain, Britain and the USA, all of which hatched or carried out plans to invade.

US stamp for Cinco de MayoThe first French invasion, in 1838, the so‑called Pastry War, lasted only a few days. A decade later, US troops entered Mexico City, and Mexico was forced to cede Texas, New Mexico and (Upper) California, an area of 2 million square kilometers, about half of all Mexican territory, in exchange for 15 million pesos.

A new constitution in 1857 provoked an internal conflict, known as the Reform War (1858‑60), between the liberals led by Benito Juárez, who supported the new constitution, and the conservatives. The War decimated the country’s labor force, reduced economic development and cost a small fortune. Both sides had serious financial problems. At one point in this war, the liberals reached an agreement with the USA to be paid four million pesos in exchange for which the USA would receive the “right of traffic” across the Isthmus of Tehuantepec “in perpetuity”. Fortunately, this treaty was never ratified by the US Senate.

The financial crisis deepened, eventually leading Mexico to suspend all payments on its foreign debt for two years. The vote was approved by the Mexican Congress by a single vote. The foreign powers involved were furious; in 1861, Britain, France and Spain decided on joint action to seize the port of Veracruz on Mexico’s Gulf coast and force Mexico’s government to pay. The UK and Spain quickly agreed terms and withdrew their military forces, but the French decided to stay.

The French are confident of victory

France’s emperor, Napoleon III (Louis Napoleon Bonaparte) had grand ambitions and envisaged a Mexican monarchy. To this end, he decided to place Austrian archduke Maximilian von Habsburg as his puppet on the Mexican throne. The French Army moved inland from Veracruz and occupied the city of Orizaba. The French commander was supremely confident that his forces could crush any opposition. (Following their defeat at Waterloo in 1815, no-one had beaten the French in almost fifty years.) The Commander, Charles Ferdinand Latrille, the Count of Lorencez, confidently boasted that, “We are so superior to the Mexicans in race, organization, morality and devoted sentiments that I beg your Excellency [the Minster of War] to inform the Emperor that as the head of 6,000 soldiers I am already master of Mexico.”  (Quoted in “Betterment for Whom? The Reform Period: 1855‑1875” by Paul Vanderwood, chapter 12 of The Oxford History of Mexico (edited by Michael C. Meyer and William H Beezley, O.U.P. 2000).

Mexican resistance

Marching towards Mexico City, the French needed to secure Puebla, which was defended by 4,000 or so ill‑equipped Mexican soldiers. Ironically, given the eventual outcome, many of the defenders were armed with antiquated weapons that had already beaten the French at Waterloo, before being purchased in 1825 by Mexico’s ambassador to London at a knock-down price! The Mexican forces, the Ejército de Oriente (Army of the East) were commanded by General Ignacio Zaragoza, a Texas‑born Mexican. Zaragoza dug his forces into defensive positions centered on the twin forts of Loreto and Guadalupe.

The events of 5/05

On the 5 May 1862, Zaragoza ordered his commanders to repel the invaders at all costs. Mexicans received unexpected help from the weather. After launching a brief artillery bombardment, the French discovered that the ground had become so muddy from heavy unseasonable downpours that maneuvering their heavy weapons was next to impossible.
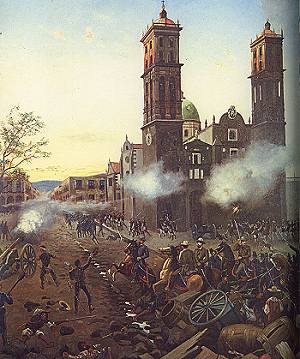
Painting of Battle of Puebla

Bullets rained down on them from the Mexican troops that occupied the higher ground near the forts. At noon, the French commander ordered his troops to charge the center of the Mexican lines. But the lines held strong, and musket fire began to take its toll. Successive French attacks were rebuffed. The Mexican forces then counter‑attacked, spurred on by well-organized cavalry, led by Porfirio Díaz who would subsequently become President of Mexico.

As the afternoon wore on, and the smoke began to clear, it became apparent that the defenders of Puebla had successfully repelled the European invaders. The French troops fled back to Orizaba before retreating back to the coast to regroup. A crack European army had been soundly defeated by a motley collection of machete‑wielding peasants from the war‑torn republic of Mexico….

A few days later, on 9 May, President Benito Juárez declared that the Cinco de Mayo would henceforth be a national holiday.

Aftermath: the French return with reinforcements

Back in Paris, Napoleon was enraged. He ordered massive reinforcements and sent a 27,000-strong force of French military might to Mexico. This strengthened French army (under Marshal Elie Forey) took Mexico City in 1863, forcing Benito Juárez and his supporters to flee. Juárez established himself in Paso del Norte (now El Paso) on the US border, from where he continued to orchestrate resistance to the French presence. Supported by the conservatives, Maximilian finally ascended to the throne in May 1864. By this time, in the USA, the Unionists had taken Vicksburg, and the US government was considering its position. In May 1865, General Philip Sheridan led 50,000 US soldiers to ensure that French troops did not cross the Mexico‑USA border. Diplomatic pressure for a French withdrawal intensified and Napoleon III finally agreed to remove his troops in February 1866.

After the French had departed, President Juárez reestablished Republican government in Mexico, and put Maximilian on trial, ending an extraordinary period in Mexican history.

The significance of 5/05

With the passing of time, the Cinco de Mayo has assumed added significance because it marks the last time that any overseas power was the aggressor on North American soil.

In Mexico, the Cinco de Mayo is still celebrated with lengthy parades in the state and city of Puebla, and in neighboring states like Veracruz. There is at least one street named Cinco de Mayo in almost every town and city throughout the country.

In the USA, the Cinco de Mayo has been transformed into a much more popular cultural event, and one where many of the revelers think it commemorates Mexican Independence, not a battle. (Mexico’s Independence celebrations are in mid-September each year).

Many communities in the USA, especially the Hispanic communities, use Cinco de Mayo as the perfect excuse to celebrate everything Mexican, from drinks, music and dancing, to food, crafts and customs. The Cinco de Mayo has become not just another day in the calendar, but a very significant commercial event, one now celebrated with much greater fervor north of the border than south of the border.

Where to go to see more — Texas

General Ignacio Zaragoza died on September 8, 1862, only a few months after the Battle of Puebla. In 1960, the General Zaragoza State Historic Site was established in his birthplace, near Goliad, Texas, to commemorate his famous victory. In Zaragoza’s time, the town was known as La Bahía del Espíritu Santo.

Where to go to see more — Puebla

The Guadalupe and Loreto forts are in parkland, about 2 km north‑east of Puebla city center. The Fuerte de Guadalupe is ruined. The Fuerte de Loreto became state property in 1930. It is now a museum, the Museum of No Intervention (Museo de la No Intervención), complete with toy soldiers. The park has an equestrian statue of General Zaragoza and is the setting for the Centro Civico 5 de Mayo, with its modern museums, including the Regional Museum (history and anthropology), the Natural History Museum and the Planetarium (IMAX screen).
Apr 302011
 

The quality of housing in Mexico has improved significantly in the past two decades. By the 2010 census, 97.8% of Mexican households had access to electricity, compared to 95.0% in 2000 and 87.5% in 1990. That this figure is approaching 100% is a real accomplishment given that many Mexicans live in very isolated mountainous communities. As of mid-2010, 93.5% of rural households had electricity, compared 98.2% for towns between 2,500 and 15,000 and over 99% for larger towns and cities. Anyone who has lived without electricity knows what an incredible improvement it can make to one’s comfort and quality of life.

With smaller family sizes, household crowding has also declined. It went from 5.0 persons per household in 1990 to 4.4 in 2000 and 3.9 in 2010. The percentage of households with dirt floors is now down to 6.2%, compared to 13.2% in 2000 and 19.5% in 1990. In rural areas, 15.1% of houses have dirt floors compared to 7.7% in towns between 2,500 and 15,000.

The vast majority of rural houses now have piped water. In the 125 least developed municipalities in rural Mexico, over 63% of households have piped water, which is one of the most important factors for improved family health. Almost 39% of the households in these poor municipalities have sewers, a convenience that most rural residents now have. However, about half of all rural households still cook with firewood or charcoal.

Rural households are gaining increasing access to modern electrical conveniences. Almost 80% now have a television set, 62% have a refrigerator, 42% have a washing machine, and 36% have a cell phone (only 17 % have a wired telephone line). While these percentages are significantly higher in urban areas (TVs – 97.5%, refrigerators – 91.7%, washing machines – 78.4%, and cell phones – 78.4%.), life in rural Mexico is improving dramatically. However, rural areas are lagging significantly in access to the cyber-age. Only 6.8% have a computer in the house and 2.5% have internet access. Urban access is much higher: 42.7% for home computers and 33.1% for internet access. On the other hand, many rural households gain access to computers and the internet by using cyber-cafes, which have spread rapidly into small Mexican communities.

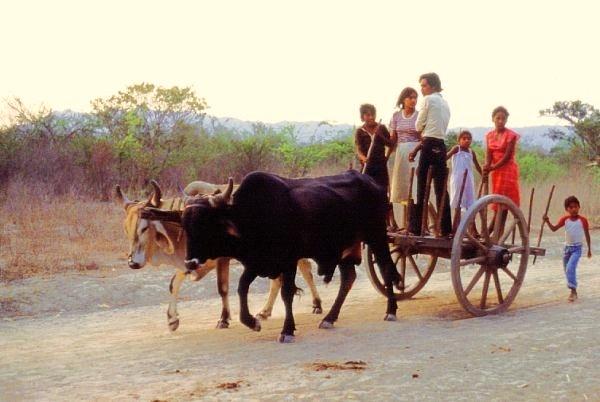
Local "bus" to the train station, Tehuantepec, 1985

Local "taxi" to the train station, Tehuantepec, Oaxaca, 1985. Photo: Tony Burton; all rights reserved

Access to public transportation has also improved in rural areas (see photo, taken in 1985). In mid-2010, 73% of rural residents had access to public transportation (usually bus or taxi). Access varies with community size. Of those in communities of 1,000 to 2,500, almost 90% have access, while only 37% of those localities of under 250 population had access to public transportation.


Mexico’s cities and towns are analyzed in chapters 21, 22 and 23 of Geo-Mexico: the geography and dynamics of modern Mexico. Rural Mexico is the subject of chapter 24. Living standards, including housing, are discussed in chapter 28. Buy your copy today!!

More Mexican women entering the workforce and becoming heads of households

 Updates to Geo-Mexico  Comments Off on More Mexican women entering the workforce and becoming heads of households
Apr 302011
 

The proportion of women in the workforce is increasing each year. By 2010 a full one-third (33.3%) of women were working compared to 29.9% in 2000. According to 2010 census data, the rate of economic participation of women is very closely linked to community size. In urban areas of over 100,000 population over 41% of women work. The percentage is 36% in cities with populations 15,000 to 100,000 and 29% in towns from 2,500 to 15,000. In rural areas, communities of under 2,500 inhabitants, the figure is 17%.

These official census figures do not count all the unpaid work women do in households, on farms and in family-operated enterprises. For this reason, these census figures paint a very inaccurate picture of the contribution that women make to the Mexican economy.

A recent OECD (Organization for Economic Co-operation and Development) report found that Mexicans work an average of 10 hours a day, longer than people in any of other OECD member country. (The average for all OECD members is 8 hours a day.) These figure include both paid and unpaid work such as housework.  The figures show the importance of home and family in Mexico—the report points out that Mexicans also do the most work in the home (3 hours a day), mainly preparing meals. Just how important to the economy is all this unpaid work? The OECD report estimates that the total value of unpaid work is equivalent to a whopping 24% of Mexico’s GDP. Women are responsible for a large proportion of this unpaid but valuable contribution.

The percentage of households headed by women is on the rise. It increased from 20.6% in 2000 to 24.4% in 2010. The pattern among states, however, is not easy to explain. The Federal District leads with 31.4% of households headed by women, but Nuevo León (which is second to the Federal District in most socio-economic characteristics) is at the very bottom with only 19.5% of households headed by females. Other states at the top of the list are Morelos (27.4%), Guerrero (26.9%), Veracruz (26.6%), and Baja California (26.0%). Other states near the bottom are Chiapas (20.2%), Coahuila (20.9%), Zacatecas (21.1%), Aguascalientes (22.4%) and Yucatán (22.4%).

The percentage of households headed by women is influenced by many factors including widowhood, males or females migrating for work, and modernity with more young unmarried females living independently.

Apr 282011
 

Literacy levels in Mexico among those over age 15 have increased rather steadily for more than a century, reaching 93.1% in 2010. The Federal District had the highest literacy level, 97.9%, while the lowest levels were in Chiapas, 82.2%; Guerrero, 83.3% and Oaxaca, 83.7%. The gap between the Federal District and Chiapas is quite large at 15.7 percentage points (97.9% – 82.2%). In the decades ahead, do we expect this gap to decline or increase?

To address this question, we can look at the 2010 census which provides data on literacy levels for children aged six to 14 for all 32 states. To compare literacy among states, we can use the data on 14-year-olds, who have higher literacy levels than the younger children. Among 14-year-olds, the Federal District has the highest literacy level at 98.89%. States with the lowest levels are Chiapas, 96.27%; Guerrero, 96.86%; Oaxaca, 97.75%; and Michoacán, 97.79%. The gap between the highest and lowest is only 2.62 percentage points. This gap is far less than the gap of 15.7 percentage points in literacy for those over age 15 discussed earlier.

These data indicate two things:

  • The literacy gap between states is closing and closing rather quickly.
  • Mexico is approaching universal literacy.

A more thorough analysis of geographical literacy gaps would include rural–urban comparisons and levels of literacy for adults and children in various sized communities. In general, literacy rates in Mexico tend to be correlated with community size; they are highest in the large cities, and lowest in rural areas. We will undertake this type of analysis when the appropriate data from the 2010 census become available.

Related post: Females, males and gender inequality in Mexico

Attempts to provide drainage for Mexico City date back to Aztec times

 Excerpts from Geo-Mexico, Mexico's geography in the Press  Comments Off on Attempts to provide drainage for Mexico City date back to Aztec times
Apr 262011
 

An old joke relates how engineers initially rejoiced at successfully draining the former lake on which Mexico City was built (something the Aztecs had tried, but failed to achieve), only to discover that the city now lacked any reliable source of fresh water for its inhabitants (something the Aztecs had successfully managed by building a system of aqueducts).

Water has been a major issue for Mexico City since it was founded almost 700 years ago. Civil engineering works by the Aztecs included causeways and aqueducts connecting their island capital to the mainland as well as lengthy dikes separating the fresh water lakes from the brackish Lake Texcoco which surrounded the city.

The Spaniards did not maintain the Aztec civil works, deforested the surrounding hillsides, and started filling Lake Texcoco. This contributed to major flooding in 1555, 1580, 1604. The city was actually underwater (continuously!) from 1629–1634. During this period the Spaniards invested in several flood control efforts, but they were not successful. In 1788 they started construction of a massive canal to connect the basin to rivers north of the city flowing to the Gulf of Mexico. The open canal, which was up to 30 m (100 ft) deep in places, provided flood relief, but did not completely solve the problem, and flooding continued.

In the mid-1850s the government approved another massive flood relief scheme. Construction of the Gran Canal was delayed by numerous political and financial problems; it was not completed until 1900. The 58 km (36 mi) long canal included a 10 km tunnel, and carried lake water, storm water and sewage north to the Río Salado and eventually to the Gulf of Mexico. The scheme successfully drained most of the basin lakes, but summer flooding continued to be a problem for decades.

Mexico’s deep drainage system (drenaje profundo) was completed in the 1970s. It relies on a 68-km-long central tunnel (Emisor Central) which has a maximum depth of 250 meters below the surface. Built to allow for a flow of 170 cubic meters/second, subsurface subsidence under Mexico City had reduced its maximum capacity to barely 15 cubic meters/second by 2008.

Paradoxically for a city originally built on a lake and which experiences regular summer floods, Mexico City is desperately short of drinking water. The drilling of wells to obtain potable water from the aquifer under Mexico City is one of the main reasons for the ground subsidence which has reduced the effectiveness of the deep drainage system.

Many parts of Mexico City still experience serious drainage problems every rainy season. During the long dry season, many street drains plug with garbage (especially impermeable plastic bags). City motorists dread the first heavy rains of the year since much of the rainwater which falls is unable to find its way underground and backs up from blocked drains. City authorities have an annual campaign to try to clear all drains before the first rains, but are never completely successful.

Since 2007, jointly agreed programs to maintain and renovate the deep drainage system have been undertaken each year during the dry season by Mexico City and the administrations of adjoining states, in an effort to reduce the metropolitan area’s serious flood hazard. In the first four years (2007-2010), more than 42 km of tunnels have been renovated. The 2010-11 season of repairs to the drenaje profundo will be completed before the start of the rainy season (usually in late May or early June), according to city mayor Marcelo Ebrard.

Why are some parts of Mexico City sinking into the old lakebed?

Which Mexican states attract most migrants?

 Updates to Geo-Mexico  Comments Off on Which Mexican states attract most migrants?
Apr 252011
 

Mexico-USA international migration remains a hot topic in any “Geography of Mexico” program. But international migration is not the only form of migration in Mexico; internal (domestic) migration is also important. This includes people moving house within the same town or city, as well as those who move to a different town, city or state.

The most rapid period of urban growth in Mexico coincided with high rates of rural-urban migration. As the proportion of the total population residing in rural populations fell, the proportion of the population living in urban areas (defined in Mexico as settlements with a population exceeding 2,500) rose, a trend called urbanization.

Rural-urban migration within Mexico has slowed down dramatically in recent years, but internal migration is still very common, with increasing numbers of Mexicans opting to live in mid-sized cities (those with a population between 100,000 and 1,000,000). In many cases, this involves a change of state, and this post examines which states in Mexico have attracted the most migrants from other states or from outside the country.

The 2010 census reveals that 18.4% of people residing in Mexico were born in another Mexican state or in a foreign country. In Quintana Roo, 54% of the residents were born outside the state. These residents were mostly attracted to Quintana Roo by the rapidly growing tourist industry in Cancún and other resorts. Almost 13% of Quintana Roo residents moved into the state within the last five years.

Over 45% of Baja California residents, 1.4 million people, were born elsewhere, and almost 6% moved into the state in the last five years. These migrants were probably attracted to the growing employment opportunities in Tijuana and Mexicali. Some may be waiting to try to cross illegally into the USA or have already made an unsuccessful attempt and are contemplating their next move.

Baja California Sur has almost 40% who were born elsewhere and over 13% who moved into the state within the past five years. These migrants were mostly attracted to jobs created in the booming tourism industry and in the associated construction sector.

About 37% of residents in the State of Mexico, 5.6 million people, were born elsewhere. Migration to the State of Mexico is mostly linked to the suburbanization and counter-urbanization of Mexico City. Between 2005 and 2010, about half a million people moved out of Mexico City and over 380,000 of these settled in the State of Mexico and an additional 38,000 moved to Hidalgo which is part of Metropolitan Mexico City. (For the areas involved, see Is Mexico City sprawl a sign of a future megalopolis?) Similar processes are also taking place in Guadalajara, Mexico’s second-largest city: Population change in the Guadalajara Metropolitan Area.

States with rather low income levels and slow economic growth attracted few migrants. Only 3.6% of Chiapas residents were born outside the state, with 1.2% moving into Chiapas in the last five years. Interestingly, Chiapas also has one the lowest rates of out-migration. Other states with relatively few migrants are Guerrero, Oaxaca, Yucatán and Tabasco.

Internal migration in Mexico is the focus of chapter 25 of Geo-Mexico: the geography and dynamics of modern Mexico. Ask your library to buy a copy of this handy reference guide to all aspects of Mexico’s geography today! Better yet, order your own copy…

Mexico introduces a carbon tracking system to monitor its greenhouse gas emissions

 Mexico's geography in the Press  Comments Off on Mexico introduces a carbon tracking system to monitor its greenhouse gas emissions
Apr 212011
 

A recent Scientific American article (15 March 2011) examines Mexico’s newly introduced system to track greenhouse gas emissions. The article, by Saqib Rahim, originally appeared in ClimateWire.

Systems to monitor emissions are essential if countries are to know whether or not they are meeting emissions targets. Mexico’s 2012 goal is to cut its greenhouse gas emissions by 6% of their 2000 value. Mexico’s longer-term goal is a decrease of 50% by 2050. Achieving these goals will require massive investments in a range of industries and Mexico hopes that a transparent greenhouse gas accounting system will play an important role in attracting foreign funds.

The system was developed in partnership with Abt Associates, a US consultancy that has contracts with US AID and the US Environmental Protection Agency. Mexican officials insisted that the system must be Internet-based, easy to use, and capable of providing updated reports every few months. Their existing system is spreadsheet-based, but relies on databases that are not 100% compatible in terms of the information and measurements recorded.

The new system allows officials to categorize emissions data by economic sector and geographic region, down to the level of an individual firm or a single municipality. Indonesia has already expressed its interest in the system, and it is hoped that other countries will now follow Mexico’s lead and adopt a similar strategy for keeping track of their own greenhouse gas emissions.

2010 Census data show a significant improvement in Mexican education

 Updates to Geo-Mexico  Comments Off on 2010 Census data show a significant improvement in Mexican education
Apr 192011
 

Mexicans over age 15 are now getting 8.6 years of schooling on average, compared to only 7.5 years in 2000 and 6.5 years in 1990. The increase of over a year in the past decade is impressive. While males are still getting more education than females, the gap is closing. Males got 8.8 years of education in 2010 while females got 8.5 years. However, female education has increased by 1.3 years since 2000 compared to 1.1 years for males.

Not surprisingly, educational attainment is not equally distributed among Mexico’s 32 states. The Federal District has the highest level with 10.5 years, followed by Nuevo León with 9.8, Coahuila with 9.5, and Baja California Sur and Sonora both with 9.4. At the other end, Chiapas was lowest with an average of 6.7 years. Other states at this end are Oaxaca with 6.9, Guerrero with 7.3, and Michoacán with 7.4 years.

If we look at Mexico’s 2,442 municipalities, the inequality is even greater. Urban areas tend to have significantly higher education levels than rural areas. The municipalities with the highest levels are Benito Juárez, D.F. with 13.9 years, followed by San Pedro Garza García, N.L. (12.3), Miguel Hidalgo, D.F. (12.3), San Sebastian Tutla, Oax. (12.1), and Coyoacán, D.F. (12.1). By comparison, average educational attainment in the USA and Canada are 12.0 and 11.6 years respectively. It is interesting that two of the municipalities in the top ten for average level of education are in Oaxaca, a state with one of the lowest overall levels of education.

At the bottom end, the municipality with the lowest average level of education is Cochoapa el Grande in Guerrero with 2.3 years, followed by Coicoyán de las Flores, Oax. (2.5), San Martin Peras, Oax. (2.8) and Mixtla de Altamirano, Ver. (2.9). All the lowest ten in terms of educational attainment are predominantly indigenous municipalities.

Though municipalities lagging in educational attainment still have a long way to go, they are making very impressive progress. In the least developed 125 municipalities in Mexico, school attendance for children between 6 and 15 years of age is an impressive 88%. The percentage for the most developed 125 municipalities is 96%. The figures indicate that in the next few decades the gap in adult educational attainment between the highest and lowest municipalities should decline very significantly.

The cultivation of chiles in Mexico

 Updates to Geo-Mexico  Comments Off on The cultivation of chiles in Mexico
Apr 182011
 

In a previous post, we saw how chiles (Capsicum spp.) have been cultivated in Mexico for centuries (the oldest record of domestication dates back to 4100BC) and they made an important contribution to Mexico’s traditional cuisine being recognized by UNESCO as an “Intangible Cultural Heritage of Humanity.”In this post we take a closer look at where they are grown, how many are produced and how valuable the annual crop is for the domestic market and for export.

For an overview of different kinds of chiles, see these two articles by Karen Hursh Graber on MexConnect:

Area cultivated

The area cultivated for chiles has declined slightly over the last decade from 145,000 hectares to 141,000; about 85% of this area is irrigated. However, the volume of total production has risen by an average of 1.5%/yr, due to the application of improved techniques, knowledge and equipment, especially the increased use of greenhouses. Each year, a small percentage of the cultivated area is not harvested due to the adverse impacts of diseases, pests and climatic events.

Cultivation location, production volumes and value

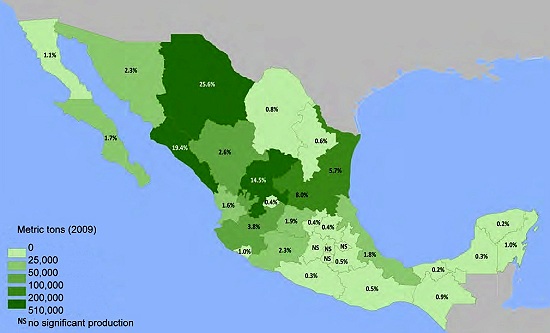
Mexico’s total annual chile production is around 2 million tons [cf China’s 14.3 million tons]. By variety, about 30% of production is jalapeño chiles, followed by serrano (10.9%), poblano (9.7%) and morrón (8.1%). These four account for 60% of production:

  • jalapeño (619,000 tons in 2009): Chihuahua (42%), Sinaloa (12.9%), Jalisco (6.6%) and Michoacán (6.3%)
  • serrano (217,000 tons): Tamaulipas (38.7%) and Sinaloa (30.9%)
  • poblano (192,000 tons): spread between 16 states, led by Zacatecas (32.7%), Sinaloa (20.6%) and Guanajuato (13.2%)
  • morrón (162,000 tons): Sinaloa (96%)

Production of chiles in Mexico
Production of chiles in Mexico, 2009. Source: SAGARPA 2010

The map shows total production volume on a state-by-state basis.

In summary, 2 out of every 3 green chiles grown in Mexico come from Chihuahua, Sinaloa, Zacatecas and San Luis Potosí.

Domestic market for chiles

The average consumption in Mexico is about 15 kg/person. For the period 2000-2010, domestic consumption oscillated around 1.5 million tons/yr. As international demand rises, there is a slightly reduced supply of chiles to the domestic market.

Trade in chiles (exports and imports)

International trade in chiles began shortly after Columbus introduced them to Europe as “peppers of the Indies”.

Today, as noted earlier, Mexico is the world’s leading exporter of green chiles, and ranks 6th for dried chiles. About 25% of Mexico’s chile production is exported. Over the last decade (2000-2009), exports have grown at a rate of about 15%/yr in volume, and 13% in value. In 2009, chile exports were worth 720 million dollars. Exports go to 52 countries, though a whopping 98% go to the USA, followed by the UK, Canada, Germany and Japan.

Mexico also imports some chiles each year. From 2000-2009, imports (almost entirely dried chiles) averaged 30,000 tons, at a cost of around 100 million dollars. China is Mexico’s main provider, followed by Peru, the USA and Spain.

Chile tourism
La Feria del Chile (The Chile Fair) in Queréndaro, Michoacán

Recipes with Chiles:

Main source (pdf file): Un panorama del cultivo del chile, SAGARPA: Servicio de Información Agroalimentaria y Pesquera, June 2010.
[accessed January 28, 2011]

Agriculture in Mexico is analyzed in chapter 15 of Geo-Mexico: the geography and dynamics of modern Mexico. Ask your library to buy a copy of this handy reference guide to all aspects of Mexico’s geography today! Better yet, order your own copy…

Why Mexico plays an important part in one firm’s vertical integration of the citrus fruit industry

 Mexico's geography in the Press  Comments Off on Why Mexico plays an important part in one firm’s vertical integration of the citrus fruit industry
Apr 162011
 

In an earlier post, we looked at the geography behind the cultivation of oranges in Mexico. In this follow-up, we report on an example of vertical integration in the citrus industry. Vertical integration occurs when the same firm controls several successive stages of the production of an item. In this case, the same firm that grows the citrus fruit also packages it and ships it to markets and consumers.

Paramount Citrus, based in the USA, but with orchards also in Mexico, is our chosen example of a vertically-integrated citrus-growing and marketing firm. The firm specializes in Persian limes (it is the largest supplier of fresh limes in the USA), but also grows a variety of other citrus fruits, including Clementine mandarins, Navel oranges and Valencia oranges. But Paramount is not only a grower of citrus, it also packs and ships fresh citrus (including some grown by independent growers) to markets all across the USA.

The advantage to Paramount of having citrus-growing properties in Mexico is that it enables the company to supply citrus to the US market year-round. For example, Mexican “lemons should start shipping as early as July, will peak in August and
September and finish up by mid-November,” according to a company representative.

Paramount currently harvests more than 12,000 hectares (30,000 acres) of citrus a year. This figure includes 2,400 hectares (6,000 acres) of lemon groves near Tampico in Tamaulipas, that the company bought in 2008. Paramount is now expanding its operations in Mexico by completing the purchase of an additional 3,800 hectares (9,500 acres) of lime orchards in the Gulf coast state of Tabasco.

Apr 142011
 

Foreigners are defined as individuals born in another country, but residing in Mexico. According to the recent census, almost a million (961,121) foreigners were living in Mexico in mid-2010. In 2000 there were only about half as many (492,617). Among foreigners, there were slightly more males than females (50.6% versus 49.4%). Under this definition, children born in the USA of two Mexican parents are considered foreigners if they currently live in Mexico. Unfortunately, the data currently available do not enable us to separate these foreign-born Mexicans from other foreigners who were raised in other countries and moved to Mexico to follow their professions or retire. Furthermore, they do not help us answer a question we have been asked dozens of times in recent years, namely, “How many Canadians and how many Americans have retired in Mexico?”

Though almost a million foreigners sounds like an impressive number, Mexico has relatively few foreign born residents compared to its two northern neighbors. Foreigners constitute only 0.86% of the 2010 Mexican population, compared to 21% Canada and 13% in the USA.

Where in Mexico do most foreigners reside? Baja California has the most foreigners with almost 123,000, followed by Jalisco (84,000), Chihuahua (80,000), and the Federal District (72,000). Tlaxcala has the fewest, with just over 3,200, followed by Tabasco with about 4,500.

The states with the highest percentage of foreigners are mostly along the US border. Baja California leads with 3.9%, followed by Chihuahua (2.3%), Tamaulipas (1.9%), and Sonora (1.7%). Interestingly, the other border state, Coahuila, has relatively few foreigners, only 0.8%. Other states with relatively large percentages are either historical sources of immigrants to the USA or retirement havens like Colima (1.44%), Quintana Roo (1.40%), Nayarit (1.35%), Zacatecas (1.22%), Jalisco (1.14%) and Michoacán (1.10%).

Tabasco has the fewest foreigners as a percentage with only 0.20%, followed by Tlaxcala (0.28%), Veracruz (0.30%), the State of México (0.33%) and Yucatán (0.36%). Yucatán is a surprise on this list because there is a very large and active foreign retirement community there. Perhaps many of these retirees were away from Mexico when the census was taken in the summer of 2010.

What states experienced the largest increases in foreigners in the last decade? The number of foreigners grew fastest in those states with relatively few foreigners in 2000, namely Hidalgo (up 402% over the decade), Tlaxcala (333%), Tabasco (281%), and Veracruz and Oaxaca (both with 272%).

Related posts:

Atlantic and eastern Pacific hurricane names for 2011

 Other  Comments Off on Atlantic and eastern Pacific hurricane names for 2011
Apr 132011
 

Hurricanes are also known as typhoons or tropical cyclones. The table shows the World Meteorological Organization’s official list of 2011 hurricane names. Note that male and female names alternate. Names are often reused in future years, with the exception of the names of any particularly violent storms, which are officially “retired” from the list for a long time.

Atlantic, Gulf of Mexico and CaribbeanEastern Pacific
ArleneAdrian
BretBeatrix
CindyCalvin
DonDora
EmilyEugene
FranklinFernanda
GertGreg
HarveyHilary
IreneIrwin
JoseJova
KatiaKenneth
LeeLidia
MariaMax
NateNorma
OpheliaOtis
PhilippePilar
RinaRamon
SeanSelma
TammyTodd
VanceVeronica
WhitneyWiley
Xina
York
Zelda

In Mexico, the “official” hurricane season is from May 15 to November 30 each year for Pacific coast storms, and from June 1 to Novemebr 30 for Atlantic storms, though most hurricane activity is concentrated in the months from July to September.

This year, Philip Klotzbach and William Gray, researchers at Colorado State University, predict that 16 named storms will form in the Atlantic: 7 tropical storms,4 moderate hurricanes (1 or 2 on the Saffir-Simpson scale), and 5 severe hurricanes (3, 4 or 5 on the Saffir-Simpson scale).

For the Pacific coast, Mexico’s National Meteorological Service (Servicio Metrológico Nacional, SMN) is expecting 17 storms: 7  tropical storms, 6 moderate hurricanes (1 or 2 on the Saffir-Simpson scale), and 4 severe hurricanes (3, 4 or 5 on the Saffir-Simpson scale). The SNM publishes regular updates on hurricane activity (in Spanish) on its webpage and via its Twitter account: @huracanconagua.

Previous posts related to hurricane prediction:

Hurricanes and other climatic hazards are analyzed in detail in chapter 4 of  Geo-Mexico: the geography and dynamics of modern Mexico.

Are women better than men at gathering mushrooms on the slopes of a Mexican volcano?

 Other  Comments Off on Are women better than men at gathering mushrooms on the slopes of a Mexican volcano?
Apr 122011
 

This post summarizes the findings of an article entitled “Sex differences in mushroom gathering: men expend more energy to obtain equivalent benefits”, published in the July 2010 issue of Evolution & Human Behavior.

Men are often thought to have superior spatial abilities to women. However, recent research has suggested that such differences are task dependent. It is now commonly argued that differences in spatial abilities may date back to early human societies during the Pleistocene. At that time, men’s spatial skills became fine-tuned for successful hunting of animals that were constantly on the move, while women’s spatial skill-set developed to ensure success in gathering immobile plant resources.

In a nutshell, men are thought to find their way about using orientation, and women by memorizing landmarks. One study reported that men performed better than women in finding their way through unfamiliar woodland, whereas another study showed how women exploring a farmers market in Santa Barbara, California, could remember where individual food items were more accurately than men.

Despite these earlier studies, the male/female differences in spatial skills had never been tested in appropriate circumstances in the field prior to the research carried out by four enterprising Mexican researchers led by Luis Pacheco-Cabos of the National University (UNAM).

The setting

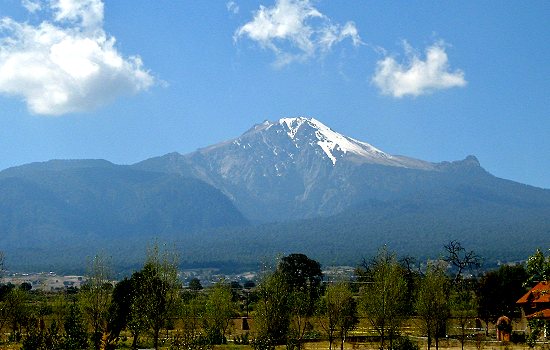
The team studied the foraging techniques and success rate of men and women from a small village in Tlaxcala as they searched for edible mushrooms on the slopes of La Malinche volcano (Malintzin).

The small rural community of San Isidro Buensuceso has about 8,000 Nᨵatl-speaking inhabitants. The villagers have a long history of collecting mushrooms. Most mushroom collecting takes place during the summer rainy season. The vegetation in collecting areas is relatively open pine-oak forest, though the precise mix of species varies with altitude.

La Malinche Volcano

La Malinche Volcano

Each small group of mushroom collectors was followed by a researcher who recorded their movements and the weight of mushrooms collected. The exercise was carried out at seven different sites, most more than 3000m above sea level, through relatively open forest in terrain that included steep gullies carved into the flanks of volcano. The researchers were continuously monitored to record data enabling the calculation of the energy they expended in kilo-calories (kcal). Collectors gathered up to 9.5 kg of mushrooms in a single trip.

What were the teams key findings?

Although men and women collected similar quantities of mushrooms, men did so at significantly higher cost. They traveled further, to greater altitudes, and had higher mean heart rates and energy expenditure (kcal). They also collected fewer species and visited fewer collection sites.

Women used their superior powers of memorizing object location to collect more species, and visit more collection sites than men, obtaining more mushrooms during the same period of time, with less energy expenditure.

What does this mean?

The results suggest that differences in spatial ability between men and women are task-dependent. In terms of search strategies developed for gathering wild mushrooms, and presumably other wild plants, women outperform men. The women proved to be more efficient foragers than men in energy efficiency terms since they collected significantly more mushrooms while expending significantly less energy in doing so.

The researchers did not publish any calculation for the energy efficiency of mushroom collectors for comparison with the figures quoted in: The energy efficiency of farming in Mexico and elsewhere. However, based on their data, and assuming that 3 grams of raw mushrooms are approximately equivalent to 1 calorie, the energy efficiency for mushroom pickers on the slopes of La Malinche volcano must be somewhere between 0.5 and 1.7, with men tending towards the lower value. An energy efficiency of 1.0 would mean that the energy expended in gathering mushrooms is roughly the same as the calorific energy they contain.

The researchers conclude that similar studies are now needed for other cultural groups, and for the gathering of different resources, such as firewood.

Source:

Luis Pacheco Cobos, Marcos Rosetti, Cecilia Cuatianquiz, Robyn Hudson: “Sex differences in mushroom gathering: men expend more energy to obtain equivalent benefits”, Evolution & Human Behavior, July 2010 (Vol. 31, Issue 4, Pages 289-297).

How do El Niño events affect Mexico?

 Excerpts from Geo-Mexico  Comments Off on How do El Niño events affect Mexico?
Apr 112011
 

La Niña and El Niño are two major periodic disturbances to the normal oceanic and atmospheric circulation patterns over the Pacific Ocean which have widespread effects around the world. The normal circulation in the equatorial Pacific (the Walker circulation cell) results from a low pressure area over the western Pacific (due to warm surface ocean temperatures) and a high pressure area over the eastern Pacific (due to the upwelling of cold ocean water off the coast of Ecuador). Surface trade winds blow from east to west, while high altitude air flow is from west to east.

A La Niña event is an intensification of the normal Walker cell. This results in warmer and drier conditions than normal, rarely with serious consequences for Mexico.

However, during an El Niño Southern Oscillation (ENSO) event, the Walker circulation pattern is essentially reversed. Early in the year, warm ocean water extends much further east, causing warm moist air to rise off the coast of South and Central America, bringing heavy rainfall to areas along the west coast of Mexico. The El Niño in 1998 raised the temperature of water off Mexico’s Pacific coast by some 3° to 5°C (6° to 9°F) and also increased the humidity considerably. Historically, ENSO events have occurred every four to seven years, but their frequency may now be increasing.

The effects of an ENSO event are also felt on the Gulf coast. The low pressure area resulting from the air rising off the western coast causes air from further east to be dragged across Mexico. This means that more cold fronts or nortes enter north and central Mexico. Winter precipitation in these areas increases significantly, especially in the north, and temperatures are much cooler than usual. Flooding can result in coastal areas. ENSO effects are also felt in other parts of the world.

In Mexico, ENSO events not only affect winter precipitation but also summer precipitation, which is more critical for farmers. This is because they push the equatorial Intertropical Convergence Zone (ITCZ), where the north-east and south-east trade winds meet, further south. This reduces the convective activity and rainfall in Mexico’s central highlands. Furthermore, this may reduce cloud cover and therefore increase solar radiation and evapotranspiration, making the ground even drier.

In summary, subsistence corn (maize) farmers find that their cooler, wetter winter than normal is immediately followed by a hotter and drier summer growing season. This can have disastrous consequences for their food security. The rapid onset of changed conditions does not allow much time for adequate adjustments to be made to their choice of crops or farming methods.

Historical analysis combined with greater climatological understanding shows that many of the worst droughts and floods in Mexico have been associated with either ENSO events or with the related Pacific-North American Oscillation. Perhaps 65% of the variability of Mexican climate results from changes in these large-scale circulations.

Chiles, one of Mexico’s heritage crops

 Other  Comments Off on Chiles, one of Mexico’s heritage crops
Apr 092011
 

Chiles (Capsicum spp.) have been cultivated in Mexico for centuries and are a vital ingredient in Mexico’s traditional cuisine, recently recognized by UNESCO as an “Intangible Cultural Heritage of Humanity.” Spicy chiles also have numerous medicinal uses. Graphical representations of chiles have even been used as a national symbol.

Chiles are native to Mexico and central America. Evidence for chiles in the diet of indigenous groups in Puebla’s Tehuacán Valley dates back at least as far as 6500BC; by 4100BC, the plant was already domesticated.

Chiles

Chiles. Photo: zoonabar (flickr); creative commons license

There are more than 100 varieties of chiles, grouped into 22 groups of green chiles and 12 of dried chiles. Green chiles by far the most important in volume and value of production and trade. Mexico remains the world’s leading exporter of green chiles and is the sixth largest exporter of dried chiles. The world’s leading producer of green chiles, almost entirely for domestic consumption, is China.

The ideal conditions for cultivating chiles are:

  • growing season temperatures of 18-27̊C daytime and 15-18̊C during the night.
  • rainfall of 600-1250 mm/yr, with no marked dry season.
  • light, humus-rich soils with adequate moisture retention and drainage
  • soils with a pH between 5.5 (slighty acidic) and 7.0 (neutral)
  • growing season of at least 120 days

Crop yields can be adversely affected by:

  • plagues,
  • plant diseases,
  • climatic hazards, such as hailstorms, rainstorms (fields need efficient drainage systems) and frost, the risk of which is countered by burning waste to create smoke to maintain temperatures above freezing

Time frame for cultivation

  • on commercial chile farms, seeds are usually sown in enclosed, heated, nursery beds, since temperatures of 20-24̊C are considered ideal for germination
  • seedlings are transplanted after 25-35 days when they are about 10-20cm in height – optimum yields require 20,000-25,000 plants per hectare
  • the first flowers appear 1-2 months later, by which time the plant is 30-80 cm tall
  • the first green chiles ripen about a month after that; chiles can then be picked every week or so for up to 3 months in rain-fed fields, or sometimes over an even longer period in irrigated fields.

In ideal circumstances, harvesting is possible all year. There are two major, overlapping harvest periods each year, with a fall-winter crop from December-August, and a spring-summer crop from June to March.

Yields vary greatly, reflecting different qualities of soil, water supply and technification employed. The average yield across Mexico is 14-15 metric tons/hectare. Yields in Zacatecas (which has a larger cultivated area of chiles than any other state in Mexico) are only 7 tons/ha, while yields in Sinaloa reach as high as 40 tons/ha.

Types of chile grown in Mexico

The most commonly grown chiles in Mexico are jalapeño, serrano, habanero, poblano and morrón (bell pepper). Seven varieties of green chiles represented 90% of Mexico’s total production of chiles in 2008, and 60% of its total revenue from chiles. Chiles vary in color, heat, size and texture:

Even for a single species, the “heat” of its chiles varies from one plant to the next, as well as from one soil or location to another. The heat of chiles is measured in Scoville units. The hottest chile is generally thought to be the habanero (100,000-445,000 Scoville units). By comparison, the jalapeño is 2,500-5,000 units and the morrón chile (bell pepper) registers 0 Scoville units.

Main source for statistics (pdf file): Un panorama del cultivo del chile, SAGARPA: Servicio de Información Agroalimentaria y Pesquera, June 2010. [accessed January 28, 2011]

Agriculture in Mexico is analyzed in chapter 15 of Geo-Mexico: the geography and dynamics of modern Mexico. Ask your library to buy a copy of this handy reference guide to all aspects of Mexico’s geography today! Better yet, order your own copy…

Micro-businesses help improve the economic and social outlook for irregular settlements

 Mexico's geography in the Press  Comments Off on Micro-businesses help improve the economic and social outlook for irregular settlements
Apr 072011
 

In previous posts about Mexico City’s low-cost and “irregular” housing areas, we have seen how the residents of Ciudad Nezahualcóyotl (Nezahualcoyotl, an irregular settlement which grew into a monster) have gradually transformed their urban environment, and are now regarded by some as part of Mexico’s growing middle class (Are the residents of Ciudad Nezahualcóyotl becoming middle class?).

Historically,  low-cost housing areas (Informal settlements or “colonias populares” in Mexico’s cities) have been established throughout the Mexico City metropolitan area, with the notable exception of the city’s high status western sector. The highest concentrations of colonias populares are in the industrial zones, at the periphery of the city, and in undesirable areas such as the former lakebed near Lake Texcoco which is unstable and prone to severe flooding. (See, for example, Subsidence incident leads to demolition of 31 homes in the State of Mexico).

In the 1950s, in an attempt to control urban growth, the Federal District government started to oppose the formation of new colonias populares. In contrast, the neighboring State of Mexico tolerated, and even encouraged, the development of such communities, explaining why numerous colonias populares were established just beyond the Federal District boundary, in municipalities such as Naucalpan, Tlalnepantla, Ecatepec, Chimalhuacán, and Nezahualcóyotl.

Many of these settlements grew very rapidly. For example, Chimalhuacán, on the Texcoco lakebed, just north of Nezahualcóyotl, grew from 20,000 in 1970 to 525,000 in 2005 and 614,000 in 2010. Similarly, Valle de Chalco Solidaridad, on the lakebed of the drained Lake Chalco, and alongside the main highway from Mexico City to Puebla, went from 44,000 in 1970 to 332,000 in 2005 and almost 358,000 in 2010. Currently, about 60% of the Mexico City Metro Area’s population lives in colonias populares.

Over time, almost all of the older, longer-established colonias irregulares in Mexico have been improved, though new ones still spring up almost overnight. It may take 10 years or so for them to look like a regular settlement and acquire some basic urban services (water, electricity, drainage). The first settlers starting a new irregular settlement are often referred to as paracaidistas (parachutists) in reference to the fact that they apparently arrive out of nowhere!

A recent article in Forbes magazine looks at how small businesses in Chimalhuacán are helping to transform the urban landscape and offer increasing opportunities for its residents.

The population figures quoted in the article must refer to a larger area than just the municipality of Chimalhuacán, but the processes described are typical of many colonias populares, augmented in this case by particularly enterprising entrepreneurs.

Prior to the 1960s, villages with telephone service in most parts of Mexico were served by a single “caseta” (phone booth), which inevitably became a center for village gossip. The early adopters who installed the first public phone booth in a particular village usually prospered, encouraging others to follow suit. Back then, phone service was mostly about keeping in touch with family, but now phones promise access to all kinds of services. The  contemporary phone booths (called Barafón, cheap phone) in Chimalhuacán, described in Forbes, greatly improve people’s access to affordable phone service, enabling them to obtain health care and employment information, as well as operate micro-businesses more efficiently.

As the Forbes article concludes, “While the imagery and condition of one of Mexico’s largest urban slums is grim, closer inspection reveals a thriving and ever so gradually modernizing environment.” Indeed. Like many other colonias populares, Chimalhuacán is well on its way to joining the 21st century.

Related posts:

Mexico’s cities and towns are analyzed in chapters 21, 22 and 23 of Geo-Mexico: the geography and dynamics of modern Mexico. Buy your copy today!!

Review of “Climate and Society in Colonial Mexico: A Study in Vulnerability” (Georgina Endfield)

 Books and resources  Comments Off on Review of “Climate and Society in Colonial Mexico: A Study in Vulnerability” (Georgina Endfield)
Apr 052011
 

Environmental historian Georgina Endfield has analyzed a wide variety of colonial archives to explore the complex relationships between climate and social and economic systems. Her book—Climate and Society in Colonial Mexico: A Study in Vulnerability—considers case studies in three distinct zones of Mexico:

  • the arid Conchos Basin of Chihuahua
  • the fertile Oaxaca Valley
  • the agricultural area centered on Guanajuato in the Bajío region

Endfield - Cover of Climate and Society in Colonial MexicoEndfield systematically unravels the connections between climatic vulnerability and the ways in which societies sought to mitigate the impacts of climate-related disasters, while striving for greater resilience against similar events in the future. Her book considers a range of disasters and impacts, from floods, droughts and storms to epidemics, food shortages, riots and rebellions.

The author captures her readers immediately as she describes how “28 June 1692 was a very wet day in Celaya, Guanajuato. Unusually heavy rains began falling in the afternoon and continued all through the evening.” This was the prelude to “terrible panic among all the inhabitants of the city”, and “could not have come at a worse time”, since two years of drought and crop blights had led to famines and epidemics.

Throughout the book’s seven chapters, Endfield writes in a direct manner. She avoids lengthy quotes in favor of presenting a carefully constructed argument, as she leads the reader in an exploration of the content and merits of the colonial sources. In the final chapter, she examines the broader context, relating climatic events in Mexico to events in Europe, and considering the possible role of ENSO (El Niño Southern Oscillation) events.

An extended table towards the end of the book provides a time line for the known environmental hazard events striking the three areas between 1690 and 1820. It shows, for example, that droughts were reported in Chihuahua in no fewer than 40 years of that 130-year time span.

Referencing throughout the book is meticulous, and repeated use is made easier by the provision of a detailed index.

I do have one tiny quibble. The use of accents in this book is quite inconsistent. Even for place names, some accents are missing, while others have migrated to the wrong letter. For example, Léon is often used for León.

This is a fascinating read. Apart from the many invaluable examples of climatic hazards and their demographic, social, economic and political impacts, Endfield has been hugely successful in demonstrating the tremendous value of Mexico’s rich colonial archives, archives which no doubt still hold many more secrets, which they will only give up in response to similarly painstaking research.

Studies of climate change are set to take center-stage in coming decades, and this historical account reminds us all that climate hazards are far from a rare or a novel occurrence.

In short, this is a highly recommendable book.

Details (click for amazon.com):

Climate and Society in Colonial Mexico: A Study in Vulnerability (Blackwell, 2008) by Georgina H. Endfield; 235 pages.

Mexico’s diverse climates and climatic vulnerability are the subject of chapter 4 of Geo-Mexico: the geography and dynamics of modern Mexico. Water availability, rivers, aquifers, water issues and hazards are analyzed in chapters 6 and 7. Buy your copy today!

Apr 042011
 

The map (below) of drug war death rates for the 67 municipalities of Chihuahua reveals a rather complicated pattern that is not amenable to easy explanation.

There is a clear cluster of very high death rate municipalities around Ciudad Juárez, which has for years been the main focus of drug violence in Mexico.

Drug war deaths in the state of Chihuahua
Drug war deaths in Chihuahua (Dec. 2006—Dec. 2010). Cartography: Tony Burton; all rights reserved.

There is also a group of high death rate municipalities west and south of Chihuahua City suggesting that it might be a center of significant drug cartel activity.

The reason for high death rate areas on the western and southern borders of Chihuahua is not readily apparent from the map, though they do coincide with the area of lowest HDI (Human Development Index) scores in the state (see Geo-Mexico, figure 29.3).

This south-western part of the state forms part of the Western Sierra Madre physiographic region (see map linked to above), an area of rugged relief with limited highway connections where rivers have carved giant canyons (such as the Copper Canyon system) into the forested plateaus and mountains. The “culture of violence” in this region, sometimes called Mexico’s “Golden Triangle”, was analyzed by Carlos Mario Alvarado in “La [Sierra] Tarahumara, una tierra herida: análisis de la violencia en zonas productoras de estupefacientes en Chihuahua”  (The Tarahumara Sierra, a wounded land: analysis of the violence in narcotic drug production zones in Chihuahua) published by the state government in 1966.

Alvarado found that between 1988 and 1993, in the southernmost municipality of Guadalupe y Calvo and in neighboring drug-growing municipalities, murders had a bimodal distribution each year, with peaks in April-May-June (when poppies and marijuana are planted) and September-October-November (when they are harvested). The four-year drug-violence death-rate for those municipalities in the early 1990s was significantly higher than the four-year drug war deaths ration shown on the map for 2006-2010.

Guadalupe y Calvo, “one of the most violent municipalities in Mexico”, had a four-year rate for 1991-1994 of about 510/100,000 inhabitants. Batopilas’s rate, 478/100,000, was almost as high. The rate in Morelos, sandwiched between these two municipalities, was over 700/100,000. On this limited evidence, it does not appear that this region has actually become any more violent than it used to be!

Returning to the map, it is also interesting that there are some relatively low death rate areas along the rather isolated Mexican-USA border in eastern Chihuahua. Careful analysis of the Chihuahua highway network does not provide any real insights to explain the mapped pattern.

There is some good news. For the 2007-2010 period, five of Chihuahua’s 67 municipalities did not experience a single drug war related death, though they are all very small municipalities with an average population of about 2,000.

Finally, we should remember that even the lightest areas on the map represent municipalities with death rates quite high compared to the rest of Mexico. Five of the municipalities in this group of 18 have death rates over twice the national average and 12 are above the average.

Previous posts in this mini-series:

Geo-Mexico: the geography and dynamics of modern Mexico discusses drug trafficking in several chapters. A text box on page 148 looks at trends in the drug trafficking business and efforts to control it. Buy your copy today to have a handy reference guide to all major aspects of Mexico’s geography!

Apr 022011
 

The book is impressive; indeed, I would say it is encyclopedic, both in terms of Mexico as a place, and geography as a subject.  Exactly as promised on p.2, it introduces models and theories that are characteristic of the subject, and then shows how they could be adapted to be made more relevant to Mexico.  Moreover, it does so in ways so clear that a layman/non-geographer would have little difficulty understanding the linkages made.

Chapter 2 illustrates the point: a reader does not have to be a physical geographer to understand the links between plate tectonics and volcanoes and earthquakes in Mexico.  Other chapters do likewise, and it has been a delight to find geographic theories and principles stated and then illustrated with reference to the topic of the subject – and in plain language, rather than jargon.

The diagrams and maps are very well done and not simply imported from other sources -a clear indication that the authors really know their subject of Mexico.  To describe the Latin American urban model is one thing:  to view Figure 22.4 is to see it in effect and to understand its socio-economic impact (and politics?).  I can well see why the book should be promoted.

The linkages between models, theories, processes, and site are so clearly made that I could see the book being valuable for International Baccalaureate students; but I would not expect that to be the case for most senior high school students.  It is more likely to be used at university level….  Its comprehensiveness as a dual encyclopedia would make it an indispensable reference…

Reproduced by kind permission of Dr. Stuart Semple, Adjunct Professor of Geography in the Department of Geography and Environment at Mount Allison University, in Sackville, New Brunswick, Canada. Dr. Semple is a respected educator and a former Chief Geography Examiner of the International Baccalaureate (IB).

Rising Chinese labor costs: good news for Mexico

 Mexico's geography in the Press  Comments Off on Rising Chinese labor costs: good news for Mexico
Mar 312011
 

As labor costs in China rise, so more companies located there pull up stakes and move to Mexico, according to Spanish-language press reports. In 2002, wages were estimated to be 240% higher in Mexico than in China; the difference now is just 14%, and this is balanced by the savings in transport costs resulting from Mexico’s proximity to the USA. In addition, Mexican manufacturers tend to source more components from the USA than their Chinese counterparts.

In 2010, for the first time since China joined the World Trade Organization in 2002, Mexico’s share of US imports rose faster than China’s share. In 2010, Mexico had about 12% of the US import market, compared to China’s 19%.

Companies that have moved some or all of their production in the past year from China to Mexico include Meco Corporation (folding chairs and garden barbecues) which is opening a plant in Saltillo (Coahuila), and Coach Inc (premium leather goods). Mexico’s manufacturing exports jumped 30% in 2010 to 246 billion dollars.

See also: