admin

Remittances sent back to Mexico rose only 0.12% in 2010

 Updates to Geo-Mexico  Comments Off on Remittances sent back to Mexico rose only 0.12% in 2010
Feb 122011
 

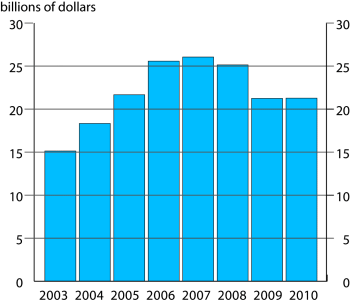
The graph below shows the trend in the total value of remittance payments sent home by Mexican migrant workers employed in the USA.

Remittances to Mexico, 2003-2010

Remittances to Mexico, 2003-2010

The graph shows how the total value of remittances sent home to Mexico rose rapidly from 2003 to 2007 before declining slightly in 2008 and then crashing in 2009 as the full effects of the recession in the USA became apparent. The good news for 2010 is that remittances have increased slightly; the bad news is that the increase is very, very small. Remittances remain well below their 2007 level.

The total value of remittances in 2010 was 21.271 billion dollars. Given change in the dollar-peso exchange rate over the year, and even before considering the impact of inflation, families that received the same number of dollars in 2010 as in 2009 were actually significantly worse off, with the lowest income families hit disproportionately hard.

Of the 32 states, the following 13 states all had lower remittances in 2010 than in 2009:

  • Chiapas
  • Hidalgo
  • Veracruz
  • State of México
  • Nuevo León
  • Tamaulipas
  • Tabasco
  • Chihuahua
  • Querétaro
  • Campeche
  • Nayarit
  • Puebla
  • Oaxaca

The “winners” who received more remittances in 2010 than in 2009 were:

  • Baja California
  • Baja California Sur
  • Sonora
  • Aguascalientes
  • Colima.

Related posts on this bog:

Migration between Mexico and the USA is the focus of chapter 25 of Geo-Mexico: the geography and dynamics of modern Mexico. Ask your library to buy a copy of this handy reference guide to all aspects of Mexico’s geography today! Better yet, order your own copy…

The ten states in Mexico with the highest population density in 2010

 Other, Teaching ideas  Comments Off on The ten states in Mexico with the highest population density in 2010
Feb 102011
 

The table below shows the ten states in Mexico with the highest population density (people per square kilometer) in 2010.

Question:

  • Find a blank map of Mexico [click here for a printable pdf map of Mexico] and locate each of these ten states.
  • What do these ten states have in common?
  • Can you suggest a reason or reasons for any pattern you have found?

[the answer appears at the end of this post; no peeping until you have come up with an answer!]

RankStatePopulation density, 2010 (people/square km)
1Federal District5,936.8
2State of Mexico678.9
3Morelos364.2
4Tlaxcala292.6
5Aguascalientes211.0
6Guanajuato179.2
7Puebla168.5
8Querétaro156.2
9Hidalgo128.0
10Colima115.5

Did you suggest that these states are all small in area? If so, well done! The list of the ten states with the highest population density includes the eight smallest states in Mexico in terms of area, and all ten of the states are in Mexico’s twelve smallest states. The other two small  states, neither of which has a very high population density, are Nayarit and Tabasco; they are both smaller than either Puebla or Guanajuato.

Why should small states have higher population densities than large states? The main reason is because it is likely that a higher percentage of their area will be used for villages, towns and cities, and there will be less countryside (where population densities are usually very low) than is likely in large states. Of course, many other factors also play a part, including the location of resources (minerals, soil, water, biodiversity), the opportunities for employment and the relative wealth of the area (people may migrate from poorer areas to areas which they think are richer or offer more opportunities).

In a future post, we will take a look at which states in Mexico have the lowest population density.But, before we do, which states do YOU think will have the lowest population density? Choose your “top ten”, make a list or mark them on your map, and come back to Geo-Mexico next week to see if you are right…

Feb 092011
 

Previous posts in this mini-series analyzed the recently released data on drug war deaths for Mexican states, the largest cities, and the communities with the highest death rates per 100,000 population. This post looks into the number and rates of drug war deaths for 25 communities with large numbers of non-Mexican (ex-pat) residents or visitors. Drug war deaths include deaths of drug cartel members, law enforcement personnel, and innocent by-standers.

Drug war death rates of larger communities of particular ex-pat interest were addressed in an earlier blog which focused on municipalities with populations over 750,000. The table (link above) indicates the number drug war related deaths (from December 2006 through December 2010) and the rate per 100,000 population in the 25 municipalities.

In general, these municipalities have death rates below the national average. The rates for Xalapa, La Paz, and Los Cabos are less than one eighth the national average. Those for Guanajuato and San Miguel de Allende are almost as good. Apparently, foreigners in these communities have relatively little to worry about with regard to drug war violence.

Only six of the 25 have death rates above the national average. Mazatlán has the highest drug war death rate, about four times the rate for all of Mexico, but still less than a fourth that of Ciudad Juárez. The rate for Playas de Rosarito is also very high, even higher than that of its northern neighbor Tijuana. Interestingly, its southern neighbor Ensenada has a low rate, about one eighth that Playas de Rosarito.

The drug war death rate for Tepic, Nayarit is over twice the national average. The rates are also relatively high for Cuernavaca and Nuevo Laredo. Actually, the rate for Nuevo Laredo is less than most of the smaller municipalities surrounding it. There is considerable variation among three adjoining municipalities near Lake Chapala: Ixtlahuacan (43.8), Jocotepec (28.5) and Chapala (18.4). All three have rates many times higher than the nearby city of Guadalajara (9.7).

I wonder how much these drug war death rates are affecting or will affect the choices that foreigners make concerning where to live or where to vacation in Mexico?

Previous posts in this mini-series:

Related posts about the geography of drug trafficking and drug cartels in Mexico:

Geo-Mexico: the geography and dynamics of modern Mexico discusses drug trafficking in several chapters. A text box on page 148 looks at trends in the drug trafficking business and efforts to control it. Buy your copy today to have a handy reference guide to all major aspects of Mexico’s geography!

The 10 states in Mexico with the lowest male-female ratios

 Other  Comments Off on The 10 states in Mexico with the lowest male-female ratios
Feb 072011
 

In an earlier post, we looked at the ten states with the highest male-female ratios (ie the most males for every 100 females). This time we turn our attention to the ten states with the lowest male-female ratios (or the most females for every 100 males). Male-female ratios are sometimes referred to as “sex ratios”, though that term does not indicate clearly whether the values are males for every 100 females (the usual interpretation) or females for every 100 males.

States with low male-female ratios

The 10 states with the lowest male-female ratios

Male-female ratios are an important demographic statistic and reflect numerous environmental, economic and social factors. In turn, they influence many aspects of economic and social geography. This Wikipedia entry on Human Sex Ratio offers a general introduction to some of the geography associated with male-female ratios.

The table and map show the 10 states in Mexico with the lowest male-female ratios.

RankStatemale-female ratio (males/100 females)number of females per 100 males
1=Federal District91.8108.9
1=Oaxaca91.8108.9
3Puebla92.1108.6
4Guanajuato92.8107.8
5Hidalgo93.2107.3
6Michoacán93.4107.1
7Morelos93.5107.0
8=Tlaxcala93.7106.7
8=Veracruz93.7106.7
10Querétaro94.3106.0

What do these states have in common?

The short answer would appear to be not very much, apart from forming a band across central Mexico!

The Federal District may offer far more employment opportunities for females than for males. Females who live in other states may be more likely to migrate to Mexico City in search of employment than to attempt the more complicated migration to the USA which has become the preferred option for many young males.

Oaxaca, along with Guanajuato and Michoacán, has a high rate of out-migration. In most situations, demographers consider that males are more more likely to migrate than females. This gender imbalance in migration would leave a low male-female ratio at the place of origin. Out-migration may also explain why Morelos and Tlaxcala, two of the smallest states in Mexico, are on the list.

In conclusion, while male-females ratios are an important population statistic, it is not necessarily always easy to explain them, especially when considering a country as complex as Mexico.

Relevant posts previously published on this blog:

Several chapters of Geo-Mexico: the geography and dynamics of modern Mexico discuss population issues, including population growth, distribution, gender differences and density. Buy your copy today to have a handy reference guide to all major aspects of Mexico’s geography!

Are the residents of Ciudad Nezahualcóyotl becoming middle class?

 Mexico's geography in the Press  Comments Off on Are the residents of Ciudad Nezahualcóyotl becoming middle class?
Feb 062011
 

In a previous post –Nezahualcoyotl, an irregular settlement which grew into a monster – we looked at the extraordinarily rapid growth of Ciudad Nezahualcóyotl (today a city of over 1.5 million inhabitants) from its start on the dried-up lake bed east of Mexico City in the 1950s.

Nezahualcoyotl, the city of dreams

Nezahualcoyotl, the city of dreams, now has its own Sears and Wal-Mart

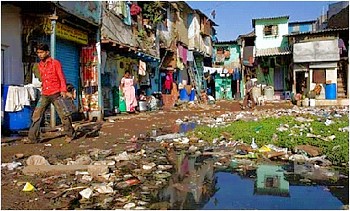
The Economist special report on Latin America (11 September 2010) included an evocative description of Ciudad Nezahualcóyotl, well worth reading. It describes how “an impoverished settlement of dirt streets and one-storey shacks built of grey concrete blocks” [ed: see photo] has become “comfortable homes of two or three storeys” with asphalted streets and “traffic-clogged thoroughfares… lined with businesses of every type”. Next to a Wal-Mart and private hospital is a shopping center with Sears and C&A, boutiques and a multiplex cinema.

The inhabitants aspirations have changed from bicycles to private cars, and include hopes of a higher education and finding a well-paid position elsewhere. The article concludes that the rise in living standards of many of the people is (arguably) creating  a “middle class” society, before examining the concept of “middle class” in much more depth.

Which communities in Mexico have the highest rates of drug war deaths?

 Updates to Geo-Mexico  Comments Off on Which communities in Mexico have the highest rates of drug war deaths?
Feb 052011
 

Guadalupe, in the state of Chihuahua, with 139 deaths among a population of only 6,458, has the highest drug war death rate in Mexico: 2,152 drug deaths per 100,000 population. Mier (Tamaulipas) and General Treviño (Nuevo León) are not far behind. Most of the municipalities in the attached table (link below) have rather small populations; 15 of the municipalities had fewer than 6,500 inhabitants in 2010.

A previous post noted that among big cities, Ciudad Juárez had the highest rate of drug war deaths by far, over twice the rate for the runner-up Culiacán in Sinaloa. However, Ciudad Juárez ranks only 10th when smaller municipalities are included in the analysis. The table lists the 20 municipalities with the highest rates of drug war related deaths (from December 2006 through December 2010) per 100,000 population. Drug war deaths include deaths of drug cartel members, law enforcement personnel, and innocent by-standers.

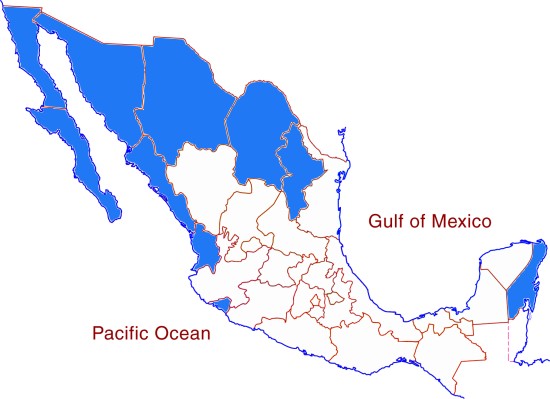
All 20 municipalities listed in the table are in one of four border states: Chihuahua, Sonora, Nuevo León and Tamaulipas. In fact, half of the 20 municipalities are in the state of Chihuahua. Five form a cluster around Ciudad Juárez on the border and four are just south of Chihuahua City. The three in Tamaulipas and three in Nuevo León are bunched together between Nuevo Laredo and Reynosa within 60 kilometers of the border. Three of the four in Sonora are not far from the highway joining the state capital Hermosillo with Nogales on the US border.

Previous posts in this mini-series:

Related posts about the geography of drug trafficking and drug cartels in Mexico:

Geo-Mexico: the geography and dynamics of modern Mexico discusses drug trafficking in several chapters. A text box on page 148 looks at trends in the drug trafficking business and efforts to control it. Buy your copy today to have a handy reference guide to all major aspects of Mexico’s geography!

Trends in income distribution in Mexico: are the poor getting poorer?

 Excerpts from Geo-Mexico, Updates to Geo-Mexico  Comments Off on Trends in income distribution in Mexico: are the poor getting poorer?
Feb 032011
 

Many proponents of the North American Free Trade Agreement (NAFTA) which came into effect in 1994 argued that it would stimulate Mexico’s economic development, leading to an increase in employment, and (in due course) higher wages. This would have a beneficial effect for the entire workforce but the effect would be most pronounced among the poorest 20%. It would help reduce the differential between their incomes and those of the middle income earners.

Opponents of NAFTA argued that free trade would have the opposite effect and would lead to a widening gap between the haves and the have-nots.

Which argument is right? Has the gap widened or narrowed?

Research addressing this question reveals the complexity of the issue. Complicating the situation is the economic instability which followed the passage of NAFTA as well as the significant urban–rural and regional inequality that persists in Mexico. Available data suggest that inequality increased during the 1980s and again slightly between 1996 and 1998 but inequality then declined until 2002. This decline appears to have continued. A chart published last year in The Economist (11 September 2010) shows a decline in Mexico’s Gini coefficient (ie a decline in inequality) of almost 1% between 2000 and 2006.

Researchers conclude that the giant gap between rich and poor will not decline naturally as the economy grows, but will require specific policy actions.

The overall impact from the global economic downturn which started in 2008 is not yet clear but past experience suggests that the gap tends to decline during economic hard times. Some economists argue that a trend of a widening gap between rich and poor was already evident in the years prior to NAFTA. If so, this suggests that globalization and Mexico’s support for free trade are not the only factors responsible for the apparently growing disparities of wealth in the country.

Even if the disparities are widening, it does not necessarily mean that the poor are getting poorer. It is perfectly possible that their real incomes (and standards of living) could increase, by say 10%, while those at the top increase by 15%. Both groups would therefore be getting richer, even though the gap between them widened. On the other hand, it is possible that both could be getting poorer, with the gap increasing or declining. Clearly, income data are difficult to analyze and we should be very cautious to avoid making any overly-simplistic statement about the poor getting poorer.

Inequality in wealth in Mexico: the GINI index

 Excerpts from Geo-Mexico  Comments Off on Inequality in wealth in Mexico: the GINI index
Feb 022011
 

Several chapters of Geo-Mexico: the geography and dynamics of modern Mexico look at inequalities in Mexico. The inequalities considered include inequalities related to physical geography (eg water availability), population dynamics (eg fertility rates), gender (eg. female employment), economics (eg GDP/person), development indices (eg HDI) and the distribution of wealth within the country, or within a subset of the country’s residents, such as those who live in a particular state.

Taking the country as a whole, Mexico has a very unequal distribution of wealth:

In 2005, the per person income for the richest 10% of the population in Mexico was $44,035. This figure is over four times the national average, indicating that per person income in Mexico is very unequally distributed. In fact only two countries—Brazil and South Africa—in the top twenty-five economies are more unequal. The average for all twenty-five countries is about three times the national average. The distribution in Japan and Italy is far more equitable; in both countries, the highest 10% get only about twice the national average. [Geo-Mexico, p 89]

If we want a more precise measure of how unevenly distributed the wealth or income is in a country, it is possible to calculate the country’s Gini coefficient. The Gini coefficient, or index, was developed by Italian statistician Corrado Gini :

Without going into all the mathematical details, Gini index values range from 0 (perfect equality) to 100 (extreme inequality with all wealth in the hands of a single individual).The Gini index at a national scale usually falls between 25 and 70. It provides a very useful way to compare income inequalities between countries or to analyze trends in income inequality over time.

In general, the Gini index loosely correlates with development, since most developed countries have lower Gini values (usually below 36) than more developing countries where the values often exceed 40. However, there are many notable exceptions. The USA has a Gini index of 45, higher than might be expected, and Bangladesh and Ethiopia both have relatively low Gini values of 33 and 30 respectively.

Mexico’s Gini index of 48 is high, indicating that inequality remains a real issue. Is Mexico’s inequality of wealth increasing or diminishing? There is little evidence that the GINI index has fallen significantly since the 1990s, though we will return to this question in a future post.

One important thing to note is that in Mexico’s case, its informal sector (not reflected in Gini calculations) may serve to ameliorate the degree of income disparities suggested by the Gini figure taken on its own. Some economists suggest that countries with such high Gini indexes need to double their rates of economic growth before they will succeed in reducing their incidence of poverty. [Geo-Mexico 89-90]

Mexico’s ambassador to the UK protests to the BBC

 Other  Comments Off on Mexico’s ambassador to the UK protests to the BBC
Feb 012011
 

Mexico’s ambassador to the UK, Eduardo Medina-Mora Icaza, has written to the BBC, demanding an apology for remarks made in a recent episode of Top Gear, the BBC’s flagship motoring program. Co-presenter Richard Hammond made the remarks during a review of the Mexican sports car, the Mastretta, labeling Mexicans as “lazy, feckless, flatulent and overweight”. The overweight comment might be accurate, but the ambassador is (rightly) outraged at the other words used by Hammond, and by other comments made in the show.

Jeremy Clarkson, Top Gear’s lead presenter, suggested at the time, and on air, that the Mexican ambassador would not complain about the comments because he would be slumped asleep in front of the television. The time has come for the BBC to make Clarkson eat his words, and issue a full apology.

The limited edition Mastretta MXT enters production this year; 150 cars will be made in the first year. It is the first sports car to be entirely Mexican designed and made.

[Uupdate: 2016 – The Mastretta MXT is no longer in production – see Mastretta press release]

Related post:

Is drug war violence concentrated in Mexico’s largest cities?

 Updates to Geo-Mexico  Comments Off on Is drug war violence concentrated in Mexico’s largest cities?
Feb 012011
 

It is commonly believed that crime and murder rates are highest in the largest cities. Is this the case for Mexican drug war deaths? Recently available data (from Mexican government) on drug war deaths indicate that this generalization is definitely NOT TRUE for Mexico’s largest cities. Drug war deaths include deaths of drug cartel members, law enforcement personnel, and innocent by-standers.

True, the largest numbers of deaths were recorded in some of the larger cities: Ciudad Juárez (6,637 deaths), Culiacán in the state of Sinaloa (1,890), Tijuana (1,667), Chihuahua City (1,415), and Acapulco (661). On the other hand, the number of deaths per 100,000 population was four to five times higher in some small municipalities in the states of Chihuahua, Sonora, Tamaulipas, and Nuevo León. A future post will take a more in-depth look at the drug war death rates in these smaller communities.

In this post, we consider only those Mexican municipalities whose 2010 population exceeded 700,000. The table below indicates drug war death rates per 100,000 population since December 2006 for the 22 Mexican municipalities with 2010 populations over 700,000. It is no surprise that the rate for Ciudad Juárez (484.7) is the highest, about 16 times the national average of 30.8. The city accounted for about 30% of the country’s drug war deaths during the four year period. In general, the cities with the highest rates are in the northern or western areas with concentrated drug cartel activity. However, Saltillo in the northern state of Coahuila has one of the lowest rates.

Only six of the largest 22 municipalities in the table have death rates above the national average. Monterrey is just below the average, Guadalajara is less than a third the average and Mexico City is less than a quarter. Two Mexico City suburbs, Nezahualcoyotl and Ecatepec in the State of Mexico, have rates nearly twice that of the capital, but are still less than half the national average. Zapopan, a suburb of Guadalajara has a rate 36% higher than Guadalajara.

Puebla, the center of the fourth largest metropolitan area in the country has an extremely low rate, less than 3% of the national average. Querétaro and Mérida also have very low rates.

Our next post in this mini-series will look at the smaller municipalities which tend to have the highest drug war death rates of all.

Previous posts in this mini-series:

Related posts about the geography of drug trafficking and drug cartels in Mexico:

Other relevant link

Geo-Mexico: the geography and dynamics of modern Mexico discusses drug trafficking in several chapters. A text box on page 148 looks at drug trafficking business and efforts to control it. Buy your copy today to have a handy reference guide to all major aspects of Mexico’s geography!

The 10 states in Mexico with the highest male-female ratios

 Other  Comments Off on The 10 states in Mexico with the highest male-female ratios
Jan 312011
 

Male-female ratios are a useful way of looking at population dynamics. They may reflect, or may influence, many aspects of social and economic geography from employment opportunities to rates and age of civil partnerships (including marriage).

In 2010, only four states in Mexico had more males than females: Baja California, Baja California Sur, Sonora and Quintana Roo (see table).

RankStateMale-Female ratio (males/100 females)
1Baja California Sur104.5
2Quintana Roo103.3
3Baja California101.8
4Sonora101.3
5Nayarit99.5
6Nuevo León99.4
7Sinaloa98.9
8Chihuahua98.7
9Coahuila98.6
10Colima98.4

States with high male-female ratios

The ten states with the highest male-female ratios (2010)

What do these states, at opposite extremes of the country, have in common?

They are among the most economically dynamic states. All except Sonora have a vibrant tourism sector, where employment opportunities in the construction sector (mainly for young males) have offered young people an alternative to migrating north of the border.

Sonora has a more mixed economy,which includes an important mining sector (another predominantly male source of employment), as well as agriculture, manufacturing and some tourism.

In a future post, and to avoid any accusation of gender bias, we will look at the states which have the highest proportion of females (i.e. the lowest male-female ratios, the lowest number of males/100 females).

Several chapters of Geo-Mexico: the geography and dynamics of modern Mexico discuss population issues, including population growth, distribution, gender differences and density. Buy your copy today to have a handy reference guide to all major aspects of Mexico’s geography!

The rates of drug war deaths vary enormously in Mexico’s states

 Updates to Geo-Mexico  Comments Off on The rates of drug war deaths vary enormously in Mexico’s states
Jan 292011
 

Despite what some media reports might suggest, not all parts of Mexico are plagued with serious drug war violence. A previous post – Deaths from war on drugs have increased rapidly since 2006 – discussed which states accounted for the most drug war deaths during the last four years and noted that these states were mostly in northern and western Mexico. The data on drug war deaths include deaths of drug cartel members, law enforcement personnel, and innocent by-standers.

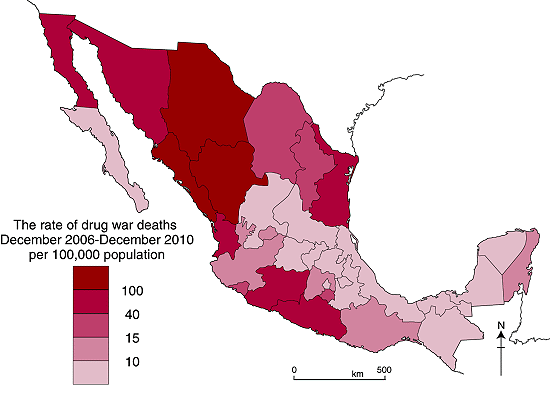
A more accurate way to compare states is to incorporate population to determine the rates of drug war deaths. The table above, and the map below, were compiled using the recently released data on deaths and the preliminary results of the 2010 census. There are some obvious methodological issues associated with combining drug war death figures for a four-year period with a population “snap shot” taken in mid-2010, but we believe these issues are minor and will not have any significant effect on the broad patterns of drug war deaths that the analysis reveals.

Drug war death rates, by state, December 2006-December 2010

The national average rate is 30.81 deaths per 100,000 population. It is not surprising that the State of Chihuahua, which led the country with 10,135 deaths, had the highest rate, almost 300 deaths per 100,000 population. The rate for Chihuahua is almost ten times the rate for the country as a whole. The rates for the other leading drug war states are significantly smaller, but way above the national average.

The four most populous states, Mexico, Federal District, Veracruz and Jalisco, are centrally located and have death rates ranging from half the national average for Jalisco down to about a fifth for Veracruz. Interestingly, for these four states the rates decline from west to east. This pattern does hold when less populous intervening states are included. Two of these, Querétaro and Puebla have about the lowest rates in the country, about one-fifteenth the national average.  Yucatán also has a very low rate. The drug war death rates for Tlaxcala, Puebla and Yucatán are less than one half of one percent of the rate in Chihuahua. Clearly, some parts of the country are far more affected by drug wars than others.

Previous post in this mini-series:

Related posts about the geography of drug trafficking and drug cartels in Mexico:

Other relevant link

Geo-Mexico: the geography and dynamics of modern Mexico discusses drug trafficking in several chapters. A text box on page 148 looks at the drug trafficking business and efforts to control it. Buy your copy today to have a handy reference guide to all major aspects of Mexico’s geography!

Deaths from war on drugs have increased rapidly since 2006

 Updates to Geo-Mexico  Comments Off on Deaths from war on drugs have increased rapidly since 2006
Jan 262011
 

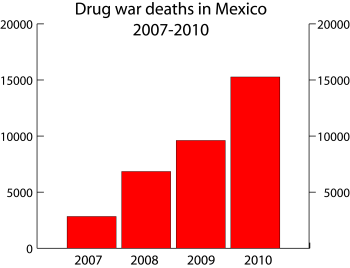
The Mexican Government recently released data on all the deaths in Mexico linked to drug wars for the period December 2006, when the drug wars started, through December 2010. The data include deaths of drug cartel members, law enforcement personnel, and innocent by-standers.  According to the data, 34,612 were killed in Mexico during this four year span, with 2010 being by far the most violent year with 15,273 deaths, 44% of the four year total. The 2010 total was 59% higher than 2009.

The graph below shows how rapidly the number of deaths resulting from the war on drugs has escalated. The crucial question now is, “Will drug war deaths continue to accelerate rapidly in 2011?”

Drug war deaths, 2007-2010

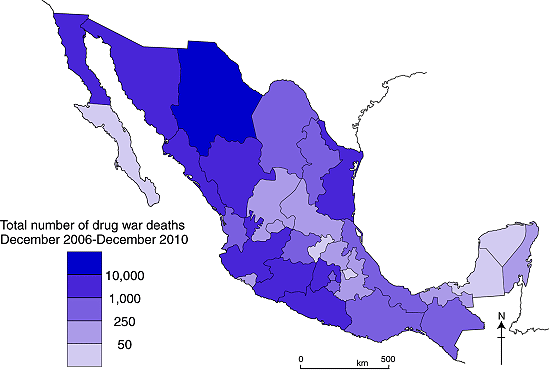
Not surprisingly, Chihuahua, led all other states with 10,135 deaths during the four year period, almost 30% of the total. In 2010 alone 4,427 were killed in Chihuahua, up 32% from 2009. This is a large one year acceleration in violence, but only about half the national increase of 59%. Most of the deaths in Chihuahua were in Ciudad Juarez, with 6,637, and Chihuahua City with 1,415. A later post in this mini-series will investigate drug war deaths in Mexico’s major cities. The map below shows the total number of deaths state-by-state for the period December 2006-December 2010.

Map of total drug war deaths 2007-2010
Map of total drug war deaths, December 2006-December 2010

As can be seen from the map, other states with very large numbers of deaths were Sinaloa (4,387 deaths, up 71% in 2010), Guerrero (2,736, up 29%), and Baja California (2,019 – 1,667 in Tijuana). Next came Durango (1,892 deaths), Michoacán (1,751, down 12%), State of Mexico (1,538), Tamaulipas (1,475), and Sonora, (1,258).

Tamaulipas burst onto the drug war scene in 2010 with 1,209 deaths in 2010 compared to “only” 90 in 2009, an increase of 1243%. The state with the greatest increase was San Luis Potosí which went from 8 deaths in 2009 to 135 in 2010, an increase of 1588%. The figure for 2010 alone was 72% of the four year total. Other states experiencing extremely rapid increases were Nayarit (919%) and Baja California Sur (900%), and Nuevo León (454%).

States with over 1,000 drug war deaths are all located in northern or western Mexico except for the centrally located State of Mexico, and perhaps Guerrero which might be considered a southern state.

At the other end of the spectrum, the states recording the fewest deaths during the four year period were Tlaxcala (13 deaths), Baja California Sur (19), Yucatán (26), Campeche (31) and Querétaro (37). While these were the least affected by drug war violence, the number of deaths in these states was still significant. During 2009 and 2010, Yucatán had only three deaths while Tlaxcala had ten and Baja California Sur had 11.

Related posts about the geography of drug trafficking and drug cartels in Mexico:

Geo-Mexico: the geography and dynamics of modern Mexico discusses drug trafficking in several chapters.  A text box on page 148 looks at drug trafficking business and efforts to control it.  Buy your copy today to have a handy reference guide to all major aspects of Mexico’s geography!

Population change in the Guadalajara Metropolitan Area

 Updates to Geo-Mexico  Comments Off on Population change in the Guadalajara Metropolitan Area
Jan 252011
 

The preliminary results of Mexico’s 2010 population census reveal that the population residing in the Guadalajara Metropolitan Area (GMA) increased from 3.7 million in 2000 to 4.4 million in 2010. The census results also show clearly that the GMA is continuing to experience the effects of suburbanization and counter-urbanization.

Suburbanization is the gradual spread of the urban area into the surrounding rural areas. The built-up area of Guadalajara is spreading mainly to the south and west. The north-eastern part of the city is unable to spread beyond its existing extent because it is hemmed in by the precipitous canyon of the River Santiago, often referred to as La Barranca de los Oblatos (Oblates‘ Canyon).

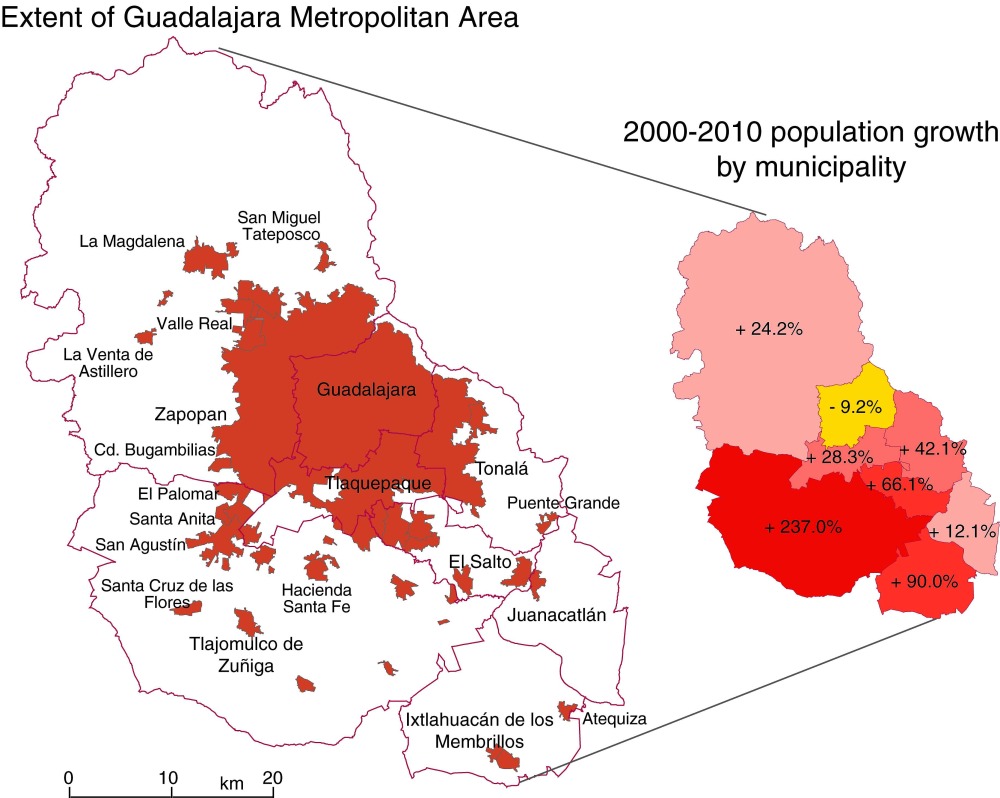
Counter-urbanization is the movement of city dwellers into smaller settlements in the surrounding countryside. With time, some of these smaller settlements are eventually engulfed by the spreading city. The precise boundaries of large metropolitan areas such as the GMA are therefore subject to almost constant change. The map below shows the population change for Guadalajara and its surrounding municipalities for the period 2000-2010.

Guadalajara Metropolitan Area
Population change in the Guadalajara Metropolitan Area, 2000-2010. Click to enlarge.

Note, first, that the population of Guadalajara proper (the municipality of that name) has actually declined significantly since 2000, from 1,647,720 to 1,494,134.

The city is not bounded by the municipal boundary, but spreads into several adjoining municipalities (see map), all of which have experienced population growth between 2000 and 2010. The municipality of Tlaquepaque was already “built up”, even prior to 2000, and its population has risen only slowly since that date. The slowest rate of growth (excluding the “negative growth” of Guadalajara) is in Zapopan; this is a complete change from 30 years ago when Zapopan was growing very rapidly as Guadalajara expanded westwards.

In the 1980s and 1990s, Guadalajara also spread into Tonalá and El Salto. El Salto, relatively close to Guadalajara’s international airport, and close to the main Guadalajara-Mexico City highway, is the heart of a major industrial corridor.  Its main focus in recent years has been on high-tech firms; the region is often referred to as “Mexico’s Silicon Valley”. Firms with manufacturing and/or assembly plants in or close to El Salto include Hewlett-Packard, IBM, General Electric, Intel, Hitachi, Siemens, Flextronics and Solectron. The El Salto area has seen moderate growth over the last ten years.

By far the most dramatic rates of growth for 2000-2010 occurred in Ixtlahuacán de los Membrillos. and in Tlajomulco de Zuñiga, which more than tripled its population in just ten years, from 123,220 to 416,552. Tlajomulco is a very old settlement indeed, with considerable historical importance. The spread of Guadalajara’s suburbs into the northern part of Tlajomulco has been astonishingly rapid, and represents a classic case of the process of suburbanization. Meanwhile, the population of the long-established settlement of Tlajomulco (further south in the eponymous municipality) has also risen rapidly as some urban dwellers choose, in the process of counter-urbanization, to live slightly outside the main urban sprawl of Guadalajara. The counter-urban movement is strongest in the settlements relatively close to the city, but now extends at least 50 km to the south, to the villages on the northern shore of Lake Chapala.

What will 2010-2020 bring? There are few signs that the building boom along the southern edge of Guadalajara Metropolitan Area is going to come to a halt any time soon. The state of Jalisco plans to construct an “outer ring road” south of the city. The planned route passes very close to the settlement of Tlajomulco. It is surely only a question of time before Tlajomulco, and various other small towns and villages, are swallowed up by the continuing expansion of Mexico’s second largest city.

The cultivation of oranges in Mexico

 Other  Comments Off on The cultivation of oranges in Mexico
Jan 242011
 

Oranges are one of the most popular fruits in Mexico. It may come as a surprise, but oranges are not a native fruit.

History of oranges in Mexico

The first oranges were brought on Columbus’ second voyage to the Americas. Early Spanish settlers began to cultivate orange trees almost as soon as they arrived.

For instance, in an early account of the town of Chapala, Father Antonio Tello, wrote that, “In 1562, Father Sebastián de Párraga came to this friary [Chapala] and planted the church’s orange trees.”

A later account describes Chapala in 1586 as having so many fruit trees that “the entire village is like an orchard. The Indians make a lot of orange blossom water and from it a lot of money. It is so fertile for oranges that, in the garden of the friary where there are many of these trees, they took from a sweet orange tree a branch that had eleven good, big, mature, yellow oranges, crammed together on top of each other.”

Aromatic orange blossoms have found numerous uses over the years, from being carried in wedding bouquets, to a cooking ingredient, to use in candies, teas and perfumes.

oranges

Production of oranges in Mexico

Orange trees may not be a native plant, but they have certainly thrived in Mexico, which is now the world’s fourth largest producer of oranges. Mexico produces about 4.1 million tons of oranges each year; only Brazil, the USA and India produce more.

The three main varieties grown in Mexico are:

  • Valencia or Valenciana – the prime orange for juice, ripens in May
  • Lane Late Navel oranges, available from February – primarily for eating, not good for juice
  • Navelina oranges, another variety of navel orange, used for juice, but also eaten, harvested from December

Ornamental orange trees, commonly found in Mexico’s towns and cities, are usually bitter oranges.

Areas where oranges are grown

Source: SAGARPA 2010

Where are oranges grown?

Veracruz is by far the leading state for growing oranges. It has 162,000 ha of orange orchards, and produces more than 2 million metric tons a year, about 51% of Mexico’s total production. Other states where orange growing is important include Tamaulipas (13% of national production), San Luis Potosí (10%), Puebla (6.2%), Nuevo León (4.9%) and Sonora (4.1%).

The area of cultivation for oranges (342,000 hectares nationwide) has remained virtually unchanged over the last decade.

The average yield across Mexico for oranges is about 12 tons/hectare, though yields in some states, such as Sonora, are up to twice as high. Yields vary from one year to the next reflecting seasonal weather conditions.

For those states where orange growing is an important rural occupation, the price paid in 2009 to the grower for oranges varied from 1.3 pesos/kg in Tamaulipas to 0.80 pesos/kg in Veracruz.

The market for oranges

Almost all production is for the domestic market. Consumption of oranges in Mexico averages about 38 kg/person/year.

Improving methods of cultivation have increased yields, allowing Mexico to produce a small surplus for export. Exports have more than doubled since 2000. Almost all exports are either to the USA 74.5% or the UK (24.6%), with the small remainder going to other European countries and Japan. Export sales were worth 7.150 million dollars in 2009, equivalent to about 1% of the total value of the orange harvest in Mexico. Imports of oranges in 2009 were worth 3.400 million dollars; they have fallen significantly from the 9 million dollars registered in 2003. The values for imports and exports mean that Mexico has a small favorable balance of trade from oranges of around 3 million dollars a year.

Main sources:

USA agrees to “bank” some of Mexico’s entitlement of Colorado River water

 Mexico's geography in the Press  Comments Off on USA agrees to “bank” some of Mexico’s entitlement of Colorado River water
Jan 222011
 

In an earlier post, we described a 1944 treaty that guaranteed Mexico would receive at least 1750 million cubic meters of water  each year along the Colorado River (via the Morelos diversionary dam in the Mexicali Valley). However, in April 2010, the Mexicali area was rattled by a large earthquake, so powerful that it moved the southern part of California,  and severely damaged the irrigation infrastructure used by Mexican farmers on land in the lower Colorado River valley and the Colorado River delta. In all, 640 kilometers of irrigation canals were damaged, affecting 60,000 hectares of farmland.

The damaged infrastructure meant that Mexico was unable to use effectively its total annual allocation of water. Even as urgent repairs were begun on pumps, pipelines and irrigation channels in the Mexicali region, Mexican authorities opened talks with the USA to discuss the possibility of deferring receipt of  some of their annual water quota.

The two governments have now agreed “Minute 318” which permits Mexico to decrease its consumption from 2010 to 2013 and then receive the “saved” water later when the irrigation channels are all operational again.

Another major related development concerning the Colorado River is also now getting underway. The two governments are starting talks this year towards a comprehensive new long-term bilateral agreement covering the management of the Colorado River.

Mexico’s water resources and water-related issues are the subject of chapters 6 and 7 of Geo-Mexico: the geography and dynamics of modern Mexico. Ask your library to buy a copy of this handy reference guide to all aspects of Mexico’s geography today! Better yet, order your own copy…

Jan 212011
 

Mexico’s Agriculture Secretariat (SAGARPA) has refused permission for transnational seed firm Monsanto to undertake larger-scale field trials of its GM corn in Sinaloa, and is opposing similar projects involving transgenic corn in Sonora and Tamaulipas. Monsanto is appealing SAGARPA’s initial decision. The other firms hoping to hold second-stage trials besides Monsanto are Dow Agrosciences (a unit of Dow Chemical Co.) and Pioneer Hi-Bred International (currently owned by DuPont).

Yum Kaax, the Mayan god of corn

What would Yum Kaax, the Mayan god of corn, think about GM corn?

As we noted in “The debate over GM corn in Mexico“, Mexico does not yet permit the commercialization of any genetically-modified corn, but Monsanto is betting on a relaxation of current rules as Mexico currently has to import large volumes of corn each year in order to satisfy domestic demand. Mexico’s corn imports are expected to rise from 10 to 15 million metric tons by 2020. Corn prices are also likely to rise since an increasing portion of the annual US corn crop is  destined for biofuel production rather than human consumption.

Monsanto argues that Mexico cannot guarantee its future food security unless it embraces the new agro-technology, and is threatening to withdraw 200 million dollars in planned investments over the next five years. A dozen agricultural organizations in the northern Mexico states of Sinaloa, Sonora, Chihuahua and Tamaulipas, have come out in support of Monsanto’s efforts to introduce transgenic corn, arguing that it is the best way for them to increase productivity and therefore becomes more competitive. The growers’ organizations claim that introducing GM crops has given their commercial competitors a competitive advantage in the marketplace.

The Agriculture Secretariat’s position reflects the concerns of farmers in other regions and ecologists who fear that the introduction of GM corn will displace or eradicate some of Mexico’s existing (non-GM) varieties. Protecting existing varieties of corn is the major motive behind the declaration by the governments of the Federal District and the state of Tlaxcala that their jurisdictions  are “GM-free zones”.

More ground cracks appearing in Mexico City and the Valley of Mexico

 Mexico's geography in the Press  Comments Off on More ground cracks appearing in Mexico City and the Valley of Mexico
Jan 192011
 

The continued sinking of some parts of Mexico City in response to the over-extraction of water from underground aquifers, and consequent shrinking of the subsoil, has resulted in dozens of cracks in recent years. As noted in a previous post – Why are some parts of Mexico City sinking into the old lakebed? – some buildings in Mexico City have dropped more than seven meters (23 ft) since 1891.

According to Gabriel Auvinet Guichard, a researcher at the Engineering Institute of the National University (UNAM), cracks are becoming increasingly frequent. The largest cracks are up to 22 meters (72 feet) deep and 30 meters long. The cracks damage buildings and infrastructure (especially roads and water pipes), and have alarmed residents in some areas in the city.

Auvinet’s team at UNAM’s Geoinformatics Laboratory is compiling a database of all known cracks. They plan to produce maps showing the incidence, location and origin of the cracks to help construction companies meet building regulations. The database has records of 380 fissures at present, but is still far from complete.

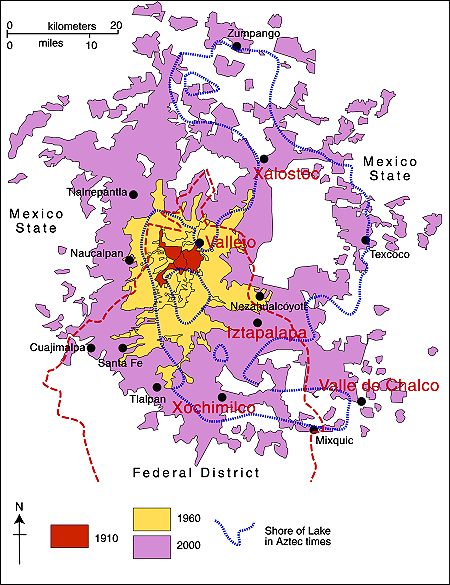
Some areas in the Valley of Mexico are much more prone to the earth movements leading to cracks than others. The areas with a high incidence of cracks include Iztapalapa, Chalco, Xochimilco, Xalostoc and Vallejo (see map).

Mexico City cracks map

Locations in Valley of Mexico with high incidence of ground cracks. Cartography: Tony Burton; all rights reserved.

Chapter 23 of Geo-Mexico: the geography and dynamics of modern Mexico looks at urban issues, problems and trends. To preview more parts of the book, click here and use amazon.com’s “Look Inside” feature.

Mexican drug traffickers expand their influence to Central America

 Mexico's geography in the Press  Comments Off on Mexican drug traffickers expand their influence to Central America
Jan 182011
 

According to an article by Nacha Cattan in The Christian Science Monitor, one of Mexico’s most violent drug gangs, the Zetas, have now expanded into Central America. It is yet another instance of the shifting allegiances which require another redrawing of the “map” showing the cartels’ competing and partially overlapping spheres of influence.

The Zetas started out in the 1990s as a group of ex-military strong-arm enforcers who had previously worked exclusively for Mexico’s Gulf Cartel. The Zetas rapidly established a reputation for extreme brutality, leaving severed heads as a sign of what they would do to anyone who opposed them. By the start of 2010, the Zetas had grown into an independent force controlling ever-increasing areas of north-eastern, central and western Mexico. They were pushed further west and south by an unlikely coalition of the Sinaloa cartel, the Gulf cartel and La Familia Michoacana, known as the New Federation. The Zetas have not limited themselves to drug trafficking, but have gradually extended their field of operations into many kinds of organized crime, especially kidnapping, extortion and the sex trade.

Now it seems that the Zetas have garnered support in Central America, where they have used local former military agents to keep their brand of discipline as they snare poverty-stricken youth into their organization. In Guatemala, the Zetas accused Guatemalan President Alvaro Colom of accepting millions of dollars in drug money, and threatened a sharp rise in civilian casualties if authorities continued to target their activities.

Honduras and El Salvador are also reported to house Zeta cells. This has prompted Mexico and several Central American countries to discuss forming anti-cartel alliances. The links between the Zeta cells in Central America and the hard-line Zeta forces in Mexico remain unclear. While some analysts claim the Zetas move to the south is because of successful law enforcement efforts in Mexico, others suggest that the Zetas are expanding in order to exert complete control over supply routes that originate or cross Central America.

Related posts about drug cartels in Mexico:

Two major aqueducts in the Lerma-Chapala basin

 Mexico's geography in the Press  Comments Off on Two major aqueducts in the Lerma-Chapala basin
Jan 152011
 

Two major new aqueducts will help to ensure reliable water supplies for Guadalajara and León, two rapidly growing cities in the Lerma-Chapala basin.

SIAPA (Sistema Intermunicipal de Agua Potable y Alcantarillado) is the acronym for the water supply system for the city of Guadalajara, Mexico’s second largest metropolitan area (population: 4.4 million). About 60% of Guadalajara’s potable water comes from Lake Chapala, the country’s largest natural lake, via an aqueduct. According to SIAPA Director José Luis Hernández Amaya, this existing aqueduct, built more than 20 years ago, is now inadequate. SIAPA now has construction permits in place to build a second aqueduct supplying water to the city from the lake. The plans for the second aqueduct have been approved by both state and federal regulatory bodies (the Comisión Estatal del Agua and the Comisión Nacional del Agua (Conagua) respectively).

All parties agree that boosting the amount of available water is essential for a city growing as rapidly as Guadalajara. The new aqueduct, likely to cost 2,000 million pesos, will enable the city to undertake maintenance as needed on the pumping stations and channels of both systems. Undertaking maintenance on the existing system without opening a parallel channel would involve cutting off the water supply for up to 60% of Guadalajara’s population for several days.

A new aqueduct is also planned for the city of León. According to recent press reports, the El Zapotillo dam on the Río Verde is about 21% complete. The resulting reservoir will guarantee adequate water supply for León (population: 1.6 million), and reduce its dependence on groundwater abstraction. Tenders are now being accepted for the construction of a 139-km-long aqueduct from El Zapotillo to join León’s potable water system, together with two pumping stations and a water purification plant.

The new reservoir and aqueduct should ensure that León’s water demands are met for between 25 and 30 years. In addition to León, several other municipalities will also benefit from an improved water supply, including Jalostotitlán, San Miguel el Alto, Encarnación de Díaz, San Juan de los Lagos and Lagos de Moreno.

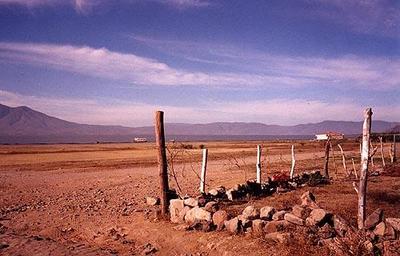
Lake Chapala in 2002

Lake Chapala in 2002, more like a desert than a lake. The lake has since recovered.

Neither plan is without its critics. Activists at Lake Chapala are concerned that supplying more water from the lake to Guadalajara will return the lake to the precarious state it was in during the 1990s. Opponents to El Zapatillo claim that the main demand for water in León is from the new industrial estates and leather tanning plants, and that supplying them with more water will only lead to further serious contamination and even more wastage of the valuable resource.

Rivers, reservoirs and water-related issues are discussed in chapters 6 and 7 of Geo-Mexico: the geography and dynamics of modern Mexico. Ask your library to buy a copy of this handy reference guide to all aspects of Mexico’s geography today! Better yet, order your own copy…

Ciudad Juárez faces economic fallout from the effects of the war on drugs

 Other  Comments Off on Ciudad Juárez faces economic fallout from the effects of the war on drugs
Jan 142011
 

Ciudad Juárez (2010 population: 1.3 million) is regularly in the news for all the wrong reasons. Many factors have combined to increase the insecurity (economic and social) of the city in recent years. They include:

  • the 2008-2010 recession in the USA
  • the ready availability of guns, mainly introduced illegally into Mexico from the USA
  • violence associated with the Juárez cartel in its efforts to control this international drug-smuggling gateway
  • “fund-raising” by the Juárez cartel, which includes the payment of protection money by local businesses, as many as 50% of which are thought to comply with cartel demands
  • violence between members of competing drug gangs
Poster advertising event in Plaza de las Americas, Cd. Juárez

Poster advertising event in Plaza de las Americas, Cd. Juárez

One particular commercial zone has been particularly badly hit. The Pronaf (Programa Nacional de la Frontera) zone is a commercial area in the northern part of Ciudad Juárez, centered on the Plaza de las Americas shopping center, immediately south of the Córdova-Américas International Bridge. The zone offers a mix of restaurants, stores, nightclubs, money exchange outlets, pharmacies and dental offices and even a museum. The customers for the businesses in this area are mainly US tourists and the many daily commuters across the border.

The result of increased levels of violence and unrest is that an estimated 60% of the 400 or so businesses that were open prior to 2008 in the Pronaf zone have now closed. This has caused a large number of job losses, exacerbating the economic difficulties already faced by hundreds of families.

Map of Pronaf zone

Related post about drug cartels in Mexico

Chapters 21 and 22 of Geo-Mexico: the geography and dynamics of modern Mexico analyze Mexico’s 500-year transition to an urban society and the internal geography of Mexico’s cities. Chapter 23 looks at urban issues, problems and trends. An overview of the geography of drug trafficking in Mexico forms part of chapter 20. To preview more parts of the book, click here and use amazon.com’s “Look Inside” feature; buy your copy today!

Mexican geophysicists develop new model for hurricane forecasting

 Mexico's geography in the Press  Comments Off on Mexican geophysicists develop new model for hurricane forecasting
Jan 112011
 

The new methods, using physics rather than mathematics as the basis, can be used to forecast the timing of Category 5 hurricanes, the most severe level on the Saffir-Simpson scale.

Category 5 hurricanes have sustained wind speeds of up to 250 km/hr, with catastrophic impacts on homes, lives and infrastructure. The most recent Category 5 hurricanes to strike Mexico are Dean (2007), Wilma (2005), Mitch (1998), Gilbert (1988) and Beulah (1967).

Scientists at the Geophysics Institute of the National University (UNAM) in Mexico City have developed a physics-based model, relying on three-dimensional imaging, which can be used to predict severe (Category 5) hurricanes. They have also pin-pointed precisely where in the deep waters of the Atlantic Ocean severe hurricanes are most likely to originate. The scientists conclude that severe hurricanes do not occur randomly in time, but tend to occur at roughly cyclical intervals, about every ten years.

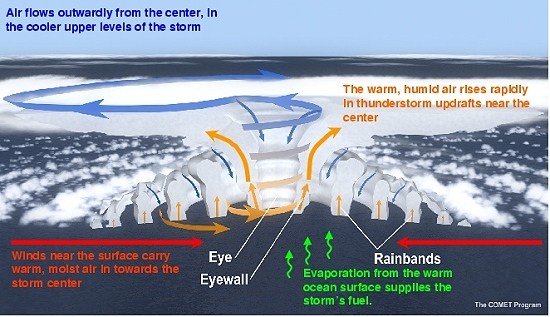
Diagram showing features of the existing GFDL Hurricane Prediction System

Diagram showing features of the existing GFDL Hurricane Prediction System

They hope that the new techniques will improve the forecasting associated with these severe weather hazards, and offer more lead-in time for the updating and implementation of evacuation plans and other mitigation measures.

Lead investigator Víctor Manuel Velasco Herrera says that, according to the model, the next period when Category 5 hurricanes will occur will begin in 2013 and end in 2017, “with a margin of error of one year.”

Watch this space for updates in due course!

Previous posts related to hurricane prediction:

Hurricanes and other climatological phenomena are analyzed in chapters 4 and 7 of Geo-Mexico: the geography and dynamics of modern Mexico. Buy your copy today, so you have a handy reference guide available whenever you need it.

Jan 102011
 

We saw in an earlier post – Mexico’s shoe (footwear) manufacturing industry: regional clustering – that Mexico’s shoe manufacturing is concentrated in three major areas: León (Guanajuato), Guadalajara (Jalisco) and in/around Mexico City.

Shoes are also an important international trade item. Latin America’s largest international footwear trade show is SAPICA (Salón de la Piel y el Calzado), which is held in León twice a year. Each time, it attracts 12,000 buyers from the USA, Canada, Europe, Japan, and Central and South America.

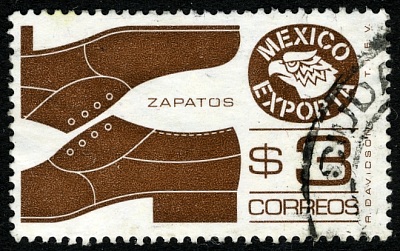
Mexico exports: shoes

Mexico exports: shoes

Exports

  • Export volume: 15 million pairs/yr
  • Value of exports: $250 million (dollars). Exports have risen steadily since 2006, despite the global economic difficulties.
  • Export destinations, by volume: USA 82%, Brazil 5%, Guatemala 2%, Japan 2% and Canada 2%.
  • Export destinations, by value: USA 84%, Japan 4%, Canada 2%, France 1% and Brazil 1%.

Imports

  • Import volume: 45 million pairs/yr
  • Value of imports: $450 million; this figure is rising at 15-20%/yr
  • Sources of imports, by volume: Vietnam 39%, Indonesia 21%, China 11%, Brazil 7%, Malaysia 5% and Thailand 5%.
  • Sources of imports, by value: Vietnam 43%, Indonesia 16%, China 14%, Italy 7% and Spain 6%.

Q. What can you deduce about Mexico’s international shoe imports and exports by comparing the percentages for trade by volume and trade by value? (eg. which countries supply more expensive shoes?)

The threat from China

At first sight, these figures do not suggest that Mexican manufacturers have much to worry about from Chinese shoe manufacturers. However, it is believed that many of the shoes entering Mexico from Vietnam and Indonesia actually originate in China. In addition, some Chinese shoes are thought to be repackaged in the USA for eventual export to Mexico.

Shoe manufacturers’ representatives in Mexico opposed China’s entry into the World Trade Organization (WTO) since they feared it would unleash a flood of cheap Chinese imports into the country. In an effort to help protect national manufacturers, the Mexican government has, for most of the past 20 years, levied a compensatory 35% tariff on shoes originating in China.

Challenges faced by Mexico’s shoe industry

  • Mexico’s shoe industry faces periodic shortages of some raw materials. In addition, the sector’s supply chains and delivery systems need strengthening.
  • The improvement of product quality may require further investment in technology and research.
  • As tariff barriers are lifted, Mexico’s shoe manufacturers will face greatly increased competition from overseas.

Source of statistics: CICEG (Guanajuato Shoe Manufacturers Association) Situación de la industria del calzado en México.

Related posts:

Mexico’s economic geography is analyzed in chapters 14–20 of Geo-Mexico: the geography and dynamics of modern Mexico. Buy your copy of this invaluable reference guide today!

New aqueduct should guarantee water supply for the city of Hermosillo

 Mexico's geography in the Press  Comments Off on New aqueduct should guarantee water supply for the city of Hermosillo
Jan 082011
 

According to press reports, construction is underway of the “Independence Aqueduct” which will carry water from the Plutarco Elías Calles reservoir on the Yaqui River, in southern Sonora, to Hermosillo, the state’s capital city. The reservoir is the 11th largest in Mexico with a capacity of 2,925 million cubic meters.

Javier Gándara Magaña, the mayor of Hermosillo (population 780,000), expects the 150-km-long aqueduct to be functioning by 2012 though he has warned residents that water brought from the reservoir (commonly known as El Novillo) will be more expensive than that from existing sources. City authorities plan to have installed water meters in every dwelling prior to the completion of the aqueduct.

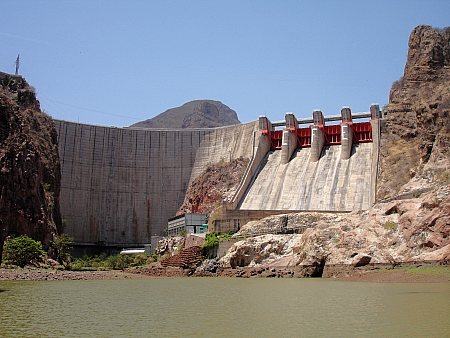
novillo dam sonora

Curtain of El Novillo dam, Sonora

The aqueduct will supply 75 million cubic meters a year to the city, and represents a long-awaited, and long-term, solution to the water problems faced by Hermosillo, which is located in one of the driest regions of the country. At a later stage, the reservoir will also supply 500 million cubic meters a year to the municipality of Cajeme, in the northwest of the state.

Construction of the aqueduct is opposed by many members of the indigenous Yaqui communities and by agricultural producers farming the Yaqui Valley in the south of Sonora who claim that diverting water to Hermosillo will jeopardize the long-term water security for their operations.

Rivers, reservoirs and water-related issues are discussed in chapters 6 and 7 of Geo-Mexico: the geography and dynamics of modern Mexico. Ask your library to buy a copy of this handy reference guide to all aspects of Mexico’s geography today! Better yet, order your own copy…

Jan 052011
 

Mexico’s footwear industry is heavily concentrated in three main locations. Manufacturing is focused on the city of León in the state of Guanajuato. Factories and workshops in León account for about 68% of all shoes made in Mexico. The two other important manufacturing areas for footwear are Guadalajara (Jalisco) where about 18% of the national production originates, and Mexico City (together with surrounding parts of the State of Mexico), responsible for 12%.

How has this concentration come about?

León, in Guanajuato, is the center of one of the world’s most complete leather and footwear clusters. The area is a leading supplier and exporter of footwear, saddles and hats.

Footwear has been made in Guanajuato since 1645. The earliest association of shoe makers dates back to 1808. The sector is dominated today by firms with majority Mexican capital. Several of the foreign firms which manufactured shoes here prior to the second world war, changed the focus of their production lines in the early 1940s to specialize in supplying military footwear, leaving the making of consumer footwear to firms with national capital.
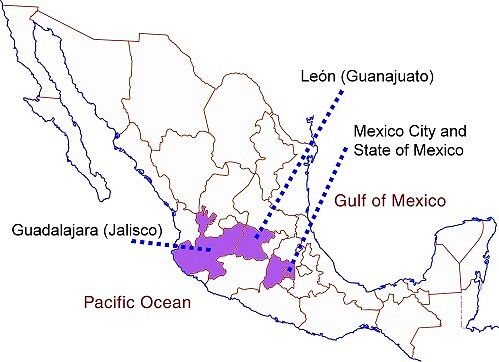
Footwear industry in Mexico

Concentration of shoe industry in Mexico.

The advantages of concentration

1. Local raw materials. Local inputs of leather and synthetics reduce the transportation costs (and time) for obtaining raw materials

2. Shared suppliers. Supporting the leather and footwear firms are local suppliers which offer machinery and equipment for tanneries, chemicals, leathers and skins, synthetic materials, dyes and textiles, as well as more specialized shoe-related items such as lasts, soles and heels, accessories and fittings. Shared information and machinery Because the shoe firms are grouped together in a cluster, ideas and information and even specialized machinery can all be shared.

3. Labor. This area has long specialized in footwear and leather products, so all firms benefit from the skilled local labor force.

4. Linkages. Both vertical and horizontal linkages between companies are important in the shoe industry. Vertical linkages occur when one company controls many or all stages in the production line. For instance, a company may make its own accessories and fittings to attach to the shoes it makes, or it may tan its own leather.  Horizontal linkages exist where one company is supplied with components (heels, soles) made by another company.

5. Economies of scale.

6. Educational infrastructure. The León area has a variety of educational, training and research centers all supporting the leather and footwear sector. This increases the chances of technological innovations, and the speed of their adoption.

The major advantages of León as an industrial location:

The position of León is key to its success. It is located in central Mexico, close to the major urban areas of Mexico City, Querétaro and Guadalajara. On a broader scale, it is close to the major export markets of the USA, Canada and Central America.

Market proximity is enhanced by an excellent communications network, including good road and rail links, easy access to several major airports, and to seaports such as Manzanillo.

The basic statistics (2009-2010):

  • Number of footwear-related firms: about 8000, half of them in Guanajuato.
  • Size of firms: 56% micro (fewer than 10 employees), 33% small (10-50 employees).
  • Employment: the footwear sector provides 140,000 direct jobs, and twice as many indirect jobs, for a total of 420,000.
  • Mexico’s largest shoe maker: Emyco, whose 4,500 workers make 6 million pairs of shoes, boots and sandals (various brands) every year. This firm alone introduces 100 new models every three months.
  • Production volume: 250 million pairs/yr, about 1.6% of world total.
  • Domestic market: 285 million pairs/yr (average of 2.5 pairs/person/yr)

The domestic market is focused on low-cost shoes, with a few exceptions, such as the market for “cowboy” boots. The manufacture of hand-crafted, high-priced cowboy boots is dominated by smaller firms such as Botas Je-Ver, Botas Jaca and Rancho-Boots, each of which employs 50-200 workers. Some cowboy boots are made from exotic hides, such as crocodile, cayman, armadillo, iguana, ostrich and snake. They are a much-prized status symbol among the upper echelons of Mexico’s drug cartels!

In future posts, we will examine Mexico’s imports and exports of shoes, and see if it is possible to identify any patterns to the distribution of shoe retailers in some of Mexico’s major cities.

Source of statistics: CICEG (Guanajuato Shoe Manufacturers Association) Situación de la industria del calzado en México.

Related posts:

Mexico’s economic geography is analyzed in chapters 14–20 of Geo-Mexico: the geography and dynamics of modern Mexico. Buy your copy of this invaluable reference guide today!
Mexico’s farm workers move north, US agri-businesses move south…

 Mexico's geography in the Press  Comments Off on Mexico’s farm workers move north, US agri-businesses move south…
Jan 032011
 

Mexican migrant workers have played an important role in US agriculture for decades, especially during harvest time, when they fill temporary menial and low-paid positions.

In recent years, border restrictions and periodic US crack-downs on the employment of undocumented workers have reduced the number of Mexicans seeking seasonal jobs north of the border. This has apparently resulted in some US agricultural enterprises deciding to shift their production centers into Mexico – if the workers won’t come to the farms, then the farms have to come to the workers…

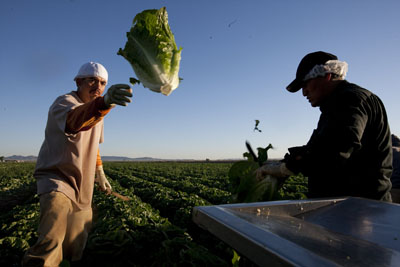
Lettuce farm

Steve Scaroni's lettuce farm. Photo: Janet Jarman, The World.

One example, that of a major lettuce grower, is described in detail in the Public Radio International’s The World program American farmers move to Mexico, which includes an interesting audio clip of Steve Scaroni describing why he’s moved half his lettuce-growing business south to the state of Guanajuato.

Scaroni’s company plants, harvests and processes 20 million servings of lettuce each week, mostly distributed via US supermarkets.

Scaroni compares the pay of each field worker in Arizona or California of $9-$10 an hour, with the $12 to $15 he pays in Mexico per day. Wage differentials are not the only advantage. Geographical diversification into Mexico also spreads the risk (and increases his firm’s resilience) in the event of adverse weather conditions.

On the flip side, Scaroni has to cope with added transportation costs, the complexities of the Mexican tax system, and supply problems for vital inputs such as fertilizers.

Scaroni supports a proposed US immigration bill known as “AgJobs” which would give farm workers more rights, offer a path to legal status, and make it easier for American farmers to bring in temporary immigrant workers.

Mexico’s agriculture is analyzed in chapter 15 of Geo-Mexico: the geography and dynamics of modern Mexico. and concepts of sustainability are explored in chapters 19 and 30.  Buy your copy today, so you have this handy reference guide to all aspects of Mexico’s geography available whenever you need it.

On-going changes in the migration landscape of Tijuana, Baja California

 Mexico's geography in the Press  Comments Off on On-going changes in the migration landscape of Tijuana, Baja California
Jan 012011
 

An interesting recent Salem-News.com article summarizes the effects on the migration landscape of the city of Tijuana, Baja California, of the USA’s imposition of tighter border controls, including walls, fences and helicopter patrols.

There is no question that the economic downturn since 2008 and toughened border controls have reduced the number of migrants entering the USA. However, this has channeled the most determined would-be migrants into more challenging (and often more dangerous) options. It has also pushed the costs up. Twenty years ago, a few hundred dollars was probably sufficient to enlist the help of a “pollero” to cross the border undetected. Today, border gangs want several thousand dollars from each undocumented migrant who seeks their assistance.

Three favored options for crossing the border:

  • pay a smuggling gang $2,000 – $3,000 for a trip across the desert or mountains between Mexicali and Arizona.
  • pay up to $7,000 for a trip through one of the narco-tunnels (used mainly by drug smugglers)
  • pay up to $8,000 for a place on a high-speed boat leaving from Rosarito Beach and landing somewhere on the California coastline
  • the alternative is a dangerous solo hike across desert or mountains, through areas where many migrants have lost their lives.

Border security changes have had some major effects on Tijuana:

  • many migrants are unable to cross, swelling the numbers of poorly skilled workers in the Tijuana workforce. With insufficient formal sector jobs for all these workers, many enter the murky worlds of pornography, drug trafficking and the sex trade.
  • those unable to migrate tend to live in Tijuana’s lowest-income neighborhoods such as Valle Verde, Obrera, Lomas Taurinas, La Esperanza, El Niño and La Morita, which are growing very rapidly
  • more power has been gained by the organized gangs of traffickers, since they are the only ones with the resources to help undocumented migrants attempt to cross the border

Previous posts related to Mexican migrants in the USA:

Migration between Mexico and the USA is the focus of chapter 25 of Geo-Mexico: the geography and dynamics of modern Mexico. Ask your library to buy a copy of this handy reference guide to all aspects of Mexico’s geography today! Better yet, order your own copy…

Expected impact on Mexico of global climate change

 Other  Comments Off on Expected impact on Mexico of global climate change
Dec 222010
 

The overall temperature of the earth is increasing faster now than it has for many millennia. According to a 2007 Intergovernmental Panel on Climate Change (IPCC) paper, the global surface temperature is expected to increase by 1.1 to 6.4 degrees C (2.0 to 11.5 degrees F) during the 21st century. According to the models, global warming will be most pronounced in the Arctic resulting in the melting of glaciers, permafrost and sea ice. Warming is expected to be less pronounced in Antarctic areas.

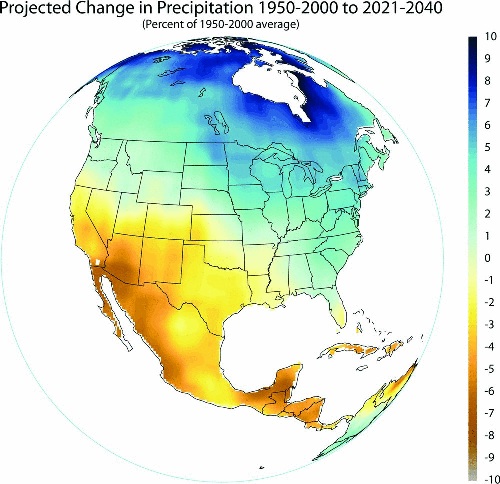
Precipitation change in Mexico, 1950-2000 and 2021-2040

Precipitation change in Mexico, from 1950-2000 to 2021-2040. Image/data: Gabriel Vecchi, Geophysical Fluid Dynamics Laboratory, National Oceanic and Atmospheric Administration.

Given the high average altitude of Mexico, the temperature changes and raising sea level should have less impact on Mexico than most other countries. Still, low laying areas of Mexico will be affected significantly.

Global warming will have profound impacts on the world’s climate. The most severe impacts on Mexico, and perhaps the whole Earth, could very well result more from climate change than global warming per se. In general, the affects will involve significant changes in average annual amounts of precipitation as well as huge year to year variability.

Mexico will experience significantly more severe droughts, floods, and storms including hurricanes. This trend has already started. In the 25 years between 1960 and 1985, Mexico experienced one category five hurricane – Beulah in 1967. In the 25 years since 1985, four category five hurricanes hit Mexico: Gilbert – 1988, Mitch – 1998, Wilma – 2005, and Dean – 2007. Fortunately, no category five hurricanes struck Mexico in 2009 or 2010. Are we due in 2011?

In general, precipitation in Mexico is expected to decline significantly in the next several decades. As you can see on the map, Western Mexico and the Yucatan will get 5% to 8% less rain. This is particularly important to Northwestern Mexico which is the most arid part of the country. Unfortunately, with the expected large increase in year to year variability, this part of Mexico is expected to suffer many very serious droughts. Obviously, less rainfall and greater variability will have gigantic impacts on Mexican agriculture, especially in the drier western areas.

Dec 182010
 

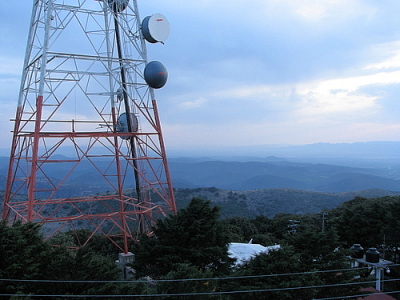
One of Mexico’s best kept travel secrets for people driving their own vehicle is the multitude of road signs all beginning with the word “microondas” (literally “microwaves”). Even visitors with good Spanish and a bilingual dictionary in their glove compartment may puzzle over the meaning of this frequently occurring sign, which invariably seems to lead onto a cobblestone track going, so far as one can tell, absolutely nowhere! There is no distant church tower, no sign of habitation, just a radio mast on the distant skyline. And that (rather than microwave ovens) is precisely what the sign refers to: a short-wave communications post!

One of the numerous benefits for the geographer is that virtually any microondas station offers a short, usually interesting side-trip, ideal for a brief respite from the demands of high speed highway driving. The well maintained, cobblestone tracks that provide access to the communications towers serve not only engineers, but also enterprising tourists. The access roads may follow devious routes but they eventually reach the gates of a fenced enclosure, invariably situated on the highest point for several miles in any direction. While there is no guarantee of an uninterrupted view, most microondas stations afford tremendous vistas over the surrounding countryside.

Microondas at top of Cerro de los Caballos. Photo: Gabriel Chaparro Tre….

View from the Microondas atop Cerro de los Caballos. Photo: Gabriel Chaparro Tre….

Very few vehicles use these excellent side roads, so they are usually safe and convenient places to stop, take a rest, stretch your legs and enjoy a picnic. As the tracks wind upwards, they often traverse successive vegetation zones, going from oak woodland up into pine forest if the mountain is high enough, for instance. This provides botanists and birders a range of habitats and transition zones worth exploring. Of course, some microondas sit on top of small mounds surrounded by a seemingly limitless flat and monotonous plain, home only to an infinite number of cacti. But others, the jewels of their kind, are in the midst of tropical rainforest looking out over canyons where spider monkeys can be seen leaping from branch to branch.

In the volcanic central areas of Mexico, microondas stations are commonly perched on crater rims, making many volcanoes fall in the “drive-in” category, including the Volcán Nevado de Toluca (Xinantécatl).  Full descriptions of the scenic wonders to be encountered on drives up, for example, Ceboruco volcano or Tequila volcano (the former in Nayarit state, the latter in Jalisco) merit a book unto themselves. To anyone who has never seen the legacies of past vulcanicity at close quarters, what more awesome and eye-opening introduction could there possibly be?

Needless to say, though you’re never far from the highway, you mustn’t expect to find any tourist amenities at microondas, not even “microwaved” fast-food. But don’t let that put you off visiting Mexican-style microwaves.

So, next time you spy “microondas” on a road sign (or, if you’re reading this in the depths of northern winter, the next time you press a button on your microwave!), remember – a short detour along one of Mexico’s best-kept travel secrets might well lead you to discover your own favorite stopping place. Someday, somewhere, someone should produce a comprehensive guide to the microondas of Mexico…

Mexico’s volcanic landscapes are discussed in chapters 2 and 3 of Geo-Mexico: the geography and dynamics of modern Mexico. Buy a copy as a seasonal gift today!