How accurate was last year’s hurricane prediction?

 Other  Comments Off on How accurate was last year’s hurricane prediction?
Jan 162012
 

The annual prediction of the hurricane activity on the Atlantic/Gulf/Caribbean side of Mexico for 2011 by Dr Philip Klotzbach and Dr. William Gray (Colorado State University) was for a slightly more active season than in 2010. For 2011, they introduced some modifications to their predictive model, which now takes into account:

  • Predictor 1. Gradient of sea surface temperatures (SST) in February-March between the Eastern Subtropical region of the Atlantic and the South Atlantic. This has a positive connection with hurricane activity.
  • Predictor 2. Air pressure at sea level in March in the Subtropical Atlantic. This has a negative connection with hurricane activity.
  • Predictor 3. Air pressure at sea level in February in the South-Eastern Pacific. This new variable has a positive connection with hurricane activity.
  • Predictor 4. Forecast made in March from Central Europe for sea surface temperatures in September for the El Niño-3 region. This new predictor has a negative connection with hurricane activity.
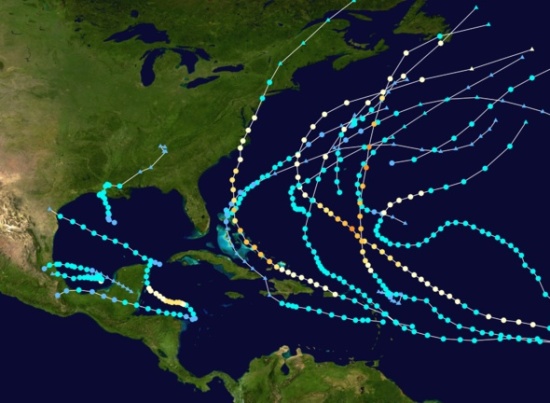
Tracks of Atlantic Hurricanes, 2011

Tracks of Atlantic Hurricanes, 2011

In April, the prediction for the 2011 Atlantic/Caribbean hurricane season was for 16 tropical cyclones, including 7 tropical storms, 4 moderate hurricanes (Category 1 or 2 on the Saffir-Simpson scale) and 5 strong hurricanes (C 3, 4 or 5).

This prediction proved to be quite good. In the event, there were actually 19 tropical cyclones, including 12 tropical storms, 4 moderate hurricanes (C1, C2) and 3 strong hurricanes (one C3 and two C4).

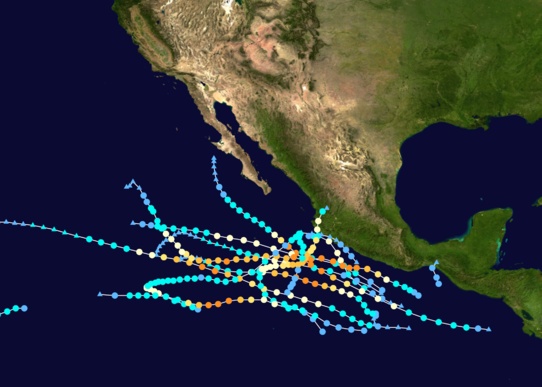
Tracks of Pacific Hurricanes, 2011

Tracks of Pacific Hurricanes, 2011

On the Pacific coast, the 2011 season saw 11 tropical cyclones including 1 tropical storm, 4 moderate hurricanes and 6 strong hurricanes. Fortunately, almost all these cyclones remained out at sea and only Hurricane Jova, which reached category 3 in early October, caused any significant damage on land (see Hurricane Jova smashes into Barra de Navidad and Melaque on Mexico’s Pacific Coast).

Want to read more?

Related posts:

Four new municipalities change the map of Chiapas

 Other  Comments Off on Four new municipalities change the map of Chiapas
Jan 142012
 

The Chiapas state government has redrawn the map of its municipal boundaries to create four new municipalities (municipios), bringing the number in the state to 122. The four new municipalities are:

1. Belisario Domínguez (formerly part of the municipality of Cintalapa de Figueroa). The new municipio aims to resolve a long-standing agrarian conflict over land and forest rights with San Miguel Chimalapa and Santa María Chimalapa, both in neighboring Oaxaca. The municipal seat of the new municipality is Rodulfo Figueroa. The municipality also includes the settlements of Gustavo Díaz Ordaz, La Hondonada, San Marcos, Montebello and Flor de Chiapas.

2. Emiliano Zapata is the new municipality responsible for the 20 de Noviembre ejido, formerly part of the Villa de Acala municipality.

3. El Parral, previously the largest settlement in Chiapas that was not a municipal seat, now becomes the municipal seat for the El Parral ejido, formerly part of the Villacorzo municipality.

4. Mezcalapa is a new municipality which serves the settlement of Raudales Malpaso, cut off decades ago from its former municipal seat of Tecpatán by the construction of a reservoir.

The total number of municipalities (municipios) in Mexico is currently 2,458. Note that this figure includes the 16 delegaciones (boroughs) of Mexico City which, while technically not municipalities, do have significant autonomy.

Why do Mexican seasonal farmworkers in Leamington, Ontario, have their own consulate?

 Other  Comments Off on Why do Mexican seasonal farmworkers in Leamington, Ontario, have their own consulate?
Jan 122012
 

The list of Mexican consulates in Canada on the website of the Mexican Embassy in Ottawa includes one massive surprise. In addition to consulates in such obvious locations as Toronto, Vancouver, Montreal and Calgary, it also includes one in the small city of Leamington in Ontario, designated to provide service to Essex County (South).

Just why is there a Mexican consulate in a city of only 31,000 people?

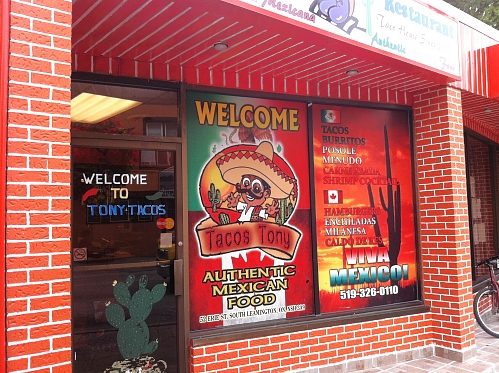
Tacos Tony. Photo Steve Cylka

Tacos Tony. Photo Steve Cylka (www.theblackpeppercorn.com)

Leamington, established in 1890, is a small city (population 31,000) 50 km southeast of Windsor, on the shores of Lake Erie, near Point Pelee, Canada’s southernmost point. The city is a mix of different ethnic groups. From the 1920s to the 1940s, it attracted waves of German-speaking immigrants from Europe, including some German-speaking Mennonites from Russia, as well as Italians and Portuguese. In the 1950s, it became home to returning Mennonites from Mexico, whose families had lived in Canada prior to the 1920s when they had relocated to Mexico. The city reflects its ethnic diversity, with German bakeries, an Italian fountain, Tony’s Mexican tacos, and a Lebanese Club.

For the fascinating perspectives of two generations in a single family on (im)migration, settlement, and home-making in a small city in Ontario with close ties to Mexico, see Leamington, Ontario: Bloom or Bust by Tonya Davidson and Katherine Davidson.

Leamington is home to H.J. Heinz’s second largest plant in the world. The city is Canada’s greenhouse capital, with 485 ha (1200 acres) of greenhouses which yield 500 million tomatoes a year and provide several thousand jobs, many of them seasonal. Since 1974, as many as 4000 Mexican farm laborers come to Leamington for up to eight months each year to harvest the tomatoes. They are not the latest wave of permanent migrants but belong to the Seasonal Agricultural Workers’ Program. To qualify for the program workers have to be male, married, with limited education and strong family ties back home in Mexico. When seasonal work ends, they have to return home.

Their life in Canada, a mixture of opportunity and exploitation, was the subject of El Contrato: The Contract, Min Sook Lee’s 2003 National Film Board of Canada movie. El Contrato looks in detail at the lives of two migrant workers: father-of-four Teodoro Bello Martinez and “M” who wears a mask in the movie to disguise his  identity.

At the time the film was made, Mexican farm workers worked “seven days a week, ten hours a day for a flat rate of $7.25 per hour, no overtime, no holidays”. A quarter of their salary is deducted for taxes, employment insurance, board and transportation, but anyone who gets sick or challenges their employer is sent back to Mexico. In the words of one of the workers in the film, “Slavery has not disappeared.” This hard-hitting film (dialogue in Spanish, with English commentary and subtitles) is a very valuable starting point for discussions about globalization, migration and many other aspects of geography.

Since the movie, several things have changed. The Mexican consulate in Leamington was opened in 2005,  in response to the inability of the Mexican consulate in Toronto to keep up with the need to provide consular services to migrant workers in Leamington. The migrant workers are also now supported by several migrant agricultural support centers, including one in Leamington established by Canada’s United Food and Commercial Workers Union.

Happy Christmas from Geo-Mexico! Mexico City sets up world’s largest nativity scene…

 Other  Comments Off on Happy Christmas from Geo-Mexico! Mexico City sets up world’s largest nativity scene…
Dec 232011
 

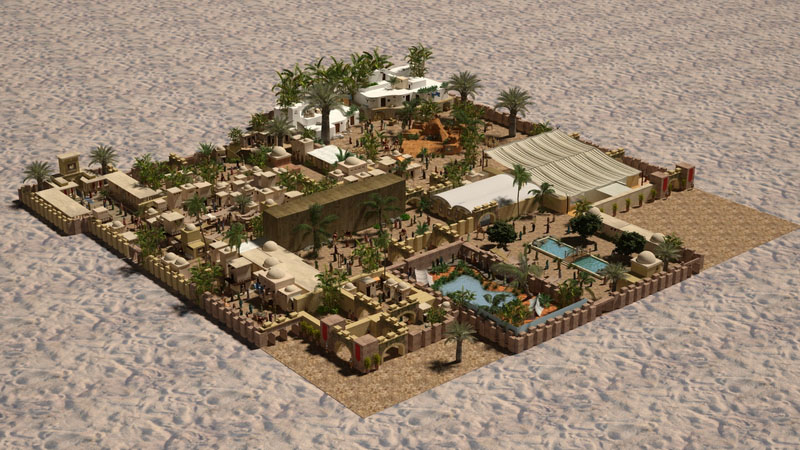
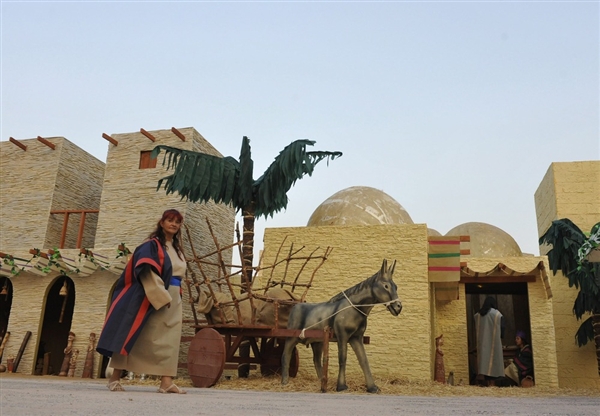
Mexico City authorities have set up largest nativity scene in the world as part of their Christmas festivities. The nativity scene, which cost two million dollars to create, was opened by Mayor Marcelo Ebrard in early December and is located in the parking lot of the city’s giant Estadio Azteca (Aztec stadium).

The nativity scene covers 20,000 square meters (215,000 sq. ft.) and has 5,000 figures and 700 tons of infrastructure. It incorporates 57 smaller scenes that recall the biblical passages related to the birth of Jesus in Bethlehem more than 2,000 years ago.

The world's largest Nativity Scene

It took a team of architects, engineers, designers and historians, among others, 70 days to create the displays. Many of the pieces and figures, including camels, donkeys, elephants, the Three Kings, an angel and some of the residents of Bethlehem, were crafted by Mexican artisans.

According to the Mexico City government, the scene has set two Guinness world records, one for the largest nativity scene in the world and another for having the greatest number of figures for a scene of this type.

Organizers expect more than one million people will view the scene before it is dismantled in mid-January.

The world's largest Nativity Scene. Credit: Mario Guzman / EPA

The world's largest Nativity Scene. Credit: Mario Guzman / EPA

Related posts:


What factors influence the decision about how to send remittances home?

 Other  Comments Off on What factors influence the decision about how to send remittances home?
Dec 122011
 

In an earlier post –International financial flows: how do Mexican migrants send remittances back home?– we looked at some of the ways used by Mexican migrants to send remittance payments back to their families and friends in Mexico. The World Bank study headed by Raúl Hernández-Coss (2005) breaks down the discussion about how remittance payments are made into three distinct stages (see diagram):

1. First Mile – how the sender of a remittance payment decides where and how to initiate the transfer.
2. Transfer (intermediary stage) – several financial systems combine to transfer funds.
3. Last Mile – how the recipient gains access to the funds that have been sent.

Summary of remittance flows. Source: World Bank report (details in text)

Summary of remittance flows. Source: World Bank report (details in text)

This post looks at the “First Mile“.

What factors influence the choices made by the sender of the remittances?

The World Bank researchers conclude that several factors are important considerations for the senders of remittances.

  • the ease of access to formal channels. Is there a bank or credit union close to where they live or work?
  • their level of financial awareness. Many migrants have limited experience of international financial transactions. Many do not have bank accounts.
  • the perceived reliability of the service. Many Mexican do not trust banks.
  • familiarity with the company providing the service. This is strongly influenced by “cultural” familiarity. Sending a wire transfer from a US branch of a Mexican supermarket chain, for example, might be preferred over a US bank with an unfamiliar name.
  • the desire for anonymity. Using formal channels requires photo-identification. Some migrants prefer informal channels for this reason alone.
  • their knowledge of “the Final Mile”. If they are sending funds to a remote village, far from a bank, they may opt to rely on a friend or relative carrying cash on their behalf back to their families, rather than involve their family in a lengthy and potentially costly trip to the nearest bank. This factor is becoming less of an issue. In recent years, formal banking channels have extended into many (though not yet all) small towns in the migrants’ home states in Mexico, offering recipients of remittances easier access to funds sent through formal channels.
  • the costs (see below) of the alternative transfer methods available
  • their legal status. For formal transfers, some form of photo-identification is normally required. Undocumented migrants do not normally have this option. (but see below)

Two recent trends are worth examining in more detail:

1. The declining cost of making a remittance transfer

Remittance senders have to take into account the relative expenses associated with competing transfer options. The average cost of making transfers has dropped dramatically in recent years. The sharpest falls came about a decade ago. For example, the average fee fell from $26.12 in 1999 to $12.84 in 2003, a drop of more than 50%.

Why has this happened?

  • The Mexican government has policies that encourage lower fees at the recipient’s end of the transfer.
  • Increased competition among private sector companies for a share of the international transfer market has forced prices down.
  • Improved technologies have made transfers faster (close to instantaneous), and lowered administrative costs associated with transfers [think automatic computerized systems instead of paper-pushing clerks!]

Lower prices have made it less attractive to use unregulated informal methods. In many cases informal methods are now significantly more expensive than most of the options involving a formal bank-to-bank transfer.

2. High-security consular certificates

In order to make it easier for undocumented workers to send funds back home safely, the Mexican government issues an official identity document through its consulates in the USA.

Mexican consulates began issuing these certificates as long ago as 1871! The certificates are now called the Matrícula Consular de Alta Seguridad (MCAS).  The Mexican government negotiated for their acceptance by US authorities, including homeland security.

The current high-security version of the MCAS, recognized by international law, is accepted in more than 30 states, 400 cities, 1,000 police agencies and 280 banking institutions, including Wells Fargo, Bank of America, US Bank, Citibank and HSBC. It has allowed many Mexicans to access, for the first time, formal channels for sending remittances back home.

There are four basic requirements to get an MCAS:

  • Proof of nationality (eg Mexican birth certificate, passport, or formal declaration of Mexican nationality)
  • Proof of identity (any official ID card issued in Mexico or elsewhere, including any passport, drivers licenses, voter card, official school records, etc)
  • Proof of residency (a utility bill or official correspondence with that address)
  • Payment of a processing fee of $26.

Related posts:

The rapid expansion of electricity provision in Mexico

 Other  Comments Off on The rapid expansion of electricity provision in Mexico
Dec 092011
 

In the past two decades, Mexico has made very impressive progress in providing electricity to its citizens, especially those living in rural areas. The 87.5% of Mexicans that had electricity in 1990 lived mostly in cities and towns. Many of the 95.0% that had electricity in 2000 lived in rural areas. The proportion without electricity was cut way down to only 1.8% by 2010.

During the past decade, virtually all those who obtained electricity for the first time lived in rural areas. The gains in some states were very impressive. The proportion without electricity in Oaxaca went from 13% in 2000 to 5% in 2010. In San Luis Potosí and Chiapas it fell from 12% to only 4%. In Veracruz it dropped from 11% to just 3% and in Tabasco it went from 5.8% to only 1.2%.

Postage stamp commemorating the nationalization of Mexico's electricity industry

The states with the highest proportion without electricity in 2010 were Oaxaca (4.93%), Guerrero (4.38%) and Durango (4.19%). At the other end, were the Federal District (0.08%), Nuevo León (0.30%), Coahuila (0.54%) and Colima (0.59%).

Mexico may never be able to provide electricity to 100% of its citizens, since there are too many people living in very remote areas. In about 8% of municipalities (199 of 2456), more than 10% of the people lack electricity. Of these 199 municipalities, 81 are in Oaxaca, which has 570 municipalities, far more than any other state. Many of the other poorly serviced municipalities are in the relatively poor southern states of Guerrero (15), Veracruz (12), Chiapas (9), Puebla (7) and Michoacán (7).

A surprisingly number of these 199 municipalities are in two northern states: Chihuahua with 16 and Durango with 9. In fact, in 14 Chihuahua municipalities, over 25% of the population lack electricity and in 5 of these over 50% do not have electricity. In Durango the situation is only slightly better: in four municipalities over 25% lack electricity and in one of these 66% do not have electricity. These are among the worst-serviced communities in all of Mexico. In the whole country there are only 9 municipalities where over half the residents do not have electricity and 6 of these 9 are in Chihuahua or Durango. These very poorly-serviced areas are sparsely populated municipalities near the Copper Canyon, occupied mostly by the Tarahumara indigenous group.

Though there are sizable pockets of Mexicans that do have electricity, it is very impressive that, as of 2010, over 98% had access to power.

Source for data:

 CONAPO,Índice de marginación por entidad federativa y municipio. 2010” México D.F., October 2011.

 Related posts:

The important but often overlooked state of Puebla

 Other  Comments Off on The important but often overlooked state of Puebla
Dec 022011
 

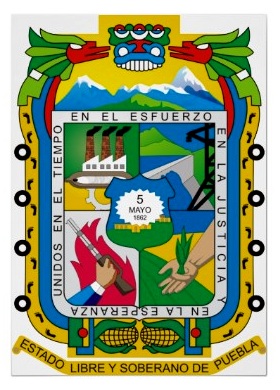
The interesting and important state of Puebla is often overlooked because it is overshadowed by nearby Mexico City. In fact the western state border of Puebla is within 35 kilometers of the eastern edge of the Federal District. The state of Puebla also may be overlooked because it is rather small in area, ranking only 21st among Mexico’s 32 states. On the other hand, its 2010 population of nearly 5.8 million ranks it 5th behind only Mexico State, the Mexico City Federal District, Veracruz and Jalisco.

Though small in size, Puebla is very diverse. The topography is rugged and elevations range from under 100 meters in the northeast to volcanoes  rising over 5,000 meters above sea level, both to the east (Orizaba – 5,636m) and west (Popocatepetl – 5,410m and Iztaccihuatl – 5,230m). These extremes in elevation give Puebla a very wide range of climates and ecosystems, from semi-tropical rainforests and grasslands to highland forests and alpine ice packs.

Almost inevitably, given its high population density (168.5 inhabitants/square kilometer), many of these ecosystems have been degraded. Several of the most attractive natural areas are now protected. They include the Izta-Popo Zoquiapán, La Malinche and Pico de Orizaba National Parks as well as the very large Tehuacán-Cuicatlán Biosphere Reserve, which has over 100 different mammal species, 16 of which exist nowhere else on the planet.

Puebla also has significant social and ethnic diversity. There are numerous wealthy people and upscale areas in Puebla City, which has the eighth highest 2005 Human Development Index (HDI) score among major Mexican cities, behind only Mexico City, Chihuahua City, Monterrey, Querétaro City, Cancún, Torreón and Cuernavaca. Most people are surprised it comes out ahead of Guadalajara and Zapopan.

On the other hand, the state as a whole is rather poor. Based on its relatively poor levels of infant mortality, literacy, school enrollment, and income levels, the state ranks 28th of 32 states in terms of 2008 Human Development Index. Puebla is tied with Michoacán and ahead of only Chiapas, Guerrero and Oaxaca[1]. It also ranks 28th in illiteracy which is over 10% (2010); however 96% of the 6 to 11-year-olds now attend school, and illiteracy for those between the ages of 15 and 25 is less than 3%. While 98% of homes now have electricity, over half of Puebla’s workers make less than $115 pesos ($8.20US) a day. Approximately two/thirds of the state’s population live below the Mexican poverty line. The state’s high level of poverty is partially due to its indigenous population of almost one million and the fact that almost 30% of its inhabitants live in rural areas, some of them quite remote.

The city of Puebla is the heart of a Metropolitan Area which extends across state lines to the city of Tlaxcala. Metropolitan Puebla-Tlaxcala is the country’s 4th largest urban area with a population over 3.1 million, but is overshadowed by Mexico City, the eastern edge of which is less than 30 minutes by expressway. In fact, some urban specialists suggest that these two major metropolitan areas may merge in the future. On the other hand, the mighty Popocatepetl and Iztaccihuatl volcanoes, both over 5,000 meters in height, lie directly between the two cities. The high speed expressway skirts around the north side of the volcanoes.

The city of Puebla has long had strategic significance. The city was initially established during the colonial period owing to its strategic location between Mexico City and Veracruz, the dominant port for shipments to and from Spain. Puebla was the country’s second largest city for more than three centuries up until the mid 19th century. The Mexico City-Puebla railway was completed in 1869, but the main line to Veracruz bypassed the city, which diminished its comparative advantage, and resulted in it dropping to fourth place, overtaken by Guadalajara and Monterrey.

The state’s historical importance is evidenced by numerous important military confrontations, including the massacre of Cholula (1519), Santa Ana’s siege of Puebla City (1845), American General Winfield Scott’s occupation (1845-48), the “Cinco de Mayo” battle of Puebla against the French (1862), the French victory in the Second Battle of Puebla (1863), and occupation by the Zapatistas during the Mexican Revolution. The state is the birthplace of four Mexican Presidents: Ignacio Comonfort (1855–1858), Juan N. Méndez (1876–1877), Manuel Ávila Camacho (1940–1946) and Gustavo Díaz Ordaz (1964–1970).

Despite the state’s relative poverty, industrial development has been significant and Puebla has become one of Mexico’s most industrialized states. Since colonial times Puebla has been an important center for the textile and ceramic industries. Much of Mexico’s famous talavera pottery is made in Puebla. Talavera came to Puebla from Talavera, Spain, which in turn had acquired it from Arab traders who originally brought it from China.

Since the mid 20th century Puebla has become a very important modern industrial area. The most important manufacturing activities are metals, chemicals, electronics, textiles and particularly motor vehicles. The Volkswagen plant in Puebla is one of the largest outside Germany. In July 2003 it produced the very last of the over 21 million old “Beetles” built by VW. The plant now produces New Beetles, Jettas and Boras that are exported worldwide. The motor vehicle assembly industry is supported by scores of automobile parts factories in the state.

Related articles:

Where are the wealthiest households in Mexico?

 Other  Comments Off on Where are the wealthiest households in Mexico?
Nov 102011
 

A recent publication from the public opinion research consultancy Mitofsky offers some insights into the distribution of different socio-economic groups within Mexico.

The Mitofsky study relies on the AMAI 10×6 system to tabulate the percentage of households in each state that fall into six distinct categories: A/B, C+, C, D+, D and E.

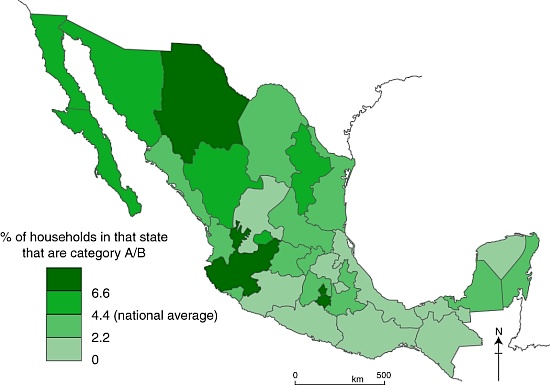
Across Mexico as a whole, 4.4% of households are categorized as A/B (the highest category, see map below), 12.3% as C+, 17.9% as C, 39.1% as D+, 21.6% as D and 4.7% as E (the lowest category).

The data show that, between them, four states–the Federal District (23.4% of all A/B households in Mexico), Jalisco (14.4%), State of México (9.3%) and Nuevo León (5.9%)– account for more than half of all the homes in this category in Mexico

The map shows how the incidence of A/B households (the highest socio-economic category) vary, state by state, across the country.

Distribution of highest socio-economic status households in Mexico.
Households in the highest socio-economic group in Mexico. (Geo-Mexico/Tony Burton; all rights reserved)

Do you live in an A/B household?

1. Housing characteristics:
– average of 6-8 rooms (often 3 bedrooms, 3 bathrooms) built of brick and/or concrete
– floors tiled, hardwood or stone; more likely to have carpets or rugs than lower categories
– most are owner-occupied, not rented

2. Sanitary Infrastructure
– connected to municipal potable water and sewer systems
– all have tub, shower, and water heater (usually using gas)
– two-thirds of these homes have water cisterns and pump to supply water tanks.
– some have air conditioning and/or central heating

3. Practical Infrastructure
– average 2 vehicles
– all have stoves, refrigerators and washing machines
– almost all have microwave ovens, blenders, toasters, coffee-makers and juice extractors

4. Communications and Entertainment Infrastructure
– almost all have fixed line telephones and cell phones
– most have 3 or 4 TVs and  satellite or cable TV
– all have DVDs and stereos/CD players; half have video game consoles
– average more than 1 computers per household; 75% connected to Internet
– many have memberships of private sports clubs and own a second home or time-share.
– more than 50% have traveled by air at least once in last 6 months, and most travel overseas at least once a year

5. Educational and Occupational Profile of Head of Family
– usually has a bachelor’s degree or higher
– work in medium or large companies, as directors, CEOs or other high-ranking professionals

6. Expenditures
– these households save more, but also spend more on education, entertainment, communication and vehicles
– food purchases account for only 7% of total expenditures, well below the average for the total population
– of these food purchases, the proportion spent on dairy products, fruit, and drinks is greater than lower categories

Questions worth thinking about:

  • How does this map compare to other maps on Geo-Mexico of inequalities across the country? (Use the site search feature or tags from the tag cloud on the left hand side of each page to find other inequality maps)
  • To what extent does this map confirm that north-south divide described in several previous posts?

Source:

Niveles socioeconómicos por entidad federativa 2009 – 2010 by Roy Campos and Ana María Hernández; CONSULTA MITOFSKY, December 2010.

Related Posts:

Mexico Pan-American Highway, route of one of the toughest road races in the world

 Other  Comments Off on Mexico Pan-American Highway, route of one of the toughest road races in the world
Nov 022011
 

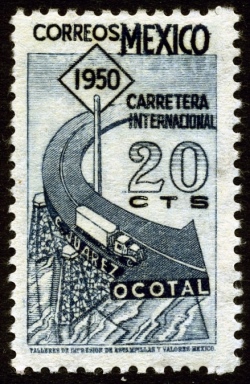
The completion of the Mexican stretch of the Pan-American Highway, from the US border to Guatemala, in the late 1940s was a significant turning-point in the development of Mexico’s road network. The highway made previously remote areas more accessible, but, far more than that, it served as a symbol of unity and Mexico’s progress into the modern era. Only a few years later, the total length of federal highways exceeded the total combined length of the country’s railway lines. As highway transport of freight and passengers took over, rail transport never fully recovered.

To celebrate the opening of the Pan-American Highway, in 1950 a major road race was organized: the Pan-American Race (Carrera Panamericana). The race was held annually until 1954, after which authorities claimed that it had achieved the desired publicity. Actually, the race had achieved considerable undesired publicity as one of the world’s most dangerous road races, 27 people having lost their lives in five years the race was held.

The race was revived, but as a modern, shorter version arranged as a stage rally for vintage cars, in 1988. The 2011 race has just finished.

7 days, 100 cars, 3,000 km, one crazy race (Globe and Mail)

Racers in the early 1950s achieved some astounding average speeds, up to 135 mph for an entire stage. The following extract from a contemporary news report tells the story:

“The 3114 km Mexican road that stretches south to north from Tuxla to Juárez is, according to Alfred Neubauer [a legendary Mercedes-Benz Competition director], a combination of Tripoli’s Grand Prix, the Italian Mille Miglia, the German Nurburgring, and the Le Mans 24 hrs….

The race begins in a tropical climate where the temperature is high and humid and continues along a road that goes from sea level to a suffocating 3000 meter altitude! Temperature variations go from 34 Celcius to almost 2 degrees above freezing in just 72 hours… Carburetors and spark plug selection need alterations every 160 km approximately. Motors that ran miraculously at 1000 mts sounded almost dead at 3000….

The road is paved with a mixture of volcanic ash and this highly abrasive substance will turn a perfectly new passenger car tire to a worn-out one in a 1000 km distance.”

The current road network in Mexico is extensive, covering virtually all areas of the country. Mexico has over 120,000 km of paved roads, far more than any other country in Latin America. By contrast, Brazil has about 96,000 km. There are over 10,000 km of controlled access toll expressways (even if they are among the most expensive in the world!). There are an additional 10,000 km of free four lane highways. Mexico also has over 200,000 km of unpaved roads.

Want to read more?

Veracruz: one of Mexico’s most diverse states

 Other  Comments Off on Veracruz: one of Mexico’s most diverse states
Oct 242011
 

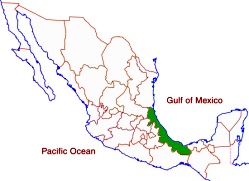
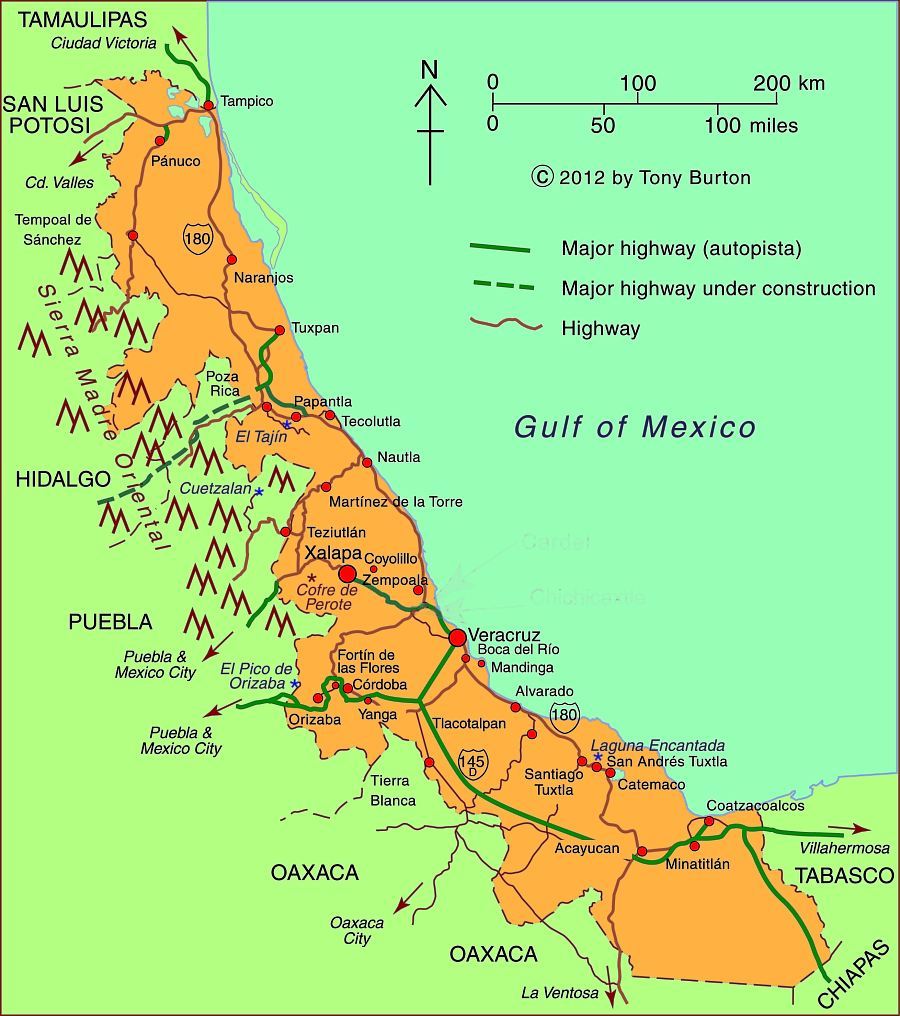
Veracruz, one of Mexico’s most important and interesting states, is a narrow strip of land stretching for 650 kilometers (over 400 miles) along the Gulf of Mexico. The topography ranges from a narrow coastal plain to very high mountains on its western border including Mt. Orizaba, Mexico’s highest peak at 5,610 meters (18,406 ft.).

The relief helps to funnel migrating birds into a narrow band across the state:

Veracruz which is one of the rainiest states has three of Mexico’s five largest rivers: the Panuco in the north and the Papaloapan and Coatzacoalcos rivers in the south. Its varied climate and ecosystems mean enormous biodiversity, including species of insects, birds and plants that exist nowhere else on earth. These species are protected in 31 protected areas including three national parks. Previous posts describe the fabulously beautiful Las Tuxtlas Biosphere Reserve and the mysterious Laguna Encantada.

With over 7.6 million residents, Veracruz trails only the State of Mexico and the Federal District in population. While the state is over one-third rural, it has several major metropolitan areas. The state capital is Xalapa (809,000). Other major cities include the industrial twin cities of Coatzacoalcos (234,000) and Minatitlán (356,000) in the extreme south, and the port city of Veracruz (703,000) in the center. The north of the state is served by the port city of Tampico (803,000) on the north bank of the Panuco River in the neighboring state of Tamaulipas.

One of the most interesting towns is Yanga, which was established around 1570 by escaped slaves lead by Gaspar Yanga. The town, the first African-ruled settlement in the New World, successfully resisted efforts by the colonial government to recapture it and its residents. Today, Gaspar Yanga is considered a national hero. It is interesting to note that Negroid features are apparent on the ancient 3,500 year old Olmec carved stone heads found in southern Veracruz. The state is home to numerous indigenous groups including the Nahuas, Huastecos, Otomis, Totonacs.

Map of Veracruz state, Mexico; all rights reserved.

Map of Veracruz state, Mexico; all rights reserved. Click to enlarge.

There are two UNESCO-designated World Heritage sites in Veracruz: the Pre-Hispanic city of El Tajin and the Historic Monuments of the Zone of Tlacotalpan.

Veracruz is one of Mexico’s poorer states. Mostly as a result of its very large rural, agricultural and indigenous populations, Veracruz ranks in the bottom third in most socioeconomic indicators such as production/person, percent living below the poverty level, human development index, literacy, infant mortality, life expectancy and marginalization. On the other hand, these indicators for the major cities are above the national averages.

Veracruz is second in total agricultural production behind only Jalisco. It produces more than half of the country’s sugar cane and oranges and also leads in mangoes and other citrus fruits. It is also a major producer of coffee, beef, pork, dairy, chicken, corn, beans, bananas, tobacco, coconuts, vegetables and vanilla.

Petroleum is extremely important. Most of the oil production is in northern Veracruz while the southern cities of Coatzacoalcos and Minatitlán are noted for their chemical and petrochemical industries.

Veracruz is also famous historically and culturally. Cortés and his men landed in Veracruz on their way to conquering and subduing all of Mexico. Veracruz city was the most important port for many centuries when it served as Mexico’s main link to the rest of the world. The state capital was eventually moved to Xalapa, which has a flourishing cultural life and an anthropology museum second only to the National Anthropology Museum in Mexico City. The annual Carnival staged in Veracruz is one of the most spectacular in all of Mexico. The Danza de los Voladores (Dance of the Flyers) in Papantla is a major tourist attraction for Mexicans and foreigners alike. Veracruz also has its own distinctive music and cuisine, enhancing its regional identity.

The diffusion of the Africanized honey bee in North America: a bio-geographical case study

 Other  Comments Off on The diffusion of the Africanized honey bee in North America: a bio-geographical case study
Oct 082011
 

Africanized honey bees, sometimes popularly called “killer” bees, resulted from the crossing (hybridization) of European honey bees and African honey bees. They combine the best and the worst of both sets of relatives. Africanized honey bees are slightly smaller than European honey bees, but more aggressive and less inclined to remain in one place. They can swarm and attack even if unprovoked, even though they can sting only once before dying shortly afterward.

Their “killer bee” label is because they have killed 1,000 people in the Americas since their ancestors escaped from a laboratory in Brazil. Africanized bees react ten times faster to disturbances than European bees and can pursue a hapless human victim for 300-400 meters.

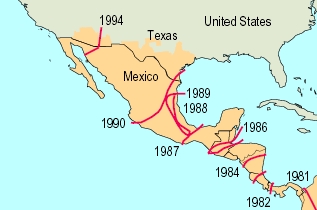
The mixing of genes that created Africanized honey bees occurred in the 1950s. In 1956, Dr. Warwick Kerr, a bee researcher in Brazil, hoped to develop a bee that would thrive in Brazil’s tropical climate. He decided to cross European bees with African bees. Unfortunately, in March of the following year, some of his experimental bees escaped into the wild. The Africanized bees soon began to multiply and expand their range. They proved to be very adaptable, and have since spread, at a rate of up to 350 km/year through most of South and Central America, as well as into Mexico and the USA. They arrived in Peru by 1985 and Panama by 1982. Their spread northwards continued, and they crossed from Guatemala into Mexico, near Tapachula, in October 1986.

The map shows the gradual northward spread of Africanized bees in Mexico. Up to 1987, the progression looks fairly regular, but in the following year, Africanized bees’ northward movement was restricted to a zone along Mexico’s Gulf Coast. This remained true even through 1989. By 1990, the “front” of the bees advance once again stretched right across the country.

Q. What factors may have caused the unusual (anomalous) geographic spread of Africanized bees in 1988 and 1989?
Map of africanized bees spread across Mexico

Africanized bees spread across Mexico (adapted from Kunzmann et al)

Why are Africanized bees more migratory than European bees?

Scientists believe that Africanized bees are uniquely equipped to cope with the unpredictability of suitable food sources in the tropics. They are more opportunistic, changing their foraging habits to suit local conditions, including short-term supplies of pollen, which they will collect and store to ensure their survival. When a new resource presents itself, Africanized bees will swarm rapidly to maximize their use of the new pollen source.

In bio-geographical terms, Africanized bees are an example of an opportunistic or r-species, perfectly equipped to move to new or changing habitats. They reproduce rapidly, and use available resources efficiently. This makes them far less stable than European bees which thrive in a more predictable environment and adapt to changing circumstances far less quickly.

Africanized bees can survive on limited food supplies, will explore and move to new locations frequently and are aggressive in defending their resources. When they come into contact with other less aggressive bees, such as Mexico’s native bees, Africanized bees may out-compete them for pollen and eventually replace them as that area’s dominant bees.

In Mexico, the speed of diffusion of Africanized bees slowed down

When Africanized bees were reported from southern Mexico, US beekeepers began to fret. The US honey industry is worth 150 million dollars a year. Fear spread that Africanized bees might jeopardize the entire industry, mainly because they are prone to migrate, and would be hard to control.

US experts helped finance a joint program in Mexico which aimed to slow down the bees’ progress northwards. The original idea was to stop bees from crossing the narrowest part of Mexico, the Isthmus of Tehuantepec, preventing them from reaching central Mexico. However, by the time funding was approved, some bees had already crossed the Isthmus. The focus of the bee-control plan was changed to trying to slow down their seemingly inexorable progress north. Even if scientists could only delay the bees’ progress, it would give US farmers more time to plan for their eventual arrival.

The plan was relatively simple. Hang sufficient bee traps in trees throughout the region to attract wild swarms while banning Mexican beekeepers from moving any hives from southern Mexico into central or northern Mexico. Thousands of distinctive blue boxes appeared in orchards and forests across a broad belt of Mexico, from the Pacific to the Gulf.

The combined Mexico-US program is credited with having slowed the bees’ entry into the USA down by about two years. Even so, by 1990, Africanized bees were spotted in Texas; they reached Arizona by 1993 and California by 1995. By this time, they were also found throughout Mexico.

In a later post, we will look at honey production in Mexico and see whether or not it was permanently affected by the influx of Africanized bees.

Sources:

(a) “Africanized Bees in North America” by Michael R. Kunzmann et al, in Non-native Species by Hiram W. Li (biology.usgs.gov)

(b) Introduced Species Summary Project: Africanized Honey Bee by Christina Ojar, 2002.

(c) Alejandro Martínez Velasco. Las andanzas de la Abeja Africana Informador (Guadalajara daily), 1 September 1991.
Oct 062011
 

The small town of Tequila, the center of production of Mexico’s national drink, lies in the shadow of an imposing 2700-meter (8860-ft) volcano. Most visitors to the town visit the National Tequila Museum, take a distillery tour, and then sample one or two of the many world-famous brands of tequila made in the area.

The spine of Tequila Volcano

The spine of Tequila Volcano. Drawing by Mark Eager (Western Mexico, A Traveler’s Treasury); all rights reserved.

Tequila Volcano, which overlooks the rolling fields of blue agaves required to make the liquor, is the home of one of Mexico’s most distinctive geomorphosites. From the rim of its crater, the most arresting thing about the view is not the green, tree-covered crater itself but the giant monolith with almost vertical sides rising perpendicularly from the middle of the crater floor.

This well-preserved central spine, known locally as la tetilla (“the nipple”) is quite unusual. It represents the hardened lava which cooled in the central vent of the volcano and which, solid and unyielding, was later pushed upwards by tremendous subterranean pressure.

Few such good examples exist anywhere in the world. The example most often quoted in geography texts is the spine that was pushed up by Mont Pelée on the island of Martinique in the West Indies in October 1902, immediately prior to that volcano’s disastrous eruption which cost 32,000 lives.

How to get there

A cobblestone road begins near the railway station in the town of Tequila and winds up Tequila Volcano towards the short-wave communications tower on its rim. It is about 20 kilometers from the town to the rim. The hike or drive up to the rim affords glorious views over the surrounding countryside. As you gain altitude, so the vegetation changes, becoming luxuriant pine-oak forest well before you reach the rim. Looking across the crater, on a day when clouds slowly drift across and partially obscure the view, is like watching a silent movie of ancient Chinese landscape drawings.

Want to read more?

For a fuller description of a visit to Tequila Volcano and a climb up the volcanic spine, see John and Susy Pint’s Outdoors in Western Mexico (2nd edition 2011).

For a description of Tequila Volcano and the varied villages and sights in its vicinity, see chapters 9 and 10 of my “Western Mexico: A Traveler’s Treasury” (Sombrero Books, 2013), also available in a Kindle edition.

Oct 042011
 

Santa Rosalía in Baja California Sur is one of my favorite places on the Baja California Peninsula. Geography and economics have conspired to change its fortunes more than most towns in the course of history. Originally founded in 1705, the town failed to prosper as its populace faced repeated epidemics, and its farmland was subject to a disastrous flood. The town was largely abandoned by 1828.

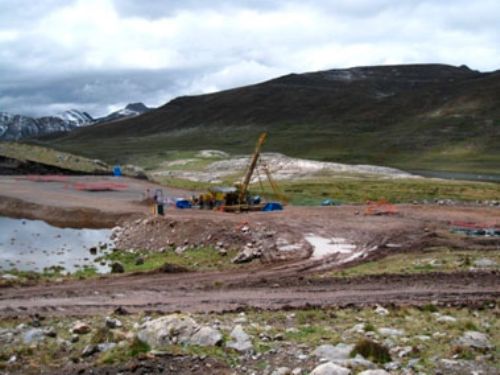
A chance find of copper-bearing ore in the middle of the century reversed Santa Rosalía’s fate, and in 1885, a new lease of life was provided when the El Boleo mining company, backed by French capital, was granted a 99-year concession by President Díaz to begin mining for copper in exchange for building all the necessary infrastructure: port, town, mines, railway and foundry. It was judicious timing given that the world market for copper was taking off at precisely that time due to the rising demand for the metal from the fledgling electric companies in Europe and the USA.

Boleo Mine, Santa Rosalía

El Boleo Mine, Santa Rosalía

Within a decade, the mining company had become responsible for more than 80% of Mexico’s exports of copper ingots. The local ore was rich, with up to 25% copper in some samples. Workers flocked in from far afield, including three thousand from China. Working conditions were atrocious, little better than slavery. The health conditions for the miners and foundry workers were appalling;.for example, 1400 deaths were recorded between 1901 and 1903. The company decided on an unusual solution. Rather than move the workers’ homes, it decided to move the smelter chimney. The new chimney was built a kilometer out of town, connected to the smelter by a large, ground-hugging flue. The flue can still be seen today, climbing the hillside immediately behind the Hotel Francés.

By 1900, Santa Rosalía had become a major world copper producer. The smelter relied on supplies of coking coal from Europe, principally from South Wales and Germany. The ships took from 120 to 200 days to reach Santa Rosalía from their home ports. Square-rigged vessels, flying the British or German flag, were constantly arriving in the harbor. When the First World War broke out, several German ships were unable to return to Europe and spent the next few years anchored offshore. The sailors were shocked when they heard that Germany had lost the war; their vessels were eventually distributed among the victors.

The copper deposits were eventually exhausted. The El Boleo mining company closed in 1954, but the state-run Compañía Minera Santa Rosalía continued to mine until 1985, when the smelter was finally shut down, on the eve of the town’s 100th anniversary.

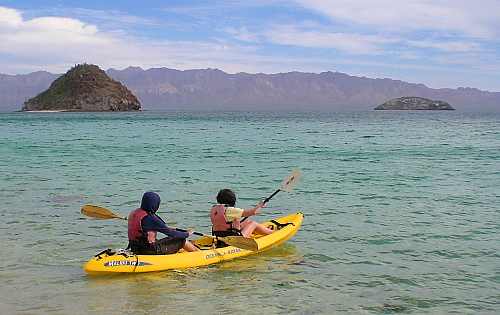
The collapse of the copper mining industry may have caused Santa Rosalía to slip back temporarily into a somnolent slump, but it is now recovering. The mining boom of a hundred and twenty years ago has been replaced by a boom in nature and adventure tourism, which take advantage of the town’s proximity to Conception Bay and the islands in the Sea of Cortés. As we shall see in a future post, because Santa Rosalía has preserved much of its past, it has a massive advantage over its competitors in the region, in that its initial revival fueled by ecotourism can be amplified by cultural or heritage tourism. This beautiful old town and its inhabitants have plenty of reasons to be optimistic as they face up to the challenges of the twenty-first century.

Paddling to an ecotourist future... Photo: Tony Burton

Paddling to an ecotourist future…

And now, the town has another reason for optimism. The massive El Boleo copper cobalt zinc-manganese deposit, which fueled the town’s first boom period, is now being re-developed with new technology. Baja Mining, based in Canada, owns 70% of El Boleo; a consortium of Korean companies owns the remaining 30%. The 1.2-billion-dollar, open-cast mine will add 3,800 jobs to the local economy. During its anticipated 23-year life span, El Boleo is expected to yield more than 2,000 metric tons of cobalt, 25,000 tons of zinc sulfate and 50,000 tons of copper annually.

Sources:

Want to read more?

Oct 032011
 

The word “Bimbo” in common English usage refers to an inept person, an airhead or a “cheap” flirtatious “dumb blond”. In Spanish, “Bimbo” has no particular meaning, but is the name of Mexico’s predominant bread baker, a massive multinational company. It is so well-known that in many parts of Latin America, packaged, sliced white bread is often referred to simply as “pan bimbo”.

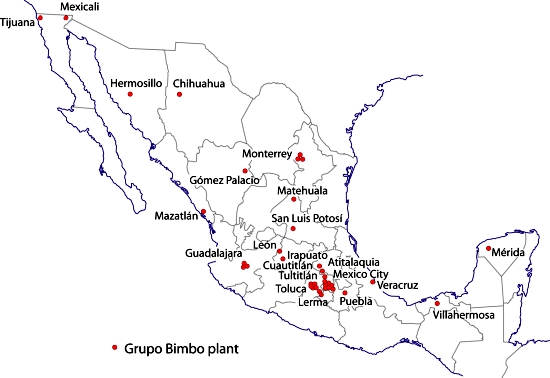
Grupo Bimbo is the world’s largest bread baker and fourth largest food company on the planet behind only Nestle, Kraft and Unilever. The firm has a presence in 17 countries, supplying consumers with more than 150 brands, via a network of 42 plants in Mexico (see map), 25 elsewhere in Latin America, 34 in the USA and 2 in China. It is currently the only bread company that has a national footprint throughout the USA.

bimbo-logoWhile most people may not be familiar with Grupo Bimbo as a corporation, virtually everyone in the Americas at one time or another has consumed Bimbo products. The company makes over 7,000 different products using various brand names, including Sara Lee; Thomas’ English Muffins; Entenmann’s pastries; Arnold’s, Orowheat, Mrs. Baird’s, Wonder (in Mexico only); Freihofer’s; Stroehmann’s; Brownberry; Old Country; Milpa Real and Tia Rosa (tortillas and related products); Barcel (chips and salted snacks; Marinela (sweet snacks); Boboli (pizza crusts); Coronado (cajeta) and El Globo fancy pastry and coffee shops.

How did Grupo Bimbo get to be so big?

Grupo Bimbo was established in Mexico City in 1945, and has grown mainly through acquisitions. In 2008 it paid $2.4 billion for the US food operations of George Weston Foods Ltd of Canada. In 2010 it bought Sara Lee’s fresh bakery division for about a billion dollars. These acquisitions enabled Bimbo to double its total revenues in the last decade to almost $10 billion.

Grupo Bimbo plants, 2011

Grupo Bimbo plants, 2011

Grupo Bimbo has a worldwide network of more than 41,000 distribution routes serving an astounding 1.8 million points of sale, varying from tiny corner stores in remote villages to major supermarkets in big cities.

Bimbo product with biodegradable packaging

Bimbo product with biodegradable packaging

In recent years, Grupo Bimbo has been busy boosting its green credentials via a series of environmental initiatives. These include a 90-megawatt wind park in Unión Hidalgo in the state of Oaxaca, which will generate almost 100% of the power Grupo Bimbo requires to run its plants in Mexico, and will be the largest wind park in the global food industry. It will diminish Grupo Bimbo’s environmental footprint and mean that almost half of Grupo Bimbo’s total global electricity consumption will come from renewable sources.

Grupo Bimbo is one of only ten Mexican companies that have earned the Socially Responsible Company Award from the Mexican Center for Philanthropy (CEMEFI) for ten years in a row. The company is involved in numerous environmentally and socially-responsible initiatives, including Reforestamos Mexico, an NGO committed to protecting Mexico’s forests and rainforests. This has worked with young people from 40 rural communities to help restore forests and raise awareness about the need for certified forestry products and forestry carbon certificates.

So, next time you go shopping, keep your eyes open for Grupo Bimbo brands and see how many Grupo Bimbo products you can recognize…

Mexico’s geomorphosites: The Piedras Bola (Stone Balls) of the Sierra de Ameca, Jalisco

 Other  Comments Off on Mexico’s geomorphosites: The Piedras Bola (Stone Balls) of the Sierra de Ameca, Jalisco
Sep 272011
 

The Sierra de Ameca is a range of hills a short distance west of Guadalajara. The area was important in colonial times for gold and silver mining. One of the mines is called Piedra Bola (Stone Ball). The landscape immediately around this mine is so distinctive and unusual that it featured on the cover of the August 1969 edition of National Geographic.

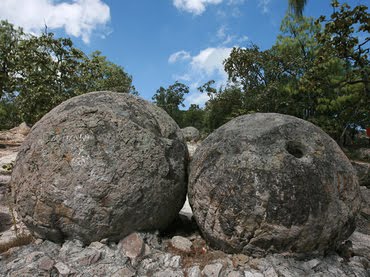
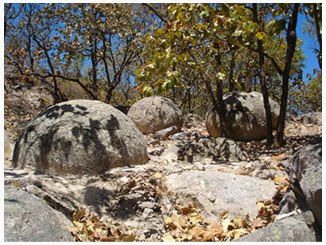
In the middle of the forest surrounding the Piedra Bola mine are about a hundred strange stone balls. They are almost perfectly spherical and range in diameter from about sixty centimeters to more than ten meters. These symmetrical boulders are unusually large. Nothing quite like them exists elsewhere in Mexico and few similar examples are known anywhere in the world.

Piedras Bola

Piedras Bola

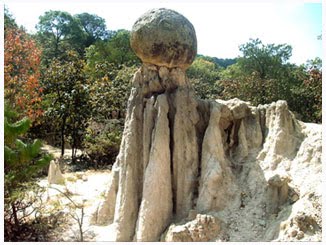
Some are buried, others partly or fully exposed. In some places, erosion of the surrounding rocks has left a sphere perched precariously atop narrow columns of softer rock, seemingly ready to topple in the next strong wind. These “hoodoos” or earth pillars have been formed as a result of water erosion and they may survive for centuries until the processes of sub-aerial weathering and erosion finally cause them to fall.

Piedra Bola atop an earth pillar

Piedra Bola atop an earth pillar

How were the Piedras Bola formed?

This summary of the most likely explanation of the origin of the stone spheres is based on that offered by Dr. Robert Smith of the U.S. Geological Survey in the original National Geographic article.

During the Tertiary geological era, 10-12 million years ago, a local volcano erupted, causing a deluge of glassy fragments of molten lava and ash, together with large quantities of volcanic gas trapped in the mixture. The mixture was very hot, probably between 550 and 800̊C. The deluge of material partially filled an existing valley, burying the former surface.

As the mixture cooled down, the existing glassy fragments formed nuclei around which much of the remainder of the material crystallized. Spherical balls began to form, their size depending on how long the crystallization process continued uninterrupted. The longer the time, the bigger the ball…. The most perfect balls were formed near the previous ground level, inside the hot mass of ashes, where the cooling would have occurred more evenly than in the bulk of the matrix material. The crystallized material is a kind of rhyolite which has an identical chemical composition to the fragments of glassy obsidian also found in the area.

The remainder of the ashes cooled down and became a consolidated accumulation of ashes and glassy fragments or tuff, without clearly defined spheres. This tuff is weaker, and has a lower density than the stone balls within it. During succeeding millenia, the combined processes of physical and chemical weathering weakened the surrounding tuff, and water (rain and rivulets) then eroded away this loose material, exposing some of the rhyolitic boulders completely and others partially.  As these processes continue, so more of the boulders will be exhumed from beneath their cover of tuff, and be revealed to us.

Protected?

The Jalisco State government has developed a small park around the Piedras Bola, including decent trails, some signposts and an amphitheater. There are even (reportedly) two ziplines, though I haven’t yet had the dubious pleasure of seeing them for myself. Increasing the number of visitors to  geomorphosites is not a bad idea, but some basic education and protection is needed if these and other geomorphological sites are going to be preserved intact for future generations. In the case of the Piedras Bola, graffiti now mar many of the exposed stone spheres and some of the spheres have been dynamited, apparently in the mistaken belief that the center of the sphere contained gold.

picture of piedras bolaHow to get there:

The entrance road to the Piedras Bola (formerly only a hiking trail) begins from km. 13 of the paved road that crosses the mountains from Ahualulco to Ameca. For anyone who does not have time for the hike, but still wants to see what these extraordinary stone spheres look like, the locals have thoughtfully rolled one down the mountain and onto Ahualulco’s main plaza.

Want to read more?

For more images and details, see John Pint’s article, Las Piedras Bola: the great stone balls of Ahualulco, on MexConnect, together with his outstanding gallery of photos.

The Ethos Foundation’s Multidimensional Poverty Index

 Other  Comments Off on The Ethos Foundation’s Multidimensional Poverty Index
Sep 202011
 

We looked in a previous post at the Multidimensional Poverty Index (MPI), originally presented in an Oxford Poverty & Human Development Initiative (OPHI) working paper, and explained its advantages over earlier poverty measures, especially the relatively crude single-factor approaches like “a dollar a day”.

Earlier this year (2011), the Ethos Foundation, a Mexican NGO, presented its own Ethos 2011 Multidimensional Poverty Index, using the expertise of the authors of the MPI as its starting point.

The Ethos Foundation believes that poverty is comprised of both household poverty, an inability to satisfy basic household needs, and by aspects of ambient poverty that make it impossible for people to achieve well-being given the existing political, social and economic conditions. As a result, their index gives a more “Latin American” perspective on poverty.

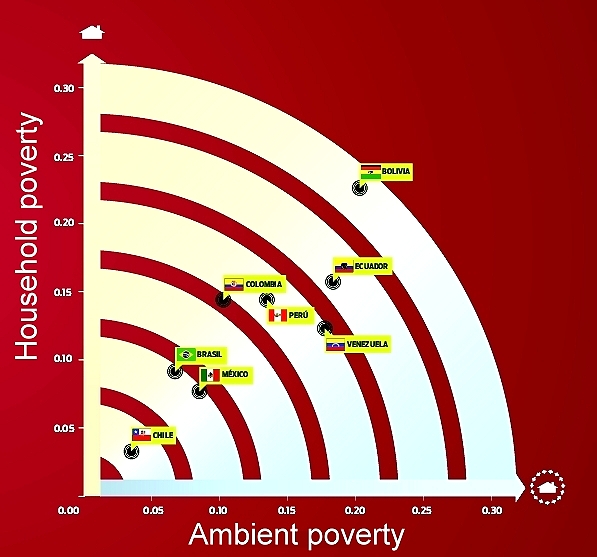
In applying its Multidimensional Poverty Index to an analysis of poverty in the eight largest economies in Latin America, the Ethos Foundation concluded that Chile is the country with the least poverty, followed by Brazil and Mexico.

Ethos Poverty Index applied to Latin America's largest economies. (Ethos Foundation, 2011)

The graph shows how the 8 countries rated, with the axes of the graph being household poverty and ambient poverty respectively. Overall, Brazil and Mexico are almost equal. While Brazil has less “ambient poverty” than Mexico, Mexico has less “household poverty”. Both countries have a long way to go to reduce poverty levels to match those in Chile.

What factors are included in the Ethos Foundation Poverty Index?

A. Household Poverty:

  1. Income per person (under $60 a day)
  2. Education (head of household uneducated? One child or more aged 7-15 not attending school?)
  3. Provision of drinking water and drainage
  4. Building materials (solid walls? three or more people sleeping in same room?)
  5. Cooking fuel used
  6. Availability of electricity

B. Ambient Poverty (21 variables in 7 categories, but not all equally weighted):

  1. Public Health (life expectancy, infant mortality, public health access)
  2. Institutions (government effectiveness; corruption; political stability)
  3. Economy (unemployment rate; competitiveness; access to micro-loans)
  4. Democracy (civil liberties; political rights and freedom)
  5. Public safety (homicide rate, vehicle theft rate, confidence in police)
  6. Gender (salary parity, educational parity, women in government)
  7. Environment (CO2 emissions/person; species in danger of extinction; rate of deforestation)

The Ethos 2011 Multidimensional Poverty Index is an interesting and valuable addition to the literature on poverty measurement. It is a salutary reminder to geographers that the world is often too complex a place for the same methods of study and quantification to work well everywhere. The great strength of the Ethos Foundation’s index is that it adopts a Latin American viewpoint on poverty, one that is more localized but of far greater relevance to Mexico than previous alternatives.

Related posts:

The financial flows involved in Mexico’s vehicle manufacturing industry

 Other, Teaching ideas  Comments Off on The financial flows involved in Mexico’s vehicle manufacturing industry
Sep 192011
 

In previous posts, we have seen Where Mexico’s vehicle assembly plants are located, as well as looked at some of the reasons for Mexico’s success in this industrial sector and examined Mexico’s vibrant autoparts sector.

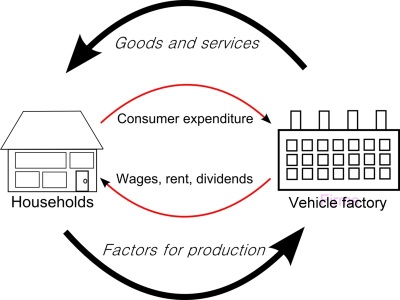
In this post we analyze the varied financial flows involved in the industry. Both local and international financial flows underpin vehicle manufacturing in Mexico.

financial flows

The following are some of the most important financial flows in the vehicle manufacturing sector.

  • International financial flows are in green
  • Domestic/local financial flows are in magenta

1. Foreign firms form Mexican subsidiaries and invest in Mexico; start-up capital to construct the factory and set up the business comes almost entirely from outside the country and enters Mexico as FDI. In recent years, FDI for auto firms has varied from $1 billion to $3 billion.

2. In many cases, local partners are involved, and they also contribute some of the start-up funds.

3. The factories employ workers, in some cases several thousand of them. These workers earn wages and spend most of their wages in the local economy. Each manufacturing job therefore has an economic multiplier effect, and generates more (indirect) jobs in the local economy. These jobs include positions in shops, services, transport, banking, auto-repair, etc. It is estimated that the economic multiplier for vehicle manufacturing is 3:1 – in other words, for every dollar spent in the industry three more are spent in the economy.

4. The factories purchase parts (components), some from Mexican suppliers, and some from overseas.

5. The factory produces vehicles, some of which are sold in the local market, via a series of vehicle distribution/sales points. This generates smaller two-way financial flows within the country.

6. Most of the parts and vehicles made in Mexican auto factories are exported. This generates another major financial flow, as purchasers overseas send funds back into Mexico to pay for their goods. This financial flow (a) allows production to continue and (b) generates profits for the factory owners (the car firms and shareholders).

7. The majority of these profits leaves Mexico, and is repatriated to the corporation’s home country, but both the workers in the factory, as well as the factory owners, pay taxes (state and federal) which remain in Mexico. In the case of shareholders, it is usually a financial flow towards their home country.

Previous posts in the mini-series:

Class exercise:

Use the description of financial flows above to draw an annotated diagram or a map to show the financial flows associated with the manufacturing of vehicles in Mexico. If you can think of additional flows that might be important, add those as well. Compare your diagram/map with that of other students and discuss the results.

The measurement of poverty: the Multidimensional Poverty Index (MPI)

 Other  Comments Off on The measurement of poverty: the Multidimensional Poverty Index (MPI)
Sep 132011
 

Measuring poverty sounds easy but is surprisingly difficult. What exactly constitutes poverty? What is “extreme poverty”? Simple poverty measures are often uni-dimensional. For example, many poverty figures quoted in the past were based on the proportion of the population having to survive on less than a dollar a day (later revised upwards to $1.25 a day). Such indices are simple and appealing, but inherently misleading. One of the more serious flaws of such indices (whatever the dollar figure used) is that $30 a month may be sufficient to purchase far more goods and services in some countries than in others. $30 in a European city like Geneva will not go anywhere near as far as $30 in the Mexican city of Oaxaca which in turn will not go anywhere near as far as in a mid-sized Chinese city.

The “Human Poverty Index” (HPI) was a vast improvement, since it combined the proportion of the population facing serious shortfalls in life expectancy, with measures of literacy and of living standards. HPI calculations are based on:

  • the percentage of population expected to die before the age of 40 years
  • the illiteracy rate among adults
  • the standard of living, worked out by combining the percentage of population lacking access to health services, the percentage lacking access to safe water, and the percentage of children under 5 years of age suffering from malnutrition.

Even this multi-criteria approach to defining poverty had its critics, with most arguments centering on which criteria should be included, or on their relative weighting within the index.

Another approach, adopted by Mexico’s National Political and Social Development Commission (Coneval) is (as we saw here) to combine income limits (about three dollars a day in this case) with social indicators in a multidimensional system. People in poverty have incomes below the limit and lack access to at least one of the list of social rights.

In 2010, an alternative multi-dimensional index, the Multidimensional Poverty Index (MPI) was published. This has quickly gained international acceptance and is rapidly becoming the preferred way of measuring poverty. The Multidimensional Poverty Index (MPI) was originally presented in an Oxford  Poverty & Human Development Initiative (OPHI) working paper by Sabina Alkire and Maria Emma Santos: OPHI WORKING PAPER NO. 38: Acute Multidimensional Poverty: A New Index for Developing Countries (July 2010).

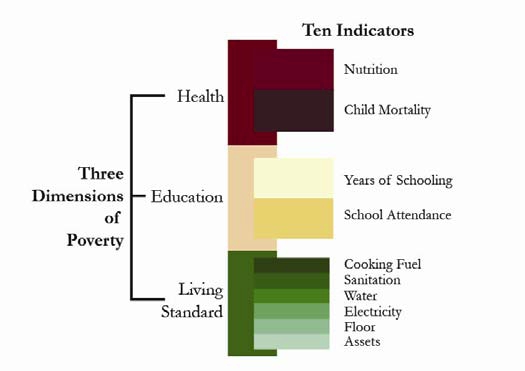
The MPI recognizes that poverty is a very complex phenomenon and seeks to identify the “deprivations that batter a person at the same time.” In the original paper, the index was calculated for 104 countries, with a combined population of 5.2 billion. The index consists of ten indicators corresponding to the three dimensions that are used to calculate the widely-used Human Development Index (HDI): Education, Health and Standard of Living. Each of the three dimensions is given equal weighting in the final index. Each of the indicators within each dimension is also given equal weighting.

Multi-dimensional Poverty Index

Multidimensional Poverty Index (MPI) (From Alkire & Santos, 2010)

Dimension One: Health [weighting 1/3 of total] Indicators:

  • Child Mortality: has any child in the family died?
  • Nutrition: Are any adult or children in the family malnourished?

Dimension Two: Education [weighting 1/3 of total] Indicators:

  • Years of Schooling: Have all household members completed 5 years of schooling?
  • Child Enrollment:  Were any school-aged children out of school in years 1 to 8?

Dimension Three: Standard of Living [weighting 1/3 of total] Indicators:

  • Electricity: Does the household lack electricity?
  • Drinking water: Does the household fail to meet Millennium Development Goal (MDG) targets, or is it more than 30 minutes walk to water
  • Sanitation: Does the home fail to meet MDG targets, or is the toilet shared?
  • Flooring: Is the floor of the home dirt, sand, or dung?
  • Cooking Fuel: Is cooking fueled by wood, charcoal, or dung?
  • Assets: Does the household own only one or none of the following: radio,TV, telephone, bike, motorbike?

From these values, the MPI can be calculated as the product of two numbers:

  • the percentage of people involved and
  • the “average intensity of deprivation” which reflects the number of dimensions in which households are deprived.

Many of these indicators overlap with indicators used to evaluate the Millennium Development Goals (MDGs). This means that analyzing MPI should help countries check their progress towards meeting several Millennium Development Goals (MDGs), while focusing on their most vulnerable people. (For details see the original paper). By looking at the simultaneous deprivations of households, it should help policy makers decide where they need to develop new strategies and where they need to refocus their efforts.

How does Mexico stack up on the Multidimensional Poverty Index (MPI)?

Mexico had an MPI rank of 29 out of the 104 countries surveyed (where the #1 rank means the least poverty), with 10.1% of the population deprived in terms of education, 9.2% deprived in terms of health and 6.7% deprived in terms of living standards.

A cautionary note is needed since any index is only as good as the data used in its calculations, but the MPI does seem to be a far more robust measure of poverty and personal deprivation than any of its predecessors.

Related posts:

Geo-Mexico: the geography and dynamics of modern Mexico is an excellent resource for courses in geography, economics, sociology and development studies, designed to be relevant to both general and academic readers. It provides an up-to-date account of Mexico suitable for students taking initial university or college courses related to geography, economics and Mexican or Latin American studies.  Buy your copy today!

Education professionals are invited to contact us if they would like to request a review copy. In addition, the entire book is searchable via the “Look Inside” feature of amazon.com

Sep 122011
 

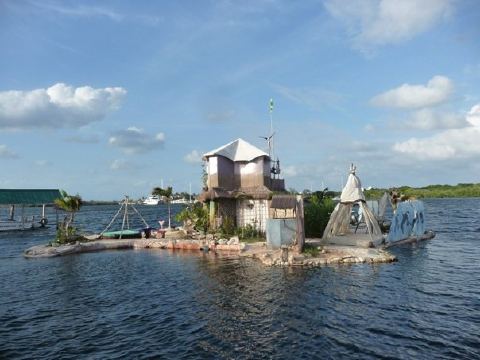
Richie (Rishi) Sowa is back! In 2002, Sowa, a former carpenter from Middlesbrough in England, completed the construction of his own private island paradise off the coast of Quintana Roo—built entirely of plastic bottles. Amazing but true! Sowa painstakingly constructed his island, known as Spiral Island, using more than 200,000 plastic bottles, and then lived on it! Unfortunately, his island home was entirely demolished by Hurricane Emily in 2005.

This was seemingly only a minor defeat since Sowa has since completed an even bigger and more resilient island on which to live, using the knowledge acquired from Spiral Island. His new creation is known as Joysxee. It is currently tethered to the island of Isla Mujeres, north of Cancún.

Joysxee

Joysxee. Photo: Rishi Sowa

Besides plastic bottles, Sowa used discarded wood and has planted vegetation including mangroves to help stabilize his home. His latest plan is to install a wave-powered propulsion system, allowing him to relocate his island at will, something I’m guessing he’s going to do next time a hurricane comes roaring in!

For Joysxee, Sowa has so far “reused” 125,000 plastic bottles. The island is 25 meters in diameter, and fitted with solar panels, a wave-powered washing machine. It comes complete with its own waterfall, river and (small) lakes. The island is designed to allow Sowa to be largely self-sufficient. The island’s vegetation includes many food sources such as palm trees, cacti, spinach, melons, lemons and tomatoes. The island will act as home to corals and fish as well.

Sowa’s ambition? To sail his eco-island round the world. He is the latest in a long line of English eccentrics, but you can only admire his creativity, artistry, vision and determination. Other people have sunk rusty old ships to make new underwater reefs, but how many have built an entire island from scratch, using discarded plastic bottles?

Not surprisingly, Joysxee, Sowa’s amazing home, has become an increasingly popular tourist attraction, receiving dozens of curious visitors a day. It is also a testimony to ecological sustainability.

Read more:

Want to support Joysxee?

Mexico’s vibrant autoparts sector

 Other  Comments Off on Mexico’s vibrant autoparts sector
Sep 102011
 

In previous posts in this mini-series, we have seen where Mexico’s vehicle assembly plants are located and looked at some of the reasons for Mexico’s success in this industrial sector. In this post, we consider the importance of the autoparts industry.

Each year, Mexico makes about 2 million vehicles, of which about 1.5 million are for export. Vehicle manufacturing is heavily dependent on parts manufacturers and suppliers. Vehicle assembly plants often require parts to be delivered in a “just in time” basis, to reduce the costs associated with warehousing and inventory. Mexico’s autoparts industry has grown rapidly in the last decade, and now accounts for about 7% of all the GDP derived from manufacturing activities, and for more than 8% of all manufactured exports.

The autoparts sector comprises about 1100 companies, one-third of which are Mexican-owned or controlled. Autoparts manufacturers employ more than 400,000 workers nationwide and exports of autoparts to the USA are worth more than $25 billion a year.

Car factories breed tire factories. Bridgestone, the Japanese tire-maker, and Pirelli, its Italian counterpart, are both investing in Mexico this year, expanding their production facilities and supply of tires to the North American market. Bridgestone is spending $100 million to upgrade its plants in Cuernavaca (Morelos) and Monterrey (Nuevo León), allowing production to rise to 10 million tires a year. Bridgestone also operates a retreading facility for truck tires in León, Guanajuato. Meanwhile, Pirelli is building a 210-million-dollar factory in Silao (Guanajuato) which will turn out 3 million high performance tires each year.

Good-Year campaign to recycle tires

Goodyear recycles tires

Related links:

For a useful map of major scrap tire piles either side of the border and a scary count of scrap tires, see Border 2012: U.S.–Mexico Border Scrap Tire Inventory, Summary Report (May 2007) (pdf file)

For some other (fun and extraordinary) ideas as to how old tires can be re-used, see Tires as Art.

Sep 082011
 

Geotourism is geography tourism (as opposed to tourism geography!). It applies to any recreational (tourism) activity where one of the primary objectives is to visit some phenomenon of geographic importance. This could be a coral reef, mangrove swamp, volcano, mountain peak, cave or canyon, but it could just as easily be a sinkhole, waterfall, new town or sugar mill. Ideally, geotourism should be sustainable, ecologically-aware and culturally-sensitive.

Geotourism often involves visiting landforms that hold special value: geomorphosites. Mexico has an amazing diversity of geomorphosites, quite possibly the richest collection of any country in the world.

What exactly are geomorphosites?

Geomorphosites were first defined in 1993 by Mario Panniza. Essentially, they are landforms that have acquired, over time, a certain value. Once noticed and made accessible to people, the landforms acquire scientific, cultural, historical, aesthetic, and socio-economic value. [1]

Panniza subsequently defined geomorphosites as,”landforms that have acquired a scientific, cultural/historical, aesthetic and/or social/economic value due to human perception or exploitation.” [2]

Reynard and Panniza state that geomorphosites can vary in scale from a single geomorphological object (eg a sink hole) to a wider landscape (eg a mountain range) and that geomorphosites “may be modified, damaged, and even destroyed by the impacts of human activities.” [3]

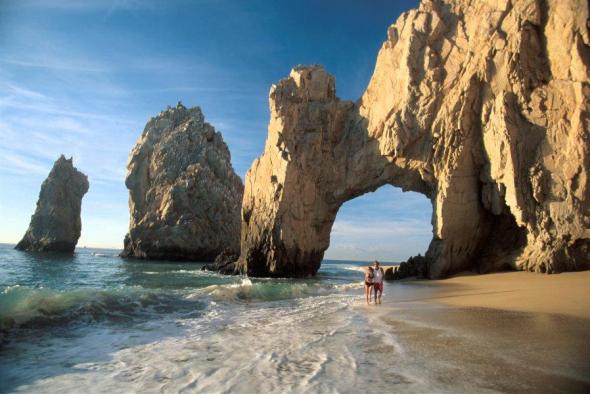
The marine arch at Cabo San Lucas, an example of a geomorphosite

The marine arch at Cabo San Lucas, an example of a geomorphosite

The dominant additional value may be economic, ecological, aesthetic or cultural, and this provides a starting point for assessing whether or not a particular landform is a geomorphosite or not.

The science study (see first comment below!) of geomorphosites is still in its infancy. Several competing classifications have been proposed, and no definitive consensus has yet been reached on the best way to quantify the value of a particular example.

One set of criteria for assessing geomorphosites includes:

A. Economic value:

  • accessibility,
  • number of visitors,
  • inclusion in promotional literature

B. Scientific/ecological value:

  • palaeogeographical interest,
  • singularity,
  • integrity (state of conservation)
  • ecological interest

C. Aesthetic value:

  • the number and spacing of belvedere points (high points from which a view is possible over the surrounding landscape)
  • shape
  • altitude
  • color

D. Cultural value:

  • cultural legacy (writing, art etc),
  • historical and archaeological significance,
  • religious relevance,
  • artistic and cultural events

Mexico has literally thousands of geomorphosites. We have already described some of them, including:

and we plan to highlight many more in future posts, including:

  • Piedras Bola (Stone Balls) in Jalisco
  • Peña de Bernal, a monolith in Querétaro
  • Sumidero Canyon in Chiapas
  • the iconic marine-eroded arch at Cabo San Lucas (see photo)

The scientific study of geomorphosites should enable researchers to suggest ways to approach their management. Unlimited access to some geomorphosites may generate a healthy flow of admission fees but could also easily increase erosion and hasten the destruction of the very thing that the tourists are paying to see.

On your next trip to Mexico, make sure to visit one or more of the country’s super-numerous geomorphosites!

References:

[1] Comanescu and Nedelea, Area (2010) 42:4, 406-416.

[2] Panizza M. (2001) Geomorphosites : concepts, methods and example of geomorphological survey. Chinese Science Bulletin, 46: 4-6

[3] Reynard, E and Panizza, M. (2005 ) Geomorphosites: definition, assessment and mapping, Géomorphologie : relief, processus, environnement , 3/2005

The reasons why Mexico has become one of the world’s top ten vehicle-making countries

 Other  Comments Off on The reasons why Mexico has become one of the world’s top ten vehicle-making countries
Sep 052011
 

As we saw in an earlier post – Where are Mexico’s vehicle assembly plants located? – Mexico’s autoparts and vehicle assembly industry plays a vital role in Mexico’s economy, attracting foreign direct investment (FDI), providing employment and bringing in billions of dollars in export earnings each year.

vw-plant-mexico

Mexico also has a large internal (domestic) market for vehicles. According to the Mexican Automotive Distributors’ Association, 820,000 vehicles were sold on the national market in 2010. The market leader is Nissan (with 23.5% of the domestic market), followed by General Motors (19.5%) and Volkswagen (13.2%). Mexico’s best-selling cars are the Nissan Tsuru/V16 and the Volkswagen Jetta. Nissan aims to have domestic suppliers for 90% of all its components by the end of 2011.

Why has Mexico become one of the world’s top ten vehicle-making countries?

  • Mexico already had a highly competitive manufacturing sector
  • Mexico has an excellent communications network, with several trans-border highways and rail lines, as well as several major ports. This means lower shipping costs
  • Stable exchange rate
  • Significant domestic market (population 112 million)
  • Mexico has formed an outstanding network of trade and investment agreements. Mexico has the world’s largest free trade agreements network, spanning three continents, and offers preferential tariffs to more than 44 countries.
  • Competitive labor costs
  • Responsible federal fiscal policies have increased the resilience of the national economy
  • Availability of skilled labor and well-educated, multilingual managers
  • Proximity to the USA, both for investments and for markets
  • Lower production costs: since 2009, the manufacturing costs for vehicles in Mexico has been between 80% and 90% of the equivalent cost in the USA.
  • Total production and delivery costs: For vehicles sold in the USA, costs are lower for vehicles made in Mexico than for those made anywhere else, including China, India and Brazil.
  • Government support: To stimulate higher-value activities (engineering, design, testing, R&D), Mexico’s government offers numerous incentives, including job training and tax credits.

Vehicles made in Mexico are high quality
Mexican manufacturing plants have consistently done well in the annual quality surveys undertaken by market research firm JD Power and Associates. The study has been conducted annually for the past 17 years and provides an important benchmark for the automotive sector. Vehicles made in Mexico usually have fewer defects than those made in the USA. In 2008, the Toyota plant in Baja California won the award for the top ranking plant in the Americas.

The top ten manufacturers:

According to the latest figures from the International Organization of Motor Vehicle Manufacturers (OICA), Mexico was the world’s 9 th largest vehicle-maker (2.2 million vehicles) in 2010, behind China, Japan, USA, Germany, South Korea, Brazil, India and Spain, but ahead of France, Canada, UK, Italy and Russia.

Further information:

For more facts and figures (with graphs and maps useful for teaching purposes): Mexico and the Automotive Industry, a strategic place to invest. Gerardo Ruiz Mateos, Ministry of Economy. June 2010. (pdf file)

Sep 032011
 

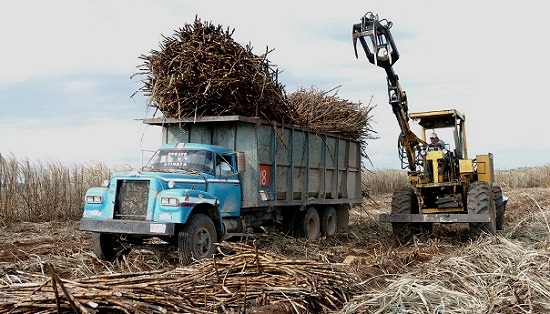
The sugar industry accounts for 0.5% of national GDP. Sugarcane fields cover 670,000 hectares (1.6 million acres) in Mexico, the second largest crop area after corn. Yields of sugarcane range from 60-70 metric tons/hectare.

Main growing areas in Mexico

The main cane producing states are: Veracruz (1.9 million metric tons), San Luis Potosí and Jalisco (each 0.6 million), Oaxaca and Chiapas (each 0.3 million), and Nayarit, Tamaulipas and Morelos (each 0.2 million). Veracruz is the leading state by far in terms of area of sugarcane fields, with 260,000 hectares devoted to cane, folled by Jalisco, San Luis Potosí and Oaxaca (each with around 56,000 ha) and Tamaulipas (43,000 ha).

SugarcaneSugarcane fields and their associated sugar mills form a highly distinctive landscape in many parts of Mexico, with the greatest concentrations on the coastal plains on the Gulf and Pacific coasts, together with numerous higher-altitude river valleys in central Mexico.

History and land tenure

Sugarcane was brought to Mexico by Spanish settlers. Many major plantations were established, as they were in the Caribbean and Brazil. Mexico’s indigenous population provided a resident labor force, augmented by the introduction of some slaves from Africa (see Blacks outnumbered Spaniards in Mexico until after 1810).

The large colonial sugar haciendas in Mexico (and some were very, very large indeed) exerted considerable influence over politics and local economies. Sugarcane remained an important crop following the Mexican Revolution (1910 onwards) which led to rural reorganization and much stricter controls on the size of land holdings. Sugarcane is grown on 150,000 farms, making their average size small, under 4.5 hectares (11 acres) each. This is partly a consequence of the Mexican Revolution which limited maximum farm size. About half of all sugarcane production units are 2 hectares or less in area. The small average size of sugarcane farms places severe restrictions on possible investments and effectively prevents any economies of scale.

Employment

The sugarcane sector employs about two million people directly and indirectly. The number of direct jobs includes:

  • 150,000 growers
  • 100,000 seasonal sugarcane cutters
  • 20,000 cane transport workers
  • 30,000 sugarmill workers
  • 7,000 administrative, technical and management personnel

Harvesting and production

The annual harvesting of sugarcane in Mexico runs from late October to June. During the 2010-2011 harvest, 670,000 hectares of cane fields were cut yielding 44 million metric tons of cane, from which 5.2 million metric tons of sugar was extracted, 7.4% more than for the 2009-2010 harvest.

Sugar mills

More than 50 sugar mills currently operate in Mexico. The mills vary greatly in size, age and technology. Many are small, old and inefficient, which increases the cost of sugar production in Mexico compared to countries with newer methods and equipment. Mexico’s sugar mills have weathered numerous financial crises. In 2001, 27 mills were placed under government control, with about half of these mills later sold back to private ownership. In 2005, a revised Sugarcane Law guaranteed a basic reference price for growers, improving their financial security. Almost half of all Mexico’s sugar mills are located in Veracruz state. The remaining sugar mills are scattered among an additional 15 states.

Domestic consumption of sugar

Mexico’s domestic market consumes around 4.5 million metric tons a year, with the largest demand coming from the soft drinks industry. Consumption is expected to fall this year, due to reduced consumer purchasing power and escalating domestic prices for sugar fueled by speculation and supply shortages.

Sugar exports

Mexico is the world’s 6th largest exporter of sugarcane, and the main supplier of sugar to the USA. For the 2010-2011 season, sugar exports to the USA totaled  a record 1.3 million metric tons. This figure has been increasing rapidly in recent years, partly due to sugarcane’s inclusion under the terms of NAFTA.

Despite its exports, Mexico also imports small quantities of sugar, mainly from Nicaragua in order to maintain its own sugar reserves of around 1 million tons.

The challenges faced by Mexico’s sugar industry

Mexico’s sugarcane industry faces numerous serious challenges, including:

  • poor drainage of soils in some areas
  • winter frosts in some mountain areas, especially in the more northerly growing regions.
  • limited rainfall – cane requires 1100–1500 mm (43–60″) of precipitation a year; unreliable precipitation, especially periods of drought, are a major problem, especially in Veracruz where irrigation systems are inadequate
  • level of production inputs (fertilizers, pesticides, etc)
  • transport costs which contribute to the high price of sugarcane in Mexico
  • small size of production units which limits investment and improvements
  • low efficiency of older sugar mills

Environmental degradaion

Environmental degradation is one of the most serious issues facing Mexico’s sugar industry, given the nature of sugarcane processing and the age of many of Mexico’s sugar mills:

  • much of Mexico’s cane is still hand-cut, and burning the cane fields prior to harvest is still a common practice, since it makes harvesting easier and drives out snakes. However, it has an adverse effect on air quality as well as on soil nutrients, structure and microorganisms.
  • Large volumes of water are used in growing and processing sugarcane. Much is wasted; some is returned to groundwater sources or streams heavily polluted. More recycling and water treatment plants are needed.
  • Air pollution is also a problem with some mills still to fit modern emissions control devices.
  • The safe disposal of processing waste (some of which has potential value for subsequent use in other industries) is also a continuing problem. Sugar mills produce a variety of waste materials, many of which are currently dumped.

Further reading:

The geography of Mexico in the 21st century (cartoon)

 Other  Comments Off on The geography of Mexico in the 21st century (cartoon)
Sep 022011
 

Below is Mexican cartoonist Negrinho’s view of the “Geography of Mexico in the 21st Century“, which shows how “In the course of history, the geography of Mexico has changed: its natural environment due to deforestation, its politics, society and even its security…”

Geography of Mexico in the 21st Century

Geography of Mexico in the 21st Century. Credit: Negrinho

The cartoon dates from a few years ago, and features references to politics, drug cartels and their leaders, the spate of unsolved murders of young women in Ciudad Juárez and “mojados” (“wetbacks“, undocumented migrants crossing the border into the USA).

This cartoon is one of a series entitled Mexico 32: Futbol y Caricaturas Políticas.

Sep 012011
 

In a recent post, we looked at the vexed question of the overall 2010 homicide rate for Mexico. We included a mention of  National System of Public Security (SNSP) data for Mexico that show that there were 18 intentional homicides (murders) per 100,000 population in 2010. This rate varies greatly from state to state (see graph). The rate in the state of Chihuahua, the epicenter of drug war violence, is 112 per 100,000 which is roughly twice as high as any individual country on the planet. Sinaloa which has experienced a rapid upsurge in drug violence was second with a murder rate of 87 per 100,000.

murders by state, 2010

Source: National System of Public Security (SNSP)

Other states with very high murder rates are Nuevo León with 76, Durango with 63, and Guerrero with 44. All of these states suffer from very high rates of drug-related murders. Over 93% of all murders in Chihuahua are drug-related, compared to 73% in Sinaloa, and about 70% in both Guerrero and Durango. The non-drug-related murder rate for Chihuahua of 9.4 is just above the national average of 8.1.

Yucatán has the lowest murder rate with just 0.5 murders per 100,000, lower than the rate in Canada and about one-tenth that of the USA. Other states with relatively low murder rates (see map) include Querétaro (1.0), Tlaxcala (1.5), Hidalgo (5.0) and Tabasco (5.4). All of these states are relatively free of drug-related violence.

Map of murder rate, 2010

Map of murder rate, 2010. Credit: Tony Burton / Geo-Mexico.

The national murder rate of 17.9 is almost twice the rate for the Federal District (D.F.) which is 9.2 per 100,000. Only about 18% of the murders in the capital city are drug-related. The murder rate in Jalisco of 12.0 is well below the national average, even if it has increased rapidly. Over half the murders in Jalisco in 2010 were drug-war-related. The State of Mexico also has a relatively low murder rate of 7.6 with 30% of murders related to the drug wars.

The main conclusion is that many northern states like Chihuahua, Sinaloa, Nuevo León and Durango are plagued by drug war violence and have very high murder rates. On the other hand, most states in the south and southeast, like Yucatán, Campeche and Tlaxcala are relatively free of drug war violence and historically have had low murder rates. One significant anomaly in the overall pattern appears to be Guerrero which is well to the south but has a high murder rate and a very significant amount of drug violence.

Are homicide rates in Mexico increasing? Perhaps, but…

 Other  Comments Off on Are homicide rates in Mexico increasing? Perhaps, but…
Aug 252011
 

This question is far more complicated to answer than might initially appear. To start with there are two primary sources of homicide data in Mexico which provide very different results and vary significantly from state to state and year to year.  The National System of Public Security (SNSP) compiles homicide statistics from police reports and investigations.  The National Institute of Statistics and Geography (INEGI) obtains homicide data from death certificates reported through the Ministry of Health. For 2010, SNSP reported 35,053 homicides in Mexico, while INEGI – Reporta el INEGI más de 24 mil muertes en 2010 – reported 24,374 homicides.

For a very interesting comparison (in Spanish) of trends over time for these two data sources, including a detailed look at the trends in some individual states, see:

For two earlier posts using SNSP data, see:

What factors may explain why the data is so different?

The terminology associated with homicides is very complex. This is equally true in English and Spanish. Even the basic subcategories do not necessarily match closely from the legal system in one country to that in another. Legal definitions and classifications depend in part on subjective decisions by officials concerning such things as the perpetrator’s motive, intent and state of mind.

In general terms, homicide (homicidio) means the deliberate killing of one person by another. A homicide may be either an:

  • intentional homicide or murder (homicidio doloso) or an
  • involuntary homicide, negligent homicide or case of manslaughter (homicidio culposo)

In some jurisdictions, intentional homicides are further divided into such categories as “first degree murder” and “second degree murder”.

The data associated with homicides are at least as complicated as the legal definitions. Statistics originating from police records will never exactly match those coming from death certificates or public records. For instance, some individuals may have been recorded originally as dying from accidents, natural causes or suicide on their death certificates, but then shown later to have been intentionally killed (murdered) and therefore counted in police records as murder victims. There are numerous possible scenarios in which the police data will differ from the data recorded on death certificates.

Differences in terminology, definitions and application may explain some of the differences in the two data sets, but is very unlikely to explain 100% of such significant differences, so care is needed before drawing any conclusions about Mexico’s homicide rate.

What do the figures for homicides suggest?

In 2000, INEGI, Mexico’s National Statistics Agency, recorded 10,743 homicides in Mexico. This number dropped gradually to 8,897 in 2007 before jumping up to 14,006 in 2008, 19,803 in 2009 and leaping  23% in 2010 to 24,374. Current information suggests the number of homicides will be at least as high in 2011.

The SNSP data have become significantly higher than INEGI data in recent years. They also show an increase in the number of homicides in 2010 (compared to 2009), but of only 11%.  Both data sets indicate a rapid increase. This is especially troublesome given that murder rates had declined rather steadily up until the “drugs war” started in earnest in 2007.

If we average the INEGI and SNSP numbers, it suggests that the overall 2010 homicide rate was about 27 per 100,000 population.

How does Mexico’s murder (intentional homicide) rate compare to that in other countries?

Wikipedia’s list of intentional homicide (murder) rates claims that Mexico’s murder rate in 2010 was 15 per 100,000. SNSP data for Mexico show 2010 figures of 18 per 100,000. Either of these figures is very high compared to Canada (1.6 per 100,000), Peru (3.2) or the USA (5). On the other hand, Mexico’s homicide rate is rather low compared to Honduras (78), El Salvador (65), Venezuela (48), South Africa (34) and Brazil (25). In 2007, Mexico’s murder rate was about 8.4 per 100,000, very close to the world average.

How many of Mexico’s murders are drug-war related?

Data released last January by the Mexican government indicated that drug-war deaths increased in 2010 by 5,659 from 9,614 to 15,273. These data suggest that 63% of Mexico’s intentional homicides in 2010 were related to drug violence compared to only 49% in 2009, 28% 2007 and roughly 10% in 2006. In fact, non-drug-war-related intentional homicides in Mexico appear to have declined 11% from 10,189 in 2009 to 9,101 in 2010, less than the total number of homicides in any year from 2000 through 2006.

This brings us back to our original question, “Are homicide rates in Mexico increasing?” Yes, they are increasing, but only as a result of the much publicized “war on drugs”. It is likely that if there was no drugs war, then Mexico’s homicide rate would be continuing to decline, consistent with its long-term trend.

Related posts, relying on data issued by the Office of the President of Mexico:

Aug 222011
 

The proposed implementation of a United Nations-supported carbon storage program (REDD) in the southern Mexican state of Chiapas is provoking plenty of controversy. The debate is hotting up because a follow-up program called REDD+ is due to start in 2012. A good summary of the situation is provided by REDD rag to indigenous forest dwellers.

What is REDD?

  • REDD stands for Reducing Emissions from Deforestation and Forest Degradation
  • It is a carbon storage program, started in 2008 by the Food and Agriculture Organization (FAO), the U.N. Development Programme (UNDP) and the U.N. Environment Programme (UNEP).
  • It aims to conserve biodiversity and boost carbon storage by preventing deforestation and by replanting forests
  • It is focused on developing countries, and provides them wih funds and technical support

At first glance, it would seem like a good fit for Chiapas, one of Mexico’s poorest states, where a high proportion of the population are reliant on subsistence farming. The Chiapas state government backs REDD, considering it as one way of helping mitigate the likely consequences of climate change in the state. Chiapas’ total emissions of carbon dioxide amount to 32 million metric tons/year, about 4.5% of the national figure. The Chiapas contribution comes mainly from deforestation and farming.

NGOs working in Chiapas warn that REDD poses a serious threat to indigenous people. About 20% of the 4.8 million people living in Chiapas belong to one or other of the state’s numerous indigenous groups. Land tenure in many parts of Chiapas is hotly disputed; this was one of the reasons for the EZLN (Zapatista Army of National Liberation) uprising in 1994.

Protests in support of indigenous rights, Cancún climate summit

Protests in support of indigenous rights, Cancún climate summit, 2010

Miguel García, a spokesperson for an NGO founded in 1991 which supports indigenous groups and protects the environment, has been quoted as saying that REDD “will alter indigenous culture, will commodify it, giving commercial value to common assets like oxygen, water and biodiversity.” He is especially concerned that “resentment of and confrontation with the Zapatista grassroots supporters are being accentuated.”

As with so many geographic issues, there is no easy “right answer” here. The rights of indigenous groups need to be respected and their views taken into account, before any decision is made about the value of their forest home to global efforts to mitigate climate change.

This is one controversy we plan to follow as it plays out in coming months.

Want to read more?

Related posts:

The Transnational Metropolitan Areas of Mexico-USA

 Other  Comments Off on The Transnational Metropolitan Areas of Mexico-USA
Aug 092011
 

Mexico shares a 3,169 km (1,969 miles) border with the USA. This is one of the most heavily guarded and frequently patrolled  land borders in the world, and a rare example of a land border that separates two countries with very different levels of economic development. These differences in development have, of course, prompted many Mexicans to migrate to the USA, either as seasonal or permanent migrants, and whether “legal” or undocumented.

Some regional geographers have even proposed that a regional division of North America should include a distinctive “border region”,  an international region straddling the boundary and including all border crossings and many notable cities. This region experienced rapid economic growth following the signing of NAFTA, when many companies moved to northern Mexico, setting up maquiladora manufacturing plants. The border area has long been a major focus of drugs-smuggling, with border transport of illegal narcotics getting ever more inventive. In recent years, sadly, this same area has become the scene of some of the worst drugs-related violence in the world.

Population of Mexico-USA Transnational Metropolitan Areas.

Population of Mexico-USA Transnational Metropolitan Areas. Credit: Tony Burton; all rights reserved

The map shows the 2010 population of the major transnational metropolitan areas of Mexico-USA. The diameter of each circle represents the combined population of the twin cities that have grown up either side of the border. The pattern closely reflects the volumes of overland transport links (road and rail) between the two countries, as well as of commuters who live one side of the border, but work on the other side and cross daily.

The easternmost part of the boundary between Mexico and the USA follows the Río Bravo (Grande). Inevitably, there have been disputes when the river changed its course. Part of the western boundary follows the course of the Colorado River, from which so much water is taken that it now rarely flows into its delta region in Baja California. All the varied boundary and water-rights treaties and agreements between Mexico and the USA are decided via the International Boundary and Water Commission.

Related posts:

Aug 082011
 

Durango has long been considered the scorpion capital of Mexico (even the local soccer team became known as Los Alacranes, the Scorpions). At one point in the past, the city paid a bounty for each scorpion killed. Some historical accounts suggest that the scorpion catch rose dramatically, until the local authorities realized that some families had started their own financially lucrative scorpion-breeding programs.

These days, few scorpion stings are reported in Durango, partly because Durango’s scorpion hunters (alacraneros) catch and kill thousands each rainy season; prime specimens are encased in souvenir key rings and wall clocks sold in the local market. They also supply medical research labs.  Research in one lab at the University of California has isolated several peptides that appear to suppress the immune system, promising another way to prevent transplant rejection.

Lourival Possani, and his colleagues at Mexico’s National University (UNAM) have discovered a toxin (named scorpine) in scorpion venom that slows down the growth of malaria parasites in fruit flies; if similar techniques work in malarial mosquitoes, it may be possible to dramatically reduce the spread of malaria.

About 250,000 people in Mexico are stung by scorpions each year—more people than in any other country. Several dozen people die each year. Indeed, for the past 20 years, scorpion stings have been the leading reason in Mexico for  deaths due to adverse reactions and poisoning caused by venomous plants and animals. There are more than 200 different species of scorpions in Mexico, of which only 8, all belonging to the genus Centruroides are a significant public health risk. The map shows the areas defined by Mexico’s Health Secretariat as being of High, Medium and Low risk for dangerous scorpions.

Mortality remains higher in the smallest settlements, and is greatly reduced in mid-sized and large settlements. This is a function of both the reduced proximity of medical care in small settlements and of the higher numbers of scorpions/10,000 people in less urbanized settings. The highest mortality rates by age occur in the 0-1 years group (7 deaths/million), followed by the 1-4 age group (3.8/million) and the 60+ years group (0.8/million) (all data from http://www.scielo.br/pdf/rpsp/v21n6/05.pdf)

Scorpion risk in Mexico

Scorpion risk in Mexico (Secretaria de Salud)

Fortunately, progress is being made. The number of recorded deaths from scorpion stings [1] has fallen from more than 1,000/year in the 1950s to 285 in 1995, about 80 in 2003, and 57 in 2005. This improvement is the result of public health campaigns stressing the importance of seeking emergency treatment and of the development of antivenin serum (known as Alacramyn in Mexico and Anascorp in the USA). Mexico’s antivenin industry, led by the Bioclon Institute, is world class, exporting serum to the USA and Australia as well as throughout Latin America. The biggest threat from scorpions comes from central and northern states in Mexico, including several along the Pacific Coast: Nayarit, Jalisco, Colima, Michoacán and Guerrero.

According to UNAM’s Biomedical Investigation Institute, 277,977 people in Mexico reported scorpion stings in 2010. In the first five and a half months of 2011, 98,818 people in Mexico have been stung. The five states with the highest incidence of reported scorpion stings are: Jalisco (19,995), Guerrero (15,769), Morelos (13,123), Guanajuato (12,326) and Michoacán (10,597).

The incidence of scorpion stings rises sharply in summer when higher temperatures encourage scorpions to leave their lairs and go exploring.

Q. What other factors, besides the ones mentioned in this post, might help explain the pattern of risk shown on the map? Hint – can you think of things that the states shown as “high risk” — or the “low risk” ones — have in common?

– – – – –

[1] A Google search using the terms “scorpion”, “deaths” and “Mexico” finds dozens of websites all claiming that “In Mexico, 1000 deaths from scorpion stings occur per year.” This includes the two highest ranking sites in the results here and here, for articles dated 14 April 2011 and 20 August 2009 respectively. Given that 1000 deaths/year from scorpions has not been true for 20+ years, perhaps it’s time for these sites  to update their data by referring to Geo-Mexico!

The troubled rise of the Green Movement in Mexico

 Other  Comments Off on The troubled rise of the Green Movement in Mexico
Aug 012011
 

Two specific events helped stimulate the rapid growth of Mexico’s green movement in the 1980s:

These motivated many citizens to take direct action. Membership in Environmental Non-Governmental Organizations (ENGOs) surged, as “green brigades” aided the victims. Two months after the earthquake, representatives from 300 regional groups met and formed a coalition of green groups focused on issues such as deforestation, pollution, and opposition to nuclear power. The 1992 Rio UN Environmental Summit and opposition to NAFTA (because it neglected environmental issues) provided additional stimulus to the movement.

The number of ENGOs increased from fewer than 30 in 1985 to about 500 by 1997 when about one in twenty Mexicans was a member of an ENGO.  The ENGOs had highly professional staffs and were well funded from Mexican and international sources. Through demonstrations and militant actions they successfully stopped the construction of a half billion dollar tourism complex south of Mexico City and the proposed world’s largest salt mine in Baja California. They also were significant in the passage of new laws for environmental protection, reducing deforestation, protecting wildlife, and establishing protected areas.

Vicente Fox, the PAN/Green Party candidate, won the Presidency in 2000.  His Minister of the Environment, Víctor Lichtinger, brought scores of highly qualified fellow key ENGO leaders into the administration. While this put the nation’s leading environmentalists on the inside, it also essentially “decapitated” and deflated the ENGO movement, especially its more militant members. Despite these key appointments, Fox’s administration gave relatively low priority to environmental issues. When Fox sided with tourism investors, and decided against issuing a detailed analytical report on beach pollution, Lichtinger and many of his senior staff resigned. They mostly moved to international or academic positions and consequently did not rejuvenate the leadership of the ENGOs they had left.

Green party logo

Green party logo

For the 2006 election, the Green Party formed an alliance with PRI and came in a weak third. The party, which has suffered from despotism, bribery and violation of election laws, managed to elect 22 diputados in the 2009 election. The Calderón Presidency has obtained good environmental marks for its leadership in global warming; however its comprehensive tree-planting program has received some criticism. Current ENGO activity is focused less on high profile mass mobilizations and protests, and more on specific issues such as legislative  lobbying, public awareness, climate change, energy issues, water, deforestation, biodiversity, recycling and local tree=planting and clean-up campaigns.

Main source: Jordi Díez, “The Rise and Fall of Mexico’s Green Movement”, European Review of Latin American and Caribbean Studies 85, October 2008, 81-99.

Mexico’s environmental issues are analyzed in many chapters of Geo-Mexico: the geography and dynamics of modern Mexico, including chapter 30. Explore the book using Amazon.com’s Look Inside feature and buy your copy today!