Maintaining the drains and sewers of Mexico City

 Other  Comments Off on Maintaining the drains and sewers of Mexico City
Jan 312012
 

How is Mexico City’s choking sewer system cleaned? Have you ever wondered who is responsible for the gross job of cleaning the city’s sewer system to help ensure it never gets blocked? Well, we did and were surprised at the answer…

In previous posts, we looked at the history of attempts to drain Mexico City:

and at the construction of a massive tunnel to improve the city’s drainage:

At present, both the water supply system and the sewer systems of Mexico City are managed by a single government entity, the Sistema de Aguas de la Ciudad de México (SACM).

In 2008, the system’s main existing tunnel was shut down for its first maintenance in 35 years. To maintain the drains and sewers, Mexico City relies heavily on its experienced team of divers, all two of them! They are thought to be the only sewage divers in the world. This 2010 interview from the always interesting blog ediblegeography.com with diver Julio Cou Cámara is a mind-opening read.

In his own words, “What we mostly do is maintenance. We repair pumps, we take out debris—we take out bodies of animals, bodies of people, and all the rubbish. There’s so much rubbish in the drainage system, it’s very harmful to us and to the city. People are always wondering why there’s so much flooding in the city. I can tell you that the city floods because of all the rubbish that creates blockages in our drainage system. If we were maybe a bit more conscious about rubbish and we didn’t throw it on the street, we wouldn’t have this many flooding problems in the city.”

Frankly, this challenging job does not sound like much fun: “We work blindly in the black water. It contains animal poo, human poo, hospital waste… any kind of pollution you can think of. All of that is in the sewage water. That’s where we work.”

So, now you know! The sewers of Mexico City would function far worse if it wasn’t for the unsung heroism of workers like Carlos Barrios and Julio Cou Cámara.

(But if a vacancy comes up, please don’t call)

Nestlé helps program to regenerate Mexico’s coffee industry

 Mexico's geography in the Press  Comments Off on Nestlé helps program to regenerate Mexico’s coffee industry
Jan 282012
 

Coffee trees are planted on 688,000 ha in 12 states, mainly in southern Mexico. The main coffee-producing states are Chiapas, Oaxaca, Puebla, Veracruz and Guerrero. As we reported in an earlier post, Mexico is financing a program to gradually replace aging coffee trees. The average yields of coffee in the 2010-11 season did show a slight increase on previous years. Officials hope this is the start of a trend of higher yields as the older trees are gradually replaced. The program to replace coffee trees is being supported by Nestlé, the Swiss food corporation.

Between 2002 and 2010, more than 4,000 growers in several states benefited from Nestlé’s distribution of more than 3.9 million coffee plants as part of a nationwide plan to replace aging coffee trees. Nestlé has since announced that it plans to establish its first coffee-propagation center in Mexico, in the southern state of Chiapas, in a joint venture with Agromod, a Mexican crop technology company, and the National Forestry, Farming and Fishing Institute (Instituto Nacional de Investigaciones Forestales, Agrícolas y Pecuarias, INIFAP).

The project will supply 30 million coffee plants by 2020, and mean that Nestlé will no longer need to import coffee plants to Mexico from its facility in Tours, France. As many as 20,000 coffee-growers will benefit from the project. Most of the new plants will be arabica varieties (for premium beans); the remainder will be robusta varieties (used in instant coffee blends).

Related posts:

Mapping remittance flows to Mexico, a practical exercise

 Books and resources, Teaching ideas  Comments Off on Mapping remittance flows to Mexico, a practical exercise
Jan 262012
 

Looking for a practical exercise about migration and remittance flows to challenge your students?

Remittances (the funds sent by migrant workers back to their families) are a major international financial flow into Mexico. Remittances bring more than 20 billion dollars a year into the economy, an amount equivalent to 2.5% of Mexico’s GDP. On a per person basis, Mexico receives more worker remittances than any other major country in the world. An estimated 20% of Mexican residents regularly receive some financial support from relatives working abroad. Such remittances are the mainstay of the economies of many Mexican families, especially in rural areas of Durango, Zacatecas, Guanajuato, Jalisco and Michoacán.

Two data tables [see link]  included in the World Bank Working Paper by Raúl Hernández-Coss, referred to in several previous posts, offer an ideal starting-point for practical mapping and analysis exercises for students. (The data is from 2004 but we are more interested in general patterns than precise values). The data tables are here:

A ready-made printable base map, showing the state boundaries of Mexico and USA, can be found here:

Suggested mapping exercises:

1. Which US areas have most Mexican migrants?

Use Column 2 (Mexican nationals living in this jurisdiction) of Table VI.A.1 and draw proportional circles on a base map to show which areas have most migrants. [To draw circles where the area of each circle is in direct proportion to the number of Mexican nationals, the first step is to calculate the square root of each number. These square roots are then used as the basis for working out the diameter (or radius) of the circle you draw for each location. The area of each circle is then proportional to the number of migrants. Remember to choose the most appropriate scale for the circles, so that it is easy to compare places. (If you draw very small circles, or super-large circles, they will be difficult to compare!)

2. Which US areas send the highest value of remittances back to Mexico?

Use column 4 of Table VI.A.1 to show the value of total “annual remittance flows” on a base map. You may be able to superimpose this information on the same base map you drew for Q1 which would make it very easy to see if the areas with most Mexican nationals send the most remittances back to Mexico each year. Can you see any anomalies on your map, either where an area sends far more remittances back than might be expected from the number of migrants, or where an area sends only a small value of remittances back despite having a very large number of Mexican nationals?

3. How does the “average remittance” (column 5 of Table VI.A.1 vary?

Use the available figures to see if you can identify any pattern to which areas send relatively large remittance payments, and which send much smaller average payments.

4. Where do all the remittance payments go?

Level One: Use the information from Table VI.A.2 to draw a map with arrows showing the largest single flows from each area in the USA to their corresponding state in Mexico.

Level Two: Work out the dollar value of the main remittance flows, by using the % figures given for some areas in Table VI.A.2 and their corresponding total annual remittance values from Table VI.A.1. (eg the value of the Los Angeles to Jalisco flow is 26% of $7,886.3 million). Then map the ten largest flows using flowlines (arrows where the width of each arrow is proportional to the value of remittances).

Look at the map or maps created and see if you can identify any patterns. If you can describe a pattern, then also look to see if you can find any anomalies, and try to explain your findings.

Related posts:

Jan 232012
 

As we saw in an earlier post – Attempts to provide drainage for Mexico City date back to Aztec times – Mexico City has serious drainage problems. Because of the shifting subsoil as the land on which the city was built sinks an average of 10 cm/yr, the main drainage tunnels built years ago no longer have the slope (grade) they need to work efficiently. At least one of the feeder tunnels now slopes in the wrong direction!

This has greatly increased the risk of catastrophic flooding occurring. After years of discussion, authorities decided a few years ago that the only viable solution was to construct another major drainage tunnel to take pressure off the existing system and increase the maximum drainage rates following heavy storms.

The new tunnel, known as the Eastern Drainage Tunnel (Túnel Emisor Oriente), is said to be the world’s largest ever drainage tunnel and should be completed within the next couple of years. It is 7 m (23 ft) in internal diameter (wide enough for a tractor trailer) and can carry up to 150 cubic meters of water a second.

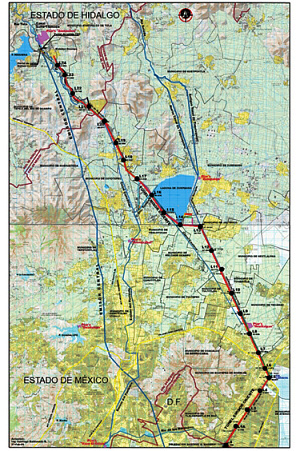
Map of tunnel route

Map of tunnel route; the new tunnel is in red, the existing Central Tunnel is in blue

The tunnel is 62 km (39 mi) long. It starts from the interceptor channel of Río de los Remedios and ends in a treatment plant in Atotonilco de Tula (Hidalgo), close to where the existing Central Drainage Tunnel flows into the El Salto River. Atotonilco receives 725 million cubic meters of water each year carrying 180,000 tons of garbage. Some of the treated water will be piped to the Mezquital Valley Irrigation District in Hidalgo where water usage exceeds natural replenishment rates. The remainder of the treated water will be given additional (tertiary) treatment before being piped into the overexploited underground aquifers to replenish them.

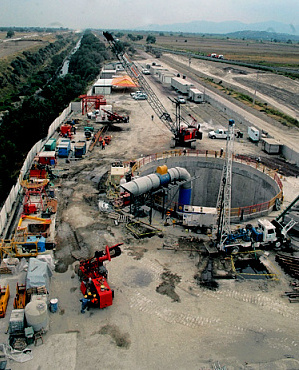
photo of new tunnelThe Eastern Drainage Tunnel construction project is one of Mexico’s largest engineering undertakings ever. The total investment (45% government, 55% private) is almost a billion dollars. Six massive boring machines are working in coordination, each boring a 10km section of the tunnel. The work is challenging, partly because of the varied nature of the rocks (limestone, volcanic rock, sand and clay) and partly because parts of the tunnel are as much as 200m (equivalent to 40 stories) below the surface.

Ventilation shaft of new tunnel

Ventilation shaft of new tunnel

The geography of wildfires in Mexico: the disastrous wildfire season of 2011

 Other  Comments Off on The geography of wildfires in Mexico: the disastrous wildfire season of 2011
Jan 212012
 

In the past 20 years, wildfires have destroyed 47,000 square kilometers (18,000 sq. mi) in Mexico, equivalent to five times the area of all sections of Mexico City’s Chapultepec Park, the largest urban park in Latin America. The average fire in Mexico affects 32 hectares (80 acres); this figure has not changed significantly in recent years, even though the incidence of fires has increased somewhat due to a combination of climate change and an increase in the number of people living on the margins of forested areas. The National Forestry Commission (Conafor) says that 99% of Mexico’s forest fires are caused by human error, and only 1% are due to natural causes such as lightning strikes.

It generally takes about 30 years to rehabilitate forest areas ravaged by fire, with reforestation costing up to $2400/ha.

Wildfires are not entirely bad. For example, they help regenerate grassland areas, especially, with fresh young plants. On the other hand, in addition to protecting the existing vegetation, stopping wildfires when they occur helps to preserve soil structure and prevents additional emissions of CO2 from the burning of more plant material. At a national level, it is estimated that fires result in the erosion of 86 million metric tons of soil a year.

In a 2009 study, Conafor used 17 variables to identify the areas of the county with the highest risk of wildfires. Three broad areas accounted for the 900,000 square kilometers identified as having either a “medium” or “high risk” for wildfires:

  • i. Yucatán Peninsula, Chiapas, Oaxaca and Guerrero
  • ii. Central Mexico – Veracruz, Tlaxcala, Puebla, México, Michoacán, Jalisco and the Federal District. This area has more fires than any other because local populations often use fire to clear fields before planting.
  • iii. Baja California. This is the only area where the main fire season is in summer, from March to November. This is the rainy season in the remainder of Mexico, where the fire season corresponds with the winter dry season.

The first half of 2011 was an especially bad period for wildfires in Mexico, the worst for at least 30 years.

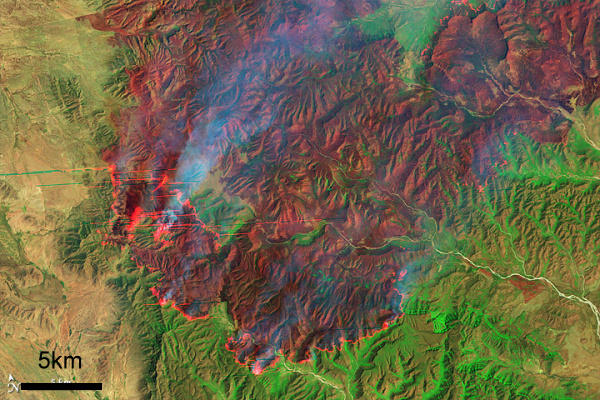
Coahuila wildfire, April 9, 2011 (Earth Observatory, Landsat-5)

Coahuila wildfire, April 9, 2011 (Earth Observatory, Landsat-5)

During the first half of 2011, serious wildfires devastated several areas of northern Mexico, with the states of Coahuila and Nuevo León being hardest hit. Other states badly affected included Durango, Chihuahua, Quintana Roo, Oaxaca, Puebla and Guerrero. More than 7,800 fires occurred, severely damaging a total area of 4100 square kilometers. 30 of Mexico’s 32 states were affected; only Tabasco and Baja California Sur escaped unscathed.

Conafor’s annual fire-fighting budget for the entire country is only 650 million pesos ($50 million dollars); the average annual area damaged by wildfires is only 2600 square kilometers, of which 500 square kilometers are forest. At the height of the 2011 fire season, more than 60 new fires were being reported each day, according to Conafor.

Coahuila

In the state of Coahuila, fires damaged 250 square kilometers in four weeks. It is believed that 50% of these fires were due to farmers losing control of deliberate burns. Farmers are supposed to have an adequate fire-suppression plan in place before setting a deliberate burn, but in practice this requirement is not enforced.

The main locations were La Sabina and El Bonito. Authorities were very slow to respond. Diana Doan-Crider, a wildlife biologist at Texas A&M University, has spent the past 25 years studying the Mexican black bear in the Serranía del Burro in Coahuila, an ecological corridor that runs parallel to the Eastern Sierra Madre. The area includes a large population of Mexican black bears. Doan-Crider claims that authorities completely ignored the first warnings and that their eventual response (two weeks after the first fires started) lacked adequate coordination. Many mother bears and their young cubs perished in the fires.

Firefighters in Coahuila had to cope with a spectacular but terrifying fire whorl or fire tornado

Nuevo León

In the neighboring state of Nuevo León, large swathes of ranching land were ravaged by fire. One rancher who lost more than 10,000 ha of cattleland was equally critical of the slow response time of firefighters who took more than two weeks to appear on the scene, by which time the fires had taken hold.

David Garza Lagüera had converted his 14,000 ha ranch into the Cumbres de Monterrey National Park, one of the key areas of bear habitat. The largest pines on his land were more than 150 years old. All were totally destroyed.

The worst damage was in Galeana, Montemorelos, Zaragoza, Aramberri and Mina. The area burned in Nuevo León in May 2011 was almost ten times the total area affected in the state for the whole of 2010.

Why was the 2011 fire season so bad?

To quote the Earth Observatory, “Lack of winter rain and frost left the plants dry and prone to fire. On top of that, the area has not burned for more than 20 years, during which time fuel built up. Thunderstorms and steady strong winds with gusts up to 110 km/h (70 mph) completed the formula for a dangerous, fast-moving wildfire.”

Ironically, the passage of Hurricane Alex in July 2010, which brought 1500 mm (60″) of rain to the Serranía del Burro, actually worsened the fire damage the following year. The rain from Hurricane Alex encouraged so much new growth in the final months of the rainy season that when it died back in the dry season, there was far more fuel available than usual for any wildfire that was sparked.

By the time the federal government declared a state of emergency, it was too late; the fires had already destroyed large areas of grassland, scrubland and forest. The emergency response when it finally arrived included help from the USA and Canada such as the specialist aerial Mars water-bombers stationed on Vancouver Island. The fires were only fully extinguished once the annual rainy season arrived.

As we now know, the disastrous fires of April-May 2011 were an early sign of Mexico’s worst drought for 70 years:

How sustainable is organic agriculture on the Baja California Peninsula in Mexico?

 Mexico's geography in the Press, Updates to Geo-Mexico  Comments Off on How sustainable is organic agriculture on the Baja California Peninsula in Mexico?
Jan 192012
 

In recent years, a farming boom has completely changed the landscape in parts of Mexico’s Baja California Peninsula. The new landscape is comprised of organic farms, specializing in growing fresh produce, especially out-of-season, certified organic, fruits and vegetables, which carry premium prices.

“Organic” has come to mean very different things in different countries, but the essential common element is that it uses no synthetic fertilizers, hormones or pesticides. In the USA, the term “organic produce” also requires that farmers protect water resources, though this is hard to define and at least as hard to enforce.

The Baja California Peninsula receives very little rainfall, so irrigation water for its organic farms comes from underground aquifers. The profitability of these new farms relies on the availability of irrigation water and on the proximity of the region to the lucrative US market for organic produce.

The new farms may be “organic”, but the bigger question, examined by Elisabeth Rosenthal in Organic Agriculture May Be Outgrowing Its Ideals, in the New York Times is, “Are these organic farms sustainable?” Rosenthal looks in some detail at whether or not organic farms protect the local environment and the livelihood of local farmers. The article discusses the extreme stress being placed on the area’s ground water reserves. Some farmers are already in trouble because their wells have dried up. More than one-third of aquifers in the southern part of the peninsula are officially classified as “over-exploited”.

Growers blame the area’s tourism industry for the water shortages, arguing that hotels and golf courses gobble up far more than their fair share of the precious resource. Despite the aridity of the southern section of Baja California Peninsula, the southern coast, centered on Los Cabos, has far more golf courses per unit area than anywhere else in the country.

The “organic” label also takes no account of the emissions involved in production and transport of fruits and vegetables to the marketplace; export-oriented horticulture in the Baja Peninsula is an energy-intensive enterprise. Adding to the unsustainable side of the argument, some of the organic farms practice “monoculture”, growing a single crop year after year on the same land, a system known to lead to soil depletion and increase the risk of pest-related problems.

On the other hand, the new farms also provide an alternative source of jobs to tourism. Del Cabo, which has a cooperative packing plant in San José del Cabo and trucks or flies more than 7 metric tons of produce to the USA every day, is able to help its members by supplying high-quality seed, and employing specialists in plant raising and plant diseases who act as consultants to individual farmers as required. Del Cabo criticized the New York Times story for its numerous inaccuracies regarding water usage and sustainability.

Conscious of the water issues, many of these modern organic farms employ sophisticated, water-conserving irrigation systems, such as computerized drip irrigation. They also grow many crops under shade. Such systems are expensive to install and maintain, so most of the bigger producers are US-owned companies.

In Organic Tomatoes in January: Sucking Mexico Dry, in Mother Jones, Tom Philpott compares the situation in Baja California with that in “another region famous for winter tomatoes and dirt-cheap labor costs: Immokalee, Florida, source of a huge percentage of non-organic winter tomatoes consumed in the United States.” Philpott concludes that “What’s going on in Baja seems more about generating a premium-priced product while systematically degrading a landscape. Want organic tomatoes in the cold months? Buy them in a can.”

Food for thought!

Related posts:


The urgent need for reforestation of hills near Mexico City

 Mexico's geography in the Press  Comments Off on The urgent need for reforestation of hills near Mexico City
Jan 172012
 

A coniferous tree plantation is being formed on the lower slopes of Ajusco, the 3,930 m (12,894 ft) volcanic peak that overlooks the southern part of Mexico City. After decades of uncontrolled land clearance, local farmers are replanting 800,000 trees as part of a sustainable project which will ensure them a reliable income for years to come. Mexico’s National Forest Commission estimates that mature coniferous plantations are highly profitable, and should repay farmers a 500% return on their investment. Individual trees have to be at least 8 years old before they can be harvested.

Three species of conifers are being planted: the Sacred Fir (oyamel), Douglas Fir and Mexican White Pine (ayacahuite). At present, only about one-third of Christmas trees sold in Mexico are natural trees, with 60% of these having to be imported from as far away as Canada.

The project will not only increase farmers’ incomes, it will also reduce soil erosion, increase carbon storage, and bring hydrological benefits. Mexico City has seriously depleted its aquifers – see Why are some parts of Mexico City sinking into the old lakebed? Reforesting the hills surrounding the city means more water will be retained in the soil, and less will runoff into the city’s already-stressed network of storm drains.

Ajusco is not the only volcanic peak near Mexico City where deforestation has become a major issue. In August 2011, National Water Commission (Conagua) officials blamed serious flooding in the Rayón municipality of the State of México on the uncontrolled logging of the lower slopes of the Nevada de Toluca volcano.

The lack of protective forest cover meant that heavy rain caused the River Santiaguito to burst its banks and flood homes in the community of San Juan La Isla. The situation would have been far worse if Conagua had not ordered the dredging of 12,000 cubic meters along a 4 km stretch of the river bed in 2009. Following the 2011 floods, Conagua reiterated the need for more reforestation and called for stricter land use controls to prevent similar problems in the future.


How accurate was last year’s hurricane prediction?

 Other  Comments Off on How accurate was last year’s hurricane prediction?
Jan 162012
 

The annual prediction of the hurricane activity on the Atlantic/Gulf/Caribbean side of Mexico for 2011 by Dr Philip Klotzbach and Dr. William Gray (Colorado State University) was for a slightly more active season than in 2010. For 2011, they introduced some modifications to their predictive model, which now takes into account:

  • Predictor 1. Gradient of sea surface temperatures (SST) in February-March between the Eastern Subtropical region of the Atlantic and the South Atlantic. This has a positive connection with hurricane activity.
  • Predictor 2. Air pressure at sea level in March in the Subtropical Atlantic. This has a negative connection with hurricane activity.
  • Predictor 3. Air pressure at sea level in February in the South-Eastern Pacific. This new variable has a positive connection with hurricane activity.
  • Predictor 4. Forecast made in March from Central Europe for sea surface temperatures in September for the El Niño-3 region. This new predictor has a negative connection with hurricane activity.
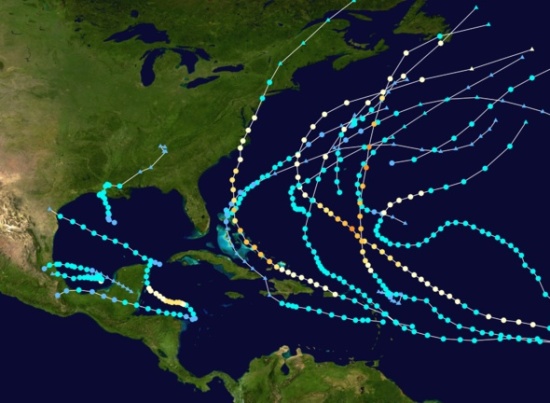
Tracks of Atlantic Hurricanes, 2011

Tracks of Atlantic Hurricanes, 2011

In April, the prediction for the 2011 Atlantic/Caribbean hurricane season was for 16 tropical cyclones, including 7 tropical storms, 4 moderate hurricanes (Category 1 or 2 on the Saffir-Simpson scale) and 5 strong hurricanes (C 3, 4 or 5).

This prediction proved to be quite good. In the event, there were actually 19 tropical cyclones, including 12 tropical storms, 4 moderate hurricanes (C1, C2) and 3 strong hurricanes (one C3 and two C4).

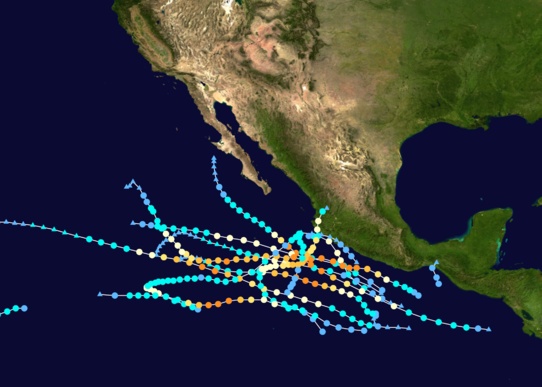
Tracks of Pacific Hurricanes, 2011

Tracks of Pacific Hurricanes, 2011

On the Pacific coast, the 2011 season saw 11 tropical cyclones including 1 tropical storm, 4 moderate hurricanes and 6 strong hurricanes. Fortunately, almost all these cyclones remained out at sea and only Hurricane Jova, which reached category 3 in early October, caused any significant damage on land (see Hurricane Jova smashes into Barra de Navidad and Melaque on Mexico’s Pacific Coast).

Want to read more?

Related posts:

Four new municipalities change the map of Chiapas

 Other  Comments Off on Four new municipalities change the map of Chiapas
Jan 142012
 

The Chiapas state government has redrawn the map of its municipal boundaries to create four new municipalities (municipios), bringing the number in the state to 122. The four new municipalities are:

1. Belisario Domínguez (formerly part of the municipality of Cintalapa de Figueroa). The new municipio aims to resolve a long-standing agrarian conflict over land and forest rights with San Miguel Chimalapa and Santa María Chimalapa, both in neighboring Oaxaca. The municipal seat of the new municipality is Rodulfo Figueroa. The municipality also includes the settlements of Gustavo Díaz Ordaz, La Hondonada, San Marcos, Montebello and Flor de Chiapas.

2. Emiliano Zapata is the new municipality responsible for the 20 de Noviembre ejido, formerly part of the Villa de Acala municipality.

3. El Parral, previously the largest settlement in Chiapas that was not a municipal seat, now becomes the municipal seat for the El Parral ejido, formerly part of the Villacorzo municipality.

4. Mezcalapa is a new municipality which serves the settlement of Raudales Malpaso, cut off decades ago from its former municipal seat of Tecpatán by the construction of a reservoir.

The total number of municipalities (municipios) in Mexico is currently 2,458. Note that this figure includes the 16 delegaciones (boroughs) of Mexico City which, while technically not municipalities, do have significant autonomy.

Jan 122012
 

The Mexican Attorney General’s Office has released data for narco-related homicides for the first nine months of 2011. The data show that 12,903 narco-related deaths occurred in that period. The 2011 figure is 11% higher than the number of narco-related deaths reported for the same nine months in 2010. Even in the absence of data for the last quarter of 2011, we can safely assume that the total number of drug-related deaths in Mexico since the start of the “drug war” in December 2006 now exceeds 50,000.

As we have stressed in previous posts about drug-related violence in Mexico, the data for January-September 2011 show that violence is heavily concentrated in certain parts of the country, with other regions (such as Baja California Sur, Oaxaca and the Yucatán Peninsula including Quintana Roo) remaining untouched.

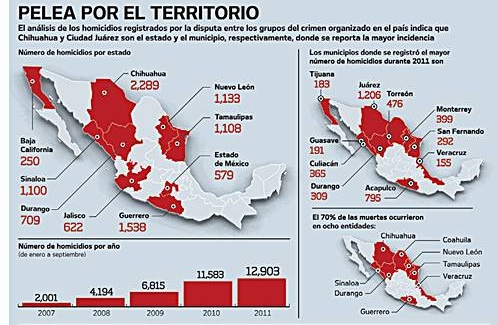
Narco-violence, January-September 2011

Narco-violence, January-September 2011 (El Universal)

As this graphic (original here) from Mexico daily El Universal shows, eight states (out of 32) accounted for 70% of all the homicides in the first nine months of 2011: Chihuahua, Guerrero, Nuevo León, Tamaulipas, Durango, Jalisco, State of México, Coahuila.

The ten municipalities with the highest number of homicides were Ciudad Juárez, Acapulco, Torreón, Monterrey, Culiacán, San Fernando, Durango, Mazatlán, Tijuana and Veracruz.
[* see comment below]

In all cases, it should be remembered that the data are for the total number of homicides and are not homicide rates (i.e. data adjusted for population size).

Why do Mexican seasonal farmworkers in Leamington, Ontario, have their own consulate?

 Other  Comments Off on Why do Mexican seasonal farmworkers in Leamington, Ontario, have their own consulate?
Jan 122012
 

The list of Mexican consulates in Canada on the website of the Mexican Embassy in Ottawa includes one massive surprise. In addition to consulates in such obvious locations as Toronto, Vancouver, Montreal and Calgary, it also includes one in the small city of Leamington in Ontario, designated to provide service to Essex County (South).

Just why is there a Mexican consulate in a city of only 31,000 people?

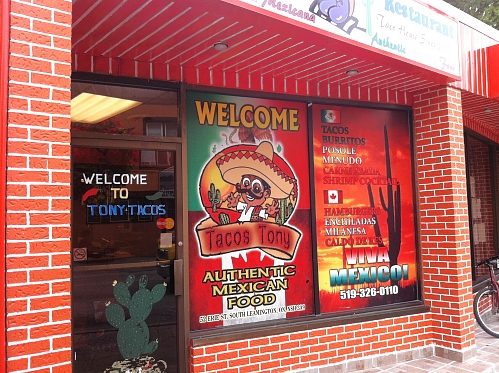
Tacos Tony. Photo Steve Cylka

Tacos Tony. Photo Steve Cylka (www.theblackpeppercorn.com)

Leamington, established in 1890, is a small city (population 31,000) 50 km southeast of Windsor, on the shores of Lake Erie, near Point Pelee, Canada’s southernmost point. The city is a mix of different ethnic groups. From the 1920s to the 1940s, it attracted waves of German-speaking immigrants from Europe, including some German-speaking Mennonites from Russia, as well as Italians and Portuguese. In the 1950s, it became home to returning Mennonites from Mexico, whose families had lived in Canada prior to the 1920s when they had relocated to Mexico. The city reflects its ethnic diversity, with German bakeries, an Italian fountain, Tony’s Mexican tacos, and a Lebanese Club.

For the fascinating perspectives of two generations in a single family on (im)migration, settlement, and home-making in a small city in Ontario with close ties to Mexico, see Leamington, Ontario: Bloom or Bust by Tonya Davidson and Katherine Davidson.

Leamington is home to H.J. Heinz’s second largest plant in the world. The city is Canada’s greenhouse capital, with 485 ha (1200 acres) of greenhouses which yield 500 million tomatoes a year and provide several thousand jobs, many of them seasonal. Since 1974, as many as 4000 Mexican farm laborers come to Leamington for up to eight months each year to harvest the tomatoes. They are not the latest wave of permanent migrants but belong to the Seasonal Agricultural Workers’ Program. To qualify for the program workers have to be male, married, with limited education and strong family ties back home in Mexico. When seasonal work ends, they have to return home.

Their life in Canada, a mixture of opportunity and exploitation, was the subject of El Contrato: The Contract, Min Sook Lee’s 2003 National Film Board of Canada movie. El Contrato looks in detail at the lives of two migrant workers: father-of-four Teodoro Bello Martinez and “M” who wears a mask in the movie to disguise his  identity.

At the time the film was made, Mexican farm workers worked “seven days a week, ten hours a day for a flat rate of $7.25 per hour, no overtime, no holidays”. A quarter of their salary is deducted for taxes, employment insurance, board and transportation, but anyone who gets sick or challenges their employer is sent back to Mexico. In the words of one of the workers in the film, “Slavery has not disappeared.” This hard-hitting film (dialogue in Spanish, with English commentary and subtitles) is a very valuable starting point for discussions about globalization, migration and many other aspects of geography.

Since the movie, several things have changed. The Mexican consulate in Leamington was opened in 2005,  in response to the inability of the Mexican consulate in Toronto to keep up with the need to provide consular services to migrant workers in Leamington. The migrant workers are also now supported by several migrant agricultural support centers, including one in Leamington established by Canada’s United Food and Commercial Workers Union.

Jan 092012
 

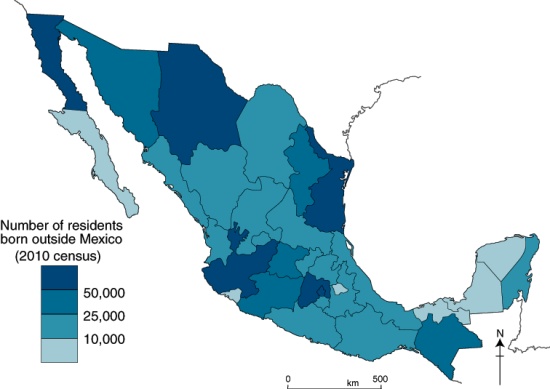
Mexico’s 2010 census found that 961,121 individuals living in Mexico had been born outside the country. In 2000 there were only about half as many (492,617). The 2010 figure is less than 1% of Mexico’s total population of 112 million. (Compare Canada where 21% are foreign-born and USA where 13% are foreign born). Of the total number of foreign-born residents in Mexico, 76.6% were born in the USA. Sadly, INEGI has not released any information relating to the country of birth of current residents who were born in countries other than the USA.

The map below shows the total number of foreign-born residents for each state.

Map of foreign-born residents of Mexico in 2010

Foreign-born residents of Mexico in 2010. Credit: Tony Burton/Geo-Mexico.

As can be seen on the map, the states with most foreigners are Baja California (about 123,000), Jalisco (84,000), Chihuahua (80,000), the Federal District (72,000) and Tamaulipas. The two states with fewest are Tlaxcala and Tabasco. (These are absolute numbers, and are heavily influenced by the relative size of each state).

Which states experienced the largest increases in foreigners between 2000 and 2010? The number of foreigners grew fastest in those states with relatively few foreigners in 2000, namely Hidalgo (up 402% over the decade), Tlaxcala (333%), Tabasco (281%), and Veracruz and Oaxaca (both with 272%).

Related posts:

How might the USA adjust to “narco-refugees” from Mexico?

 Books and resources  Comments Off on How might the USA adjust to “narco-refugees” from Mexico?
Jan 072012
 

The impacts of Mexico’s “War on Drugs” in recent years have been apparent in many parts of the country, particularly in the Mexico-USA border region. Apart from the obvious and well-documented increased levels of violence in several northern border states, we have looked briefly in a previous post at how some businesses closed their factories or offices in northern Mexico and relocated to the relative safety of Mexico City and central Mexico. Individuals living in the areas where drug-related violence has increased have also had tough choices to make, and many families have chosen to move, either to other areas of Mexico or to the USA or Canada.

Canada recorded a sharp spike in the number of Mexicans entering the country and claiming asylum on the grounds that their lives were in danger if they returned to Mexico. The number rose from 2,550 in 2005 to 9,309 in 2009, with about 10% being accepted as legitimate claims. Canada’s response to the sudden increase in applicants was to impose strict visa restrictions which made it far harder for Mexicans to enter Canada legally. The changes led to an 80% drop in the number of Mexicans applying for asylum in 2010.

Several US border cities have also experienced an influx of Mexican migrants. In Mexico’s “Narco-Refugees”: The Looming Challenge for U.S. National Security, Dr. Paul Kan, Associate Professor of National Security Studies and the holder of the Henry L. Stimson Chair of Military Studies at the U.S. Army War College, looks at how Mexican “narco-refugees” (who leave Mexico “unwillingly”) could influence US policymakers and force them to reconsider national security priorities.

Dr. Kan considers three alternative scenarios, which, he argues, “would force the narco-refugee issue onto the [US] national policy-making agenda”:

  • 1. the “new normal”, in which drug-related violence in the USA and Mexico becomes “a fact of life in relations between the two countries”, as drug gang and cartel activities spread into the USA along the corridors used to transport drugs.
  • 2. an “accidental narco” syndrome developing in Mexico, in which the Mexican government, in order to demonstrate its commitment towards lowering cartel violence,  may collude with one or more smaller cartels to help gain intelligence about the larger, more violent cartels prior to clamping down on them. Such a policy could lead to a sharp increase in the number of narco-refugees, as the core areas of stronger cartels see increasing violence as the cartels fight for survival.
  • 3. the emergence of a “Zeta state.” In this third scenario, a kind of “parallel state” emerges, in which private security firms play a much larger part as wealthy Mexicans seek to protect themselves, relying on their own resources, rather than on the government’s law and order or security forces.

As Dr. Kan emphasizes, these three scenarios are not mutually exclusive, and could coexist in different areas of the country simultaneously. Equally, some parts of the country might escape the effects of all three of the scenarios he analyzes.

Kan repeats anecdotal and other evidence which suggests that “narco-refugees” are becoming an important trend, with serious consequences for Mexico’s economy. For example, “One young Mexican executive at cement giant Cemex SAB, which has headquarters in Monterrey, said he can count at least 20 different families from his circle of friends who have left—nearly all of them for nearby Texas.” Reduced US investment in Mexico is not a good sign. According to the US Chamber of Commerce in Mexico, 25% of its members are “reconsidering their investments in Mexico as a result of worries over security”, with 16% having suffered extortion and 13% having experienced kidnappings. According to J.P. Morgan’s chief economist for Mexico, “the country likely lost approximately $4 billion in investment in 2010 when companies reconsidered such plans because of drug violence.”

At a more local level, in Ciudad Juárez, “more than 2,500 small grocery stores have closed due to extortion or because customers have left the city; the Mexican social security administration believes that 75,000 residents there have lost their jobs since 2007.”

Clearly, the impacts of Mexico’s “war on drugs” are far-reaching. Let’s hope that the situation improves in 2012, despite it being a year of federal elections in both Mexico and the USA.

Previous posts about the geography of drug trafficking and drug cartels in Mexico:

Mexico’s Puente Baluarte, the world’s tallest cable-stayed bridge, now officially open

 Mexico's geography in the Press, Updates to Geo-Mexico  Comments Off on Mexico’s Puente Baluarte, the world’s tallest cable-stayed bridge, now officially open
Jan 052012
 

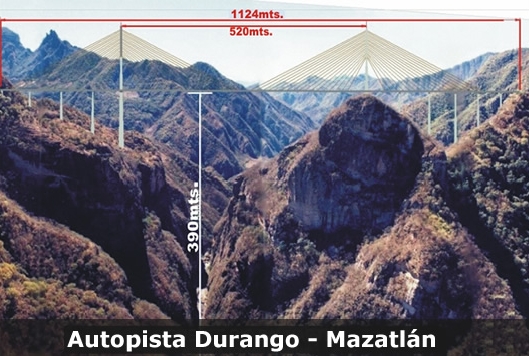
Earlier today, President Felipe Calderón inaugurated the Puente Balarde, the world’s tallest cable-stayed bridge.

The bridge is 1.124 km long and wide enough for 4 lanes of traffic. Its central span extends 520 meters. At its highest point, it is a gravity-defying 403 metres (1322 feet) above the River Baluarte from which it takes its name. The bridge’s largest supporting pillar is 153 meters high, with a base measuring 18 meters by 30 meters.

Puente Baluarte Bicentenario. Photo: TRADECO

Construction, by Mexican firm TRADECO, has required 103,000 tons of cement and almost 17,000 tons of steel. The bridge joins the states of Durango and Sinaloa and removes the need for drivers to negotiate a very dangerous stretch of highway known as the Devil’s Backbone.

It is the centerpiece of a new highway between Durango and the Pacific coast resort of Mazatlán. The 312 km drive between the two cities, which took about five hours prior to the completion of the bridge, will now be dramatically shortened.

“This project will unite the people of northern Mexico as never before,” President Calderón said at the inauguration ceremony. Accordoing to the BBC, officials from the Guinness World of Records were on hand to present him with an award recognising the engineering feat. The previous record holder was the elegant Millau Viaduct in France.

Travel Note:

Even though the bridge has been inaugurated, the new Durango-Mazatlán highway is still many months from completion.

Update: New Durango-Mazatlán highway officially open(Oct 2013)

Related posts:


Do paved roads lead to development?

 Excerpts from Geo-Mexico, Updates to Geo-Mexico  Comments Off on Do paved roads lead to development?
Jan 042012
 

In chapter 24 of Geo-Mexico, we described a typology of rural settlement locations and wrote that “rural localities near roads” (defined as those settlements within 3 km (2 mi) of a paved road) are an important category since they house 54% of all Mexico’s rural population. In fact, such settlements account for almost 90% of rural population in Quintana Roo and over 70% of the rural population in the states of Zacatecas, Yucatán, Campeche, San Luis Potosí, Nuevo León and Coahuila.

We explained that while “One of us believes that the location of paved roads is having an impact on rural settlement patterns, the other believes that rural settlement patterns are having an impact on the location of paved roads! Both viewpoints may be correct with their relative importance depending on the region in question.”

Shortly after the publication of Geo-Mexico, a loyal reader (“Jerezano“) wrote to us, agreeing with us, and sharing his personal insights into “rural localities near roads” based on his 23+ years living in the beautiful, small town of Jerez, in the state of Zacatecas. He writes,

“You are both correct, of course.”

“The rural settlement was in most cases located where it was long before the roads were paved. A municipality (municipio), when it decides to pave a road, considers many things:

  • a) Where does the money come from? Local residents, associations of residents in foreign countries who send money back for improvements? and municipal and federal matching funds?
  • b) Existing population figures which of course influence the traffic on the roads.
  • c) Economic contribution of that rural community to the welfare of the state and municipality.”

“So, a rural community with a fairly large population, a robust economy, and an active out-of-town group of supporters, will get a paved access road long before a different community which lacks those attributes. That is easily observable in almost any location.”

“But, once that access road has been paved, the influence is also usually observable by the improved economy of that community. Easy access of products to markets, easy access of potential new residents to the city, etc. will stimulate increases in costs of real estate, living, etc.”

“Here in Zacatecas, for example, the paving of the road to Susticacán from the Jerez-Guadalajara highway stimulated a building boom which is still in progress. The construction of the new 4- lane divided highway from Zacatecas City to Concepción de Oro, and now underway from Concepción de Oro to the Coahuila border, has created an extremely active trailer stop at the Villa de Cos intersection. Before the new highway was started, that intersection was a place with potential and people who had constructed facilities such as restaurants, hotels and a gasoline station were waiting with baited breath.”

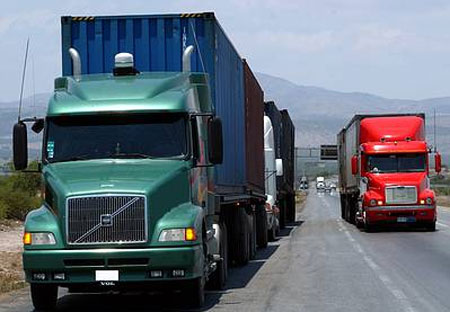
Mexican trucks“They are now reaping the benefits of the movement of many, many tractor-trailers from the Ramos Arizpe to San Luis Potosí highway and on to Mexico over to the new Ramos Arizpe to Zacatecas to Mexico highway. At the Villa de Cos intersection where, in the past, you would see pickups, quarter ton, 3/4 ton and a maximum of 4 to 10 ton trucks, you can now see as many as 10 to 20 semi-trailers and doble-remolques (double drop trailers) parked in front of the main restaurant and hotel. All this because the road has been steadily improved over the years from a narrow, two lane Federal highway, with a bad surface most of the distance, to the modern 4 lane divided highway easily transited by rigs which (God forbid) are really too big to be on the highways.”

We sincerely thank Jerezano for taking the time to share these valuable personal insights into rural roads in his “neck of the woods” in Zacatecas, and hope that the New Year brings him and all our readers Health, Happiness and Prosperity.

The geography of the 2011 Pan American Games (Juegos Panamericanos)

 Mexico's geography in the Press  Comments Off on The geography of the 2011 Pan American Games (Juegos Panamericanos)
Jan 022012
 

The XVI Pan American Games were held from October 14–30, 2011 in Guadalajara (Jalisco) with some events held in outlying locations such as Ciudad Guzmán, Puerto Vallarta, Lagos de Moreno and Tapalpa. They were the largest multi-sport event of 2011. Some 6,000 athletes from 42 nations participated in 36 sports. The largest contingents of athletes (more than 500 in each case) came from host nation Mexico, Brazil, Argentina, the USA, Cuba and Canada.

Guadalajara is Mexico’s second city, a metropolitan area of almost five million people, the industrial and commercial hub of a region that is considered quintessentially Mexican, home to charrería (Mexican horsemanship), jarabe tapatío (Mexican hat dance), mariachi music, and tequila, the national drink.

This post looks at the impacts of the Pan American Games on the local economy.

How much investment was required to host the games?

The original budget for the Games was $250 million (dollars), but this ballooned to about one billion by the time of the Opening Ceremony. The security budget was $10 million, to pay 10,000 municipal, state and federal police, as well as elements from the Mexican army and navy, to patrol the streets surrounding the venues during the games.

How many visitors attended the Games?

The State Tourism Secretariat expected 800,000 visitors and spending of $75 million (dollars). Some government spokespersons claimed that between 1 and 1.5 million attended the games. However, a study released by the Guadalajara Chamber of Commerce found that 454,148 visitors came to Guadalajara during the games (305,177 from the state of Jalisco, and 148,971 from elsewhere). 83% (424,354) of visitors came “specifically for the Games”.

How many jobs were created?

The build-up to the games created some 50,000 new jobs. In addition, more than 6,000 volunteers, mainly students, were employed during the games.

How much were the media and TV rights worth?

1,300 media representatives attended the games. More than 750 television hours of sports were broadcast, with global digital media company Terra broadcasting the games live in 13 simultaneous high-definition online channels. The TV rights were worth $50 million.

How many sports venues were used?

There were 32 different venues used during the games. Billions of pesos were spent building 19 impressive new sports stadiums and complexes. Thirteen existing sports arenas in the Guadalajara metro area were rebuilt or extensively refurbished. The opening and closing ceremonies for the Pan American Games were held in a 48,000-seat local soccer stadium, the Omnilife Stadium (Estadio Omnilife), built in 2010 for the Guadalajara “Chivas” soccer team.

Facilities built specifically for the games included an iconic Aquatics Center (Centro Acuático), sponsored by Scotiabank, with two Olympic-size pools and seating up to 3,500 spectators, and a state-of-the-art gymnastics venue, sponsored by Nissan.
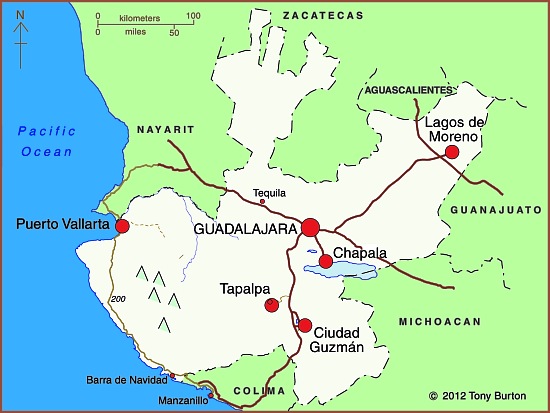
2011 Pan American games venues in Jalisco, Mexico

2011 Pan American games venues in Jalisco, Mexico

How did the games help regional development?

Several sports events were held at sites well away from the Guadalajara metro area. This helped promote a regional profile for the games. The five locations involved (see map) were:

  • Puerto Vallarta (beach volleyball, open water swimming, triathlon, sailing)
  • Lagos de Moreno (baseball)
  • Ciudad Guzmán (rowing, canoeing)
  • Chapala (water skiing)
  • Tapalpa (mountain biking)

How much did visitors to the games spend?

Local businesses reported sales up 7% during the period of the Games. The total games-related spending by visitors was estimated at $210 million (dollars). Hotel occupancy rates for the period of the games rose from 58.3% in 2010 to 76.4% during the games. The rate was 97% for the 5-star hotels in Guadalajara and Puerto Vallarta.

Even so, according to a local newspaper (The Guadalajara Reporter), local business owners were “underwhelmed” by the Pan American Games’ impact. Restaurants, bars, clubs, taxis and travel agencies all received fewer customers than anticipated. Local business owners said that “very few foreign tourists came for the games, while most spectators at the events were local citizens, athletes and their families, journalists and other games-affiliated personnel.” Business owners in Puerto Vallarta were reported to be “angry at the lack of publicity for the destination”.

Problems with the Athletes Village

The Pan American Athletes Village (Villa Panamericana) was built one kilometer outside Guadalajara’s western ring-road (Periférico) to house all 6,000 participants. The location is conveniently close to the Omnilife Stadium, site of the opening and closing ceremonies.

The Athletes Village has three-bedroom apartments, a central plaza, restaurant, gym, discotheque, chapel, swimming pool, theater and health clinic. The original plan was for the Village apartments to be sold after the Games for between $90,000 and $250,000 (dollars) each. However, the fate of the Athletes Village is still uncertain, because residents of the nearby (and long-established) Rancho Contento subdivision have taken the owners to court,  demanding that the Athletes Village be demolished since it has already caused irreparable damage to the local ecosystem.

Apart from some issues of housing density in this area, the main concern is that the village has inadequate provision for sewage. After the Games ended, local newspapers reported that faulty treatment plants had resulted in sewage being pumped out of the village on to land inside the nearby Primavera Forest biosphere reserve. Apparently, two of the Village’s treatment plants “collapsed” under the volume of wastewater generated, and partially-treated sewage had collected as open ponds. It is unclear if the sewage contaminated local subsoil and streams. After the Games, city officials closed the plants and fined the Athletes Village administrators. The administrators claim that the plants and Village had been designed to accommodate only 2500 to 3000 athletes, not the 6000 participants that were later housed there.

Conclusion

The lasting legacy of the games is a number of new hotels in Guadalajara, including hotels in the Westin and Riu chains, and a number of new or upgraded sports venues. In addition, many roads were repaved and numerous other beautification projects have helped improve Guadalajara’s urban fabric and infrastructure. The city’s main exhibition space (Expo Guadalajara) and the international airport have both been expanded.

The first obvious benefit of these improvements has been that the city (and its new Aquatics Center) have been chosen to host the 2017 World Swimming Championships.

Related posts: