The 10 coolest states in Mexico

 Maps, Teaching ideas  Comments Off on The 10 coolest states in Mexico
Jul 262010
 

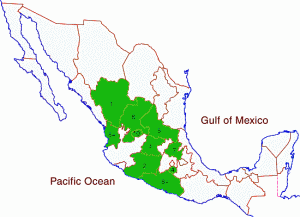
The table shows the ten coolest states in Mexico, defined by their average annual temperature.

RankStateAverage annual temperature (degrees C)
1Tlaxcala14.1
2=Estado de México15.2
2=Federal District15.2
4Chihuahua16.6
5=Zacatecas17.2
5=Aguascalientes17.2
7Hidalgo17.4
8Durango17.7
9Guanajuato17.9
10Baja California18.5
Map of the coolest states in Mexico

The coolest states in Mexico. Click to enlarge. All rights reserved.

In both Canada and the USA, average temperatures tend to depend largely on latitude, ie. they decrease towards the north of the country. This is clearly not the case in Mexico.

(a) What factors apart from latitude influence the average temperatures in Mexico’s states? Try to find evidence that either supports (or refutes) your ideas.

(b) Is there any connection between average temperature and precipitation amounts? Compare this map of states which are relatively cool with the states which have

(c) Can you guess where the warmest states in Mexico will be? To find out if you are right, you can find an atlas or on-line map showing average temperatures in Mexico, or keep reading the Geo-Mexico blog each day until we include our own map showing the warmest states!

Mexico’s diverse climates are the subject of chapter 4 of Geo-Mexico: the geography and dynamics of modern Mexico. Climate-related hazards are analyzed in chapters 6 and 7. Buy your copy today!

The 10 states in Mexico with the highest percentage of homes receiving remittances

 Maps, Teaching ideas  Comments Off on The 10 states in Mexico with the highest percentage of homes receiving remittances
Jul 212010
 

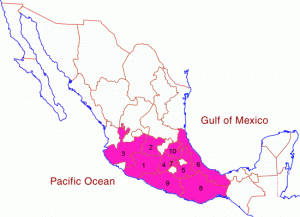
The table and map show the ten states which have the highest percentage of homes receiving remittances. (Data for 2005)

RankState% of homes that receive remittances, 2005
1Zacatecas12.2
2Michoacán10.4
3Guanajuato9.6
4Morelos7.5
5San Luis Potosí7.4
6Durango7.3
7Hidalgo7.1
8=Guerrero6.8
8=Nuevo León6.8
10Aguascalientes6.7
States where a high % of households receive remittances

States where a high % of households receive remittances. Click to enlarge. All rights reserved.

These data portray where remittances are most critical in terms of maintaining household finances. If a high percentage of homes in a state receive remittances, that suggests that people living in the state are likely to be quite dependent on remittances.

The local economy in many towns and villages in these states may be significantly boosted by incoming remittances. These places are likely to suffer most in times of economic down-turn when the US economy is suffering, employment is harder to find, and when fewer remittance payments are sent back home.

(a) What do the 10 states where a high percentage of homes receive remittances have in common?

(b) What factors might help explain why lots of households in some states receive remittances, but only very few households in other states?

(c) Explain what is meant in geography or economics by a “multiplier effect”.

(d) Suggest which sectors of the economy would be most likely to benefit from incoming remittance payments. Try to find evidence to support (or refute) your ideas.

“Migration to the USA” is the title of chapter 26 of Geo-Mexico: the geography and dynamics of modern Mexico. This chapter provides a good introduction to the geography, history and impacts of migration and remittances. Buy your copy today!
The 10 states in Mexico receiving the most remittances in total

 Maps, Teaching ideas  Comments Off on The 10 states in Mexico receiving the most remittances in total
Jul 162010
 

The table shows the 10 states which receive the highest total remittances.

RankStateRemittances ($ millions), 2005
1Michoacán2,595
2Guanajuato1,715
3Jalisco1,693
4State of México1,675
5Puebla1,174
6Veracruz1,155
7Federal District1,452
8Oaxaca1,002
9Guerrero957
10Hidalgo718
States receiving the most remittances (highest value)

States receiving the most remittances (highest value). Click to enlarge. All rights reserved.

The data show very clearly that all the states receiving high total amounts of remittances are in the southern half of Mexico.

(a) What factors might explain this pattern?

(b) Compare this map with a map of the states with highest per person remittances. Why are some states only shown on one of the maps, and not on the other?

(c) Find a table showing the total population of each state in Mexico. To what extent do the total population figures for each state help to explain whether or not they are in the top 10 states for receiving remittances?

“Migration to the USA” is the title of chapter 26 of Geo-Mexico: the geography and dynamics of modern Mexico. This chapter provides a good introduction to the geography, history and impacts of migration and remittances. Buy your copy today!
Jul 122010
 

The map shows the ten states which receive the highest remittances (funds sent home, primarily from the USA, by Mexican migrant workers) on a per person basis in 2005.

Map of states receiving most remittances per person

The states receiving most remittances per person, Click to enlarge. All rights reserved.

Many factors help to explain why some states receive high amounts of remittances, on a per person basis, while other states receive much less.

They include:

  • the number of migrant workers from that state working in USA
  • the poverty levels in the state
  • unemployment rates in the state
  • whether or not that state has a long history of supplying migrant workers

Perhaps surprisingly, there is no correlation between distance from the USA and the per person remittances sent back by migrant workers. On the contrary, it is clear that more remittances are received per person in several southern states. No northern border state is in the top 10 receiving states for remittances.

Why might this be? Perhaps workers from states nearer to the border return funds by non-official channels, such as with friends or relatives returning home. Perhaps life is so good in the northern states that fewer workers migrate.

(a) What other factors can you think of which might be relevant?

(b) Try to find data to help support (or refute) your ideas.

“Migration to the USA” is the title of chapter 26 of Geo-Mexico: the geography and dynamics of modern Mexico. This chapter provides a good introduction to the geography, history and impacts of migration and remittances. Buy your copy today!
Jun 282010
 

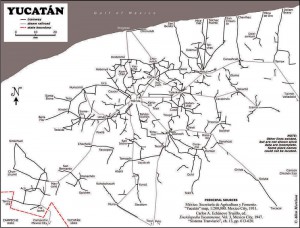
About 1900 one of the densest railroad networks on earth was operating in the Yucatán Peninsula. Between 1870 and 1920 the area experienced an economic boom based on the production of twine from sisal (oro verde or green gold). The numerous plantations in the area needed a way to move the sisal from the fields to processing centers and from there to ports for export. The plantation owners built a very extensive (4500 km) system of narrow gauge railroad system to move sisal as well as sugar and corn.

Map of Yucatan's railways

Map of Yucatan's railways. Copyright Allen Morrison. Reproduced by kind permission (see link to original map near end of this post). Click map for larger version.

The tracks stretched up to 100 km in all directions from Yucatán’s capital, Mérida. Rolling stock and complete sections of track with steel ties were imported mostly from Europe but also from the USA. The small trains were powered by mules, steam engines, electric batteries, and later by gasoline motors. There was no standard design. Several different gauges were in use ranging from 400 to 930 mm (15.7 to 36.6 in).

Foreign competition, the Mexican Revolution, and synthetic fibers brought an end to the sisal boom. Many of the plantations closed in 1930s. Soon small entrepreneurs were providing rail passenger services between the scores of towns in the area. Many families used the small sisal hauling cars as personal transport, powered by a horse or mule. This was far more efficient than animal drawn carts on the rough dirt roads, but required occasional de-railing to allow those going in the opposite direction to pass. Some of the Yucatán’s narrow gauge lines have survived into the 21st century, and some of the former sisal haciendas have reopened as luxury hotels for tourists.

Acknowledgments: Grateful thanks to Allen Morrison, who generously allowed us permission to reproduce his excellent map of Yucatán railways.

Mexico’s transportation systems are the subject of chapter 17 of Geo-Mexico: the geography and dynamics of modern Mexico. Buy your copy today!

Yucatán’s main line railway was not linked to the rest of Mexico until about 1950.

Baja earthquake moved part of California

 Maps, Mexico's geography in the Press  Comments Off on Baja earthquake moved part of California
Jun 242010
 

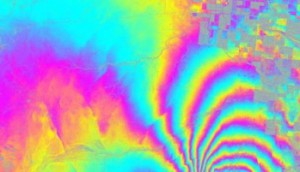
The 4/4/2010 (Easter Sunday) earthquake centered in Baja California really did not only shake the earth but also move it. What is even more amazing is that this may be one of the best documented examples of an earthquake in one country moving parts of a neighboring country.

UAVSAR interferogram of Calexico region

UAVSAR interferogram of Calexico region. Credit: NASA/JPL

NASA has released data showing that the 4/4/2010 earthquake in Baja California moved the border city of Calexico in California. According to NASA’s analysis of radar data from research flights, the April earthquake moved the Calexico region as much as 0.8 meters (2.5 feet) towards the south.

Further south, in Baja California, some parts of the ground moved up to 3 meters (10 feet).

For a full explanation of the image, which shows an area about 20km east-west, by 15 km north-south, please refer to the original article.

Earlier post on 4/4/2010 earthquake: 7.2 magnitude earthquake strikes Baja California (4 April 2010)

Other cities have also been moved by earthquakes. For instance, in the magnitude-8.8 Chilean earthquake of 27 February 2010 , the city of Concepción in Chile was displaced a whopping 3 meters (10 feet) west of its original position.

May 122010
 

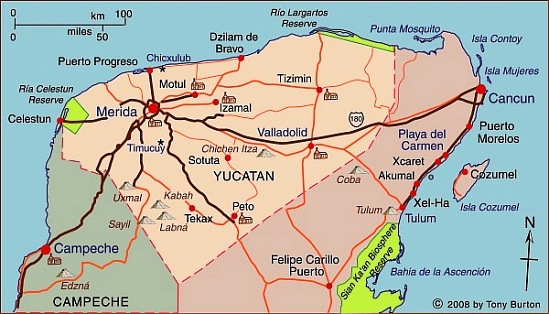
Yucatán state (see the map below) has an area of 39,612 square kilometers and a population of 1,945,840 (2010 estimate). Its distinctive landscapes include coastal rias (drowned river valleys, such as Celestún) and tropical karst (limestone scenery). The state’s capital city  is Mérida, the “white city” (2009 population: 955,000).

Map of Yucatán state. Copyright 2010 Tony Burton. All rights reserved.

The state was an important sisal-producing area during the 19th century. Sisal was exported all over the world through the port of Sisal [see comments], later surpassed as a port by Progreso.

The state has numerous important Mayan sites, including Uxmal and Chichen Itza. These sites have led to cultural tourism becoming very important to the state’s economy. Several cities, including Mérida and Izamal, have outstanding examples of colonial architecture. Several former sisal haciendas have been turned into luxurious hotels.

Several attempts have been made in recent decades to link the Yucatán Peninsula to the US Gulf coast by vehicle ferry, but none has yet succeeded. Such a route would save several days of driving time and would be a huge boost to overland tourism in the state, since many of its potential cultural and eco-tourist attractions are not very easy to reach by public transport.

Map of the state of Campeche, Mexico

 Maps  Comments Off on Map of the state of Campeche, Mexico
May 082010
 

The state of Campeche (see map)  has an area of 57,925 square kilometers and a population of 608,535 (2010 estimate).

Its distinctive landscapes include a variety of coastal features and inland karst (limestone scenery). The state’s capital city  is Campeche, a colonial city which still preserves some of its ancient city walls and has UNESCO World Heritage status.  The most important city in the state economically is Ciudad del Carmen “the pearl of the Gulf”, center of the state’s involvement in Mexico’s oil industry, and an important base for offshore drilling.

Map of Campeche. Copyright 2009 Tony Burton. All rights reserved.

In the interior, the biosphere reserve of Calakmul has become an important tourist attraction.

The state’s economy looks set for a significant boost in coming decades as several major projects come to fruition. These include the first 6,000 hectares of a 30,000-hectare project on the coast of the Laguna de Términos for the commercial farming of rice and beans, and a similar sized forestry plantation project near Champoton specializing in the growing of scarce tropical hardwoods such as teak and mahogany.

Oaxaca is the most culturally diverse state in Mexico

 Excerpts from Geo-Mexico, Maps  Comments Off on Oaxaca is the most culturally diverse state in Mexico
May 042010
 

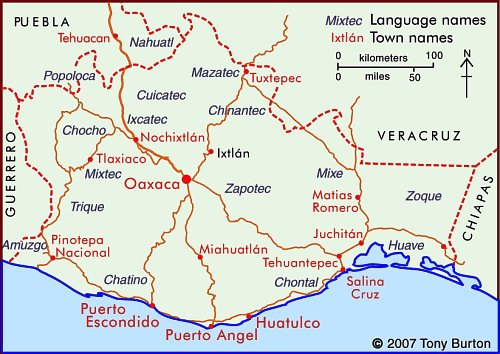
The inter-census population count in Mexico in 2005 found that more than one million people in Oaxaca spoke at least one indigenous Indian language. Close behind came the state of Chiapas with about 950,000 indigenous language speakers.

Indigenous Indian groups in the state of Oaxaca

In Oaxaca, according to the National Commission for the Development of Indigenous Peoples, more than 1.5 million people live in a home where at least one of the residents either speaks an indigenous language or considers themselves indigenous (even if they do not speak an indigenous language). This is 50% more people than are found in the same category in Chiapas.

Not only does Oaxaca have more indigenous people, it also has a much greater linguistic and cultural diversity than Chiapas or any other state in Mexico.

Oaxaca’s one million indigenous speakers represent 35% of the state’s total population. The largest indigenous linguistic groups in the state include about 350,000 Zapotec, 230,000 Mixtec, 165,000 Mazatec, 100,000 Chinantec, 100,000 Mixe, and 40,000 Chatino.

Almost 90% of Zapotec speakers also speak Spanish, which considerably enhances their education and employment opportunities. On the other hand, 23% of Mixtecs do not speak Spanish, and hence face a tougher challenge in the workplace. Tens of thousands of Mixtecs have migrated away from Oaxaca looking for work. Mixtec speakers tend to migrate to Mixtec-speaking neighborhoods; there are about 16,000 Mixtecs in Mexico City, 14,000 in Baja California, 13,000 in Sinaloa, and perhaps 50,000 in the USA. A sizable number of these migrants are essentially monolingual, with very limited Spanish.

The map shows the regions where the main indigenous groups in Oaxaca reside. One of the reasons for Oaxaca having retained such an extraordinary diversity of Indian groups is the state’s very rugged terrain, which has isolated numerous indigenous groups, cutting them off from mainstream Mexican society. This diversity of cultures helps to make Oaxaca one of Mexico’s most interesting states. The cultures find expression today not only in language, but also in modes of dress, handicrafts, music and dance. The state of Oaxaca celebrates its ethnic diversity in its annual extravaganza, the Guelaguetza festival, normally held in July.

Mexico’s cultural diversity is discussed in chapters 10 and 13 of Geo-Mexico: the geography and dynamics of modern Mexico.

This is an edited version of an article originally on MexConnect website.

The geography of drug trafficking in Mexico

 Maps, Mexico's geography in the Press  Comments Off on The geography of drug trafficking in Mexico
Apr 242010
 

This article dates back to 2010. For updates, see:

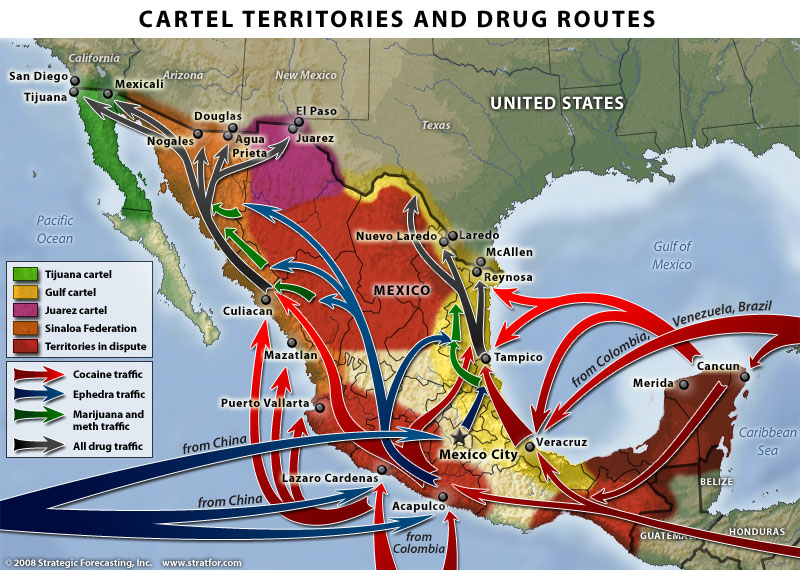
This map of drug cartel territories and drug trafficking and export routes comes from a Stratfor Global Security and Intelligence Report by Fred Burton and Ben West, When the Mexican Drug Trade Hits the Border, published 15 April 2009.

Map of Cartel Territories. Copyright Stratfor. Click map for enlarged version.

Click here to see map in its original context. Map © Copyright 2008 Strategic Forecasting Inc, STRATFOR www.stratfor.com. This map is republished with permission of STRATFOR.

The map shows the major routes for Mexico’s imports, transport and exports of drugs.  The boundaries between cartel territories are in a constant state of flux as rival cartels fight to enlarge their territories.

Perhaps the single biggest shift in the geography of drug trafficking in Mexico in recent decades has been that involving drugs originating in Colombia. Prior to the 1980s, Colombian drugs reached the US and Canada either direct or via the Caribbean. During the 1980s, as US pressure mounted on these routes, Colombian cartels shifted their supply routes to Mexico, where they needed the help of Mexican gangs. These gangs rapidly became better organized and have become the powerful Mexican cartels operating today.

Mexico’s on-going “war” against drugs cartels has had most success so far against the Gulf cartel and the Zetas, who started life as the enforcing arm of the Gulf cartel. On the other hand, the influence of the Sinaloa cartel appears to be spreading. For an analysis of the Gulf cartel, including the effects of globalization on its operations, see Stephanie Brophy’s “Mexico Cartels, corruption and cocaine: A profile of the Gulf cartel” (Global Crime, vol. 9, #3, August 2008, pp 248-261)

This article dates back to 2010. For updates, see:

An overview of the geography of drug trafficking in Mexico forms part of chapter 20 of Geo-Mexico: the geography and dynamics of modern Mexico. Buy your copy today!

Related articles in this mini-series:

Map of the state of Jalisco, including Guadalajara, Puerto Vallarta and Chapala

 Maps  Comments Off on Map of the state of Jalisco, including Guadalajara, Puerto Vallarta and Chapala
Apr 212010
 

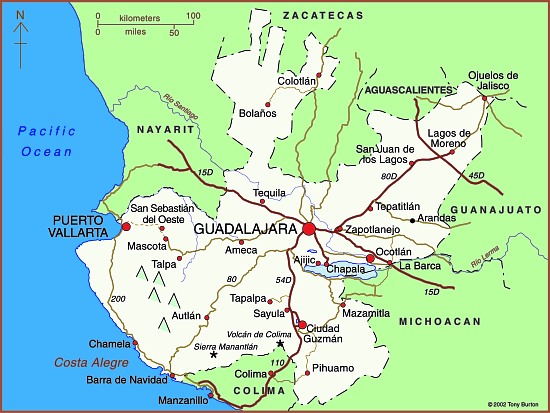
The state Jalisco (see map)  has an area of  78,609 square kilometers and a population of 7,070,555 (2010 estimate). The state’s capital city is Guadalajara, Mexico’s second largest city (2009 population: 4,365,000). On the outskirts of the city is an area of industry that is known as Mexico’s “Silicon Valley” because of its various computer-related factories.

The state is entirely within Mexico’s “Volcanic Axis” with varied scenery, encompassing everything from inland plateaus to rift valleys, volcanic peaks, calderas and coastal landforms. Its diverse altitudes mean that there are significant climate differences within the state.

Map of Jalisco. Copyright 2010 Tony Burton. All rights reserved.

Jalisco’s economy is very diversified. The state is a major agricultural producer, but also has an important manufacturing output, and also has a significant tourism industry, centered on the coastal resort of Puerto Vallarta. The villages of Ajijic and Chapala on the northern shore of Lake Chapala, Mexico’s largest natural lake, are the home to several thousand US/Canadian retirees.

Previous blog posts about Jalisco include:

Cartogram of Mexico’s population distribution

 Maps  Comments Off on Cartogram of Mexico’s population distribution
Apr 112010
 

Cartograms are maps in which the sizes of areas (such as states or countries) have been distorted to reflect some numerical value applying to that area. They are a form of topological transformation. To help make the end-product recognizable, the positions of major places are kept as close to their conventional spatial arrangement as possible. Drawing such maps used to be a very time-consuming and trial-and-error process. Only in the last decade or so has it become possible to make such maps using sophisticated computer programs. The most famous cartograms produced to date have emerged from the work of a team at the University of Sheffield in the UK. Their main website includes some fascinating examples of world cartograms portraying everything from tornadoes to tractors and nurses to national savings.

The Sheffield team have also produced population cartograms for individual countries, which offer a unique visualization of population distribution.

text

Cartogram of Mexico's population. © Copyright 2009 SASI Group (University of Sheffield). Used under Creative Commons Licence.

The original cartogram on its original page (a somewhat larger image).

The cartogram offers a striking image of the dominance of Mexico’s three main cities—Mexico City, Guadalajara and Monterrey—and their surrounding areas in the nationwide distribution of population.

The home page of worldmapper.org

Apr 012010
 

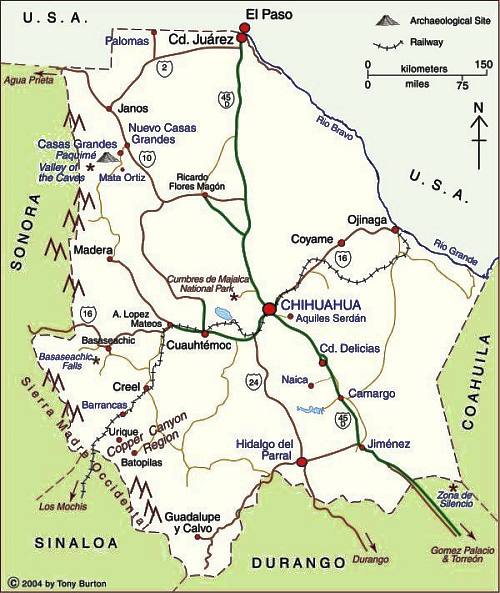
The map shows the state of Chihuahua in northern Mexico. The state capital is the city of Chihuahua (2009 population: 839,000) . Chihuahua is the largest state in Mexico in area: 247,087 square kilometers  (95,401 square miles). The state’s population is 3,422,047 (CONAPO 2010 estimate).

Cd. Juárez is the state’s largest city and Mexico’s 8th largest city with a population of about 1.4 million. In recent years, the city, across the border from the US city of El Paso, has gained considerable notoriety on account of its violence and high murder rate. It also faces air pollution issues, discussed in chapter 23 of Geo-Mexico: the geography and dynamics of modern Mexico.

Map of Chihuahua. Copyright 2004, 2010 Tony Burton. All rights reserved.

The state of Chihuahua has several important tourist attractions, including:

  • the Copper Canyon region (narrower, deeper and longer than the US Grand Canyon) which is home to the Tarahumar Indians, an indigenous group with a particularly distinctive lifestyle. The Copper Canyon and Tarahumar Indians are discussed in chapters 13, 17 and 19 of Geo-Mexico. A world-famous tourist train traverses this region.
  • Mexico’s two highest waterfalls, the Piedra Volada Falls, where the water tumbles 453 meters (1,486 feet) and the Basaseachic Falls, which are  246 meters  (807 feet) in height. The Piedra Volada Falls, which are seasonal, are not shown on this map, but are a short distance north of the Basaseachic Falls.
  • The Casas Grandes area with its important archaeological site
  • Mennonite farming areas; their distinctive landscapes are discussed in chapter 11 of Geo-Mexico
  • Many sites associated with famous revolutionary figure Pancho Villa, including his former 50-room mansion, now a museum, in the state capital

Click here for the interactive version of this map on MexConnect website.

“La Curva de la Gringa”, the American woman’s curve, a place name in Michoacán, Mexico

 Maps, Mexico's geography in the Press, Other  Comments Off on “La Curva de la Gringa”, the American woman’s curve, a place name in Michoacán, Mexico
Mar 302010
 

Another interesting example of an unusual place name (following on from an earlier post about unusual place names) is the name “La Curva de la Gringa”, the American woman’s curve.

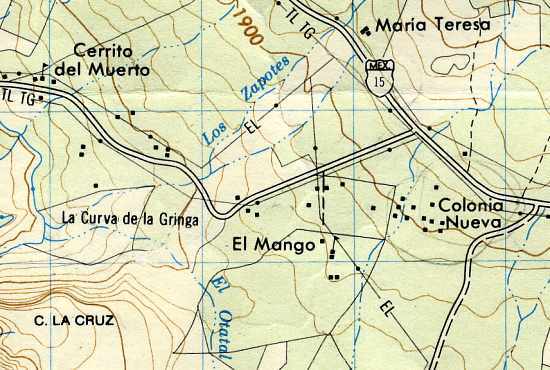
La Curva de la Gringa is the name of a 90-degree bend near Jungapeo, west of Zitácuaro in the state of Michoacán. Literally translated as “the American woman’s curve”, how did this name come about? The first thing to remember is that all names on maps have to come from somewhere. Detailed maps of Mexico, including the 1:50,000 series, relied initially on aerial (later satellite) imagery, followed by some checking on the ground. Given the expense, ground checking was often relatively limited. However, the on-the-ground surveyors were responsible for adding names to the maps.

La Curva de la Gringa, Michoacán (on Mexico’s 1:50,000 topographic map)

In this case, local informants were apparently unanimous in calling this bend La Curva de la Gringa. Further research shows that this had nothing to do with any purported similarity to the sensuous curve of a gringa‘s breast, but derived from when the road was first paved in the 1950s. Apparently, shortly after the road was finished, an American lady driving her oversized gas-guzzler down to the luxury spa of San José Purua completely missed this bend, and plowed into a cornfield. The locals have long memories!

In 2010, this road is being widened, and sidewalks and street lights installed, all the way from Federal Highway 15 (see map), past La Curva de la Gringa, and as far as the money allocated (currently about 7 million pesos) allows. The first section was due to be inaugurated 21 March 2010. If anyone has an update, please leave a comment. Here’s hoping that no more accidents ever occur along this stretch of road, and that no future place names ever reflect such unfortunate incidents.

First map of Mexico on postage stamp

 Maps, Other  Comments Off on First map of Mexico on postage stamp
Mar 142010
 

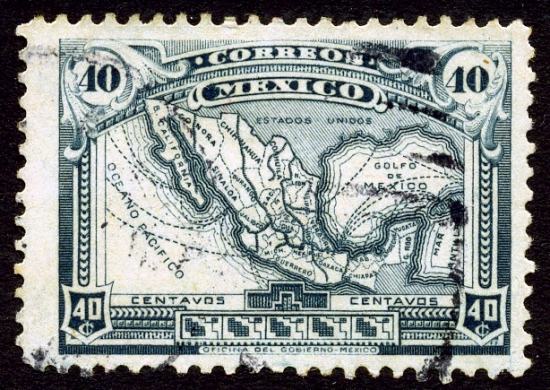
It was not until 1915, in the middle of the Mexican Revolution, that a map of the Republic appeared for the first time as the central design on a Mexican postage stamp.

Most states were named, though abbreviations were necessary given the size of the stamp. In 1915, though, the state of Nayarit on the Pacific Coast, north-west of Colima did not yet exist. It came into being in1917, with the signing of Mexico’s Constitution (the one which is still currently in force). Baja California, shown as single entity on the map, was divided into northern and southern sections in 1931.

In addition to the states, the map shows the main railway lines and also the main shipping routes. In 1915, the easiest way to reach the Yucatán Peninsula was by boat. It would be another 35 years or so before a rail link was completed between Veracuz and Merida. International shipping routes were very important in 1915, since air travel was in its infancy.

The map take some artistic license with scale. In particular, the island of Cuba has been brought much closer to the north-eastern tip of the Yucatán Peninsula than it really is.

The historical evolution of the boundaries of Mexico, and of its individual states, are analyzed in chapter 12, “The changing political map of Mexico” of Geo-Mexico: the geography and dynamics of modern Mexico. The development of Mexico”s railway lines is discussed in detail in chapter 17.

Map of Baja California Peninsula

 Maps  Comments Off on Map of Baja California Peninsula
Mar 032010
 

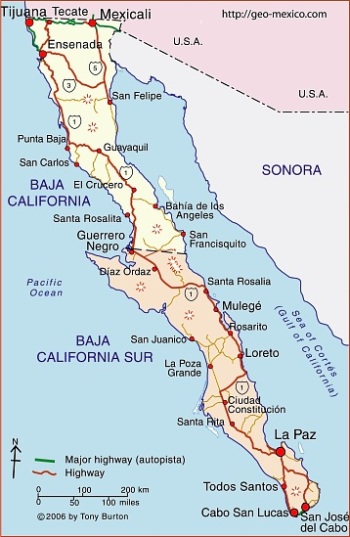
The map shows Mexico’s Baja California Peninsula. This includes the states of Baja California, the northern section of the peninsula, and Baja California Sur. The state capital of Baja California is Mexicali; the state capital of Baja California Sur is La Paz.

Note: There is no such state as Baja California Norte, despite this name being used on some websites!

Click here for the interactive version of this map on MexConnect website

Want to read more?

Feb 022010
 

This link is to a blank outline map of Mexico (in pdf format), including state boundaries, but no cities or other features.

Blank outline map of Mexico

There are no restrictions on how this map may be used (no royalty is payable) but please credit geo-mexico.com if you download and use it in any report or in class.

We welcome comments on whether or not you found this map useful.
Please use the comments form if you wish to tell us about other maps that you would like to see on our site.