admin

Net migration flow from Mexico to the USA falls close to zero or has possibly reversed

 Books and resources, Updates to Geo-Mexico  Comments Off on Net migration flow from Mexico to the USA falls close to zero or has possibly reversed
Apr 262012
 

The following are extracts from the text of a press release from the Pew Hispanic Center entitled “Net Migration from Mexico Falls to Zero—and Perhaps Less“, by Jeffrey Passel, D’Vera Cohn and Ana Gonzalez-Barrera:

The largest wave of immigration in history from a single country to the United States has come to a standstill. After four decades that brought 12 million current immigrants—more than half of whom came illegally—the net migration flow from Mexico to the United States has stopped—and may have reversed, according to a new analysis by the Pew Hispanic Center of multiple government data sets from both countries. The report is based on the Center’s analysis of data from five different Mexican government sources and four U.S. government sources. [see original article for sources]

The standstill appears to be the result of many factors, including the weakened U.S. job and housing construction markets, heightened border enforcement, a rise in deportations, the growing dangers associated with illegal border crossings, the long-term decline in Mexico’s birth rates and changing economic conditions in Mexico.

Among the report’s key findings:

  • In the five-year period from 2005 to 2010, about 1.4 million Mexicans immigrated to the United States and about 1.4 million Mexican immigrants and their U.S.-born children moved from the United States to Mexico.
  • In the five-year period a decade earlier (1995 to 2000), about 3 million Mexicans had immigrated to the U.S. and fewer than 700,000 Mexicans and their U.S. born-children had moved from the U.S. to Mexico.
  • This sharp downward trend in net migration has led to the first significant decrease in at least two decades in the number of unauthorized Mexican immigrants living in the U.S.—to 6.1 million in 2011, down from a peak of nearly 7 million in 2007.
  • Mexicans now comprise about 58% of the unauthorized immigrants living in the United States. They also account for 30% of all U.S. immigrants.
  • Apprehensions of Mexicans trying to cross the border illegally have plummeted by more than 70% in recent years, from more than 1 million in 2005 to 286,000 in 2011—a likely indication that fewer unauthorized immigrants are trying to cross.
  • As apprehensions at the border have declined, deportations of unauthorized Mexican immigrants—some of them picked up at work or after being arrested for other criminal violations—have risen to record levels. In 2010, nearly 400,000 unauthorized immigrants—73% of them Mexicans—were deported by U.S. authorities.
  • Looking back over the entire span of U.S. history, no country has ever sent as many immigrants to this country as Mexico has in the past four decades. However, when measured not in absolute numbers but as a share of the immigrant population at the time, immigration waves from Germany and Ireland in the late 19th century equaled or exceeded the modern wave from Mexico.

– – – end of quotations from press release – – –

Related posts:

How much drugs money is laundered in Mexico each year?

 Other  Comments Off on How much drugs money is laundered in Mexico each year?
Apr 212012
 

Despite this being an obvious question, there is no simple or generally accepted answer! However, a document published last month by Centro de Estudios Sociales y de Opinión Pública de la Cámara de Diputados (CESOP), entitled Lavado de dinero: indicadores y acciones de gobierno binacionales (“Money Laundering: bi-national indicators and government actions”) does offer some clues and estimates.

For example, according to Mexico’s tax authorities (SHCP), the nation’s financial system “gained” at least 10 billion dollars last year from unrecorded, presumably illicit, activities such as drug trafficking. North of the border, the US State Department believes that money laundering in Mexico accounts for between 8 billion and 25 billion dollars a year, while figures as high as 29 billion dollars have been offered in the US Congress.

Financial models developed by Global Financial Integrity and Columbia University in the City of New York suggest that the total “gains” from all forms of illegal activities in the USA are about 196 billion dollars (1.36% of US GDP), and that about 90% of this amount is laundered each year. The same models, applied to Mexico, suggest total crime-related profits of 38 billion dollars (3.6% of Mexico’s GDP), only 10-14 billion dollars of which is laundered into the formal economy.

If the models are to be believed, in the USA, 46% of the total amount laundered derives from drug trafficking, 32% from people trafficking, 15% from pirated goods and 7% from fraud. In Mexico, 41% of laundered money originates from drugs, 33% from people trafficking, 20% from pirated goods and 6% from fraud.

Despite the considerable variation in numbers, most of the figures and calculations fall within, or close to, the range of values (between 2 and 5% of global GDP) that is estimated by the International Monetary Fund to be laundered each year around the world.

Mexico’s Volcanic Axis

 Excerpts from Geo-Mexico  Comments Off on Mexico’s Volcanic Axis
Apr 192012
 

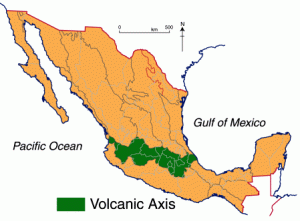
Mexico’s active seismic zones have created numerous volcanoes, many of which are still active. Virtually all the country’s active and recently dormant volcanoes are located in a broad belt of high relief which crosses Mexico from west to east: the Volcanic Axis (see map).

volcanic-axisAltitudes in this region vary from a few hundred to several thousand meters. The principal peaks are shown on the map. They include many of Mexico’s most famous mountains, such as Popocatepetl and Iztaccihuatl, near Mexico City; Pico de Orizaba, Mexico’s highest peak; Paricutín, the only completely new volcano in the Americas in recent times; and Colima, considered the most active at present. Many of the volcanoes are surprisingly young. For instance, a study using Carbon‑14 dating on the palaeosols (ancient soils) under 12 volcanoes in the Toluca area yielded ages ranging from 38,600 to 8400 years before present.

It is unclear precisely why this broad belt of Mexico should be so active. Elsewhere in the world all major tectonically active areas have been linked in terms of their location to the margins or meeting‑zones of tectonic plates. Some Mexican geologists believe that Mexico’s Volcanic Axis is a rare example of activity associated with a gently dipping plate margin, one where the edge of the Cocos plate is subsumed, but at only moderate gradient, beneath the North American plate.

Almost all the volcanic activity in this zone has taken place in the last 25 million years, from the upper Oligocene period, through the Miocene and Pliocene and up to Recent. Two distinct periods of activity are recognized by some geologists. The first, in the late Oligocene and early Miocene, produced volcanic rocks often found today tightly folded by later earth movements. The second, responsible for all the major composite cones as well as dozens of ash and cinder cones, started in the Pliocene and continues today.

Erosion has had relatively little time to work on these “new” volcanic peaks, some of which are still developing. As a result, this region includes Mexico’s highest mountains, reaching over 5500 m or 18,000 ft.

Thick, lava-rich volcanic soils make this one of the most fertile areas in North America. Though the relief is very rugged, this area has supported relatively high population densities for hundreds of years, including the current large metropolitan areas of Mexico City, Guadalajara and Puebla. Legacies of previous volcanic activity are found in craters, mud‑volcanoes, geothermal activity, and the numerous hot springs (and spa towns) scattered throughout the Volcanic Axis.

Related posts:

Apr 162012
 

In just 20 years, Mexico has gone from a nation that needed to import less than 400,000 metric tons of corn (maize) a year in order to satisfy its domestic market to one where, in the 2011-12 season, it will need to import almost 10,000,000 tons.

One producers’ organization, Mexico’s National Confederation of Maize Growers (CNPAMM), argues that this reliance on imports has relegated the work done by its members to a relatively minor role in providing the nation with food. The growers claim that the price they receive for corn (post-NAFTA) has declined in the face of cheaper imports, jeopardizing their livelihoods. (For one view of the changes post-NAFTA, see NAFTA Truth and Consequences: Corn).

On the other hand, in the past few years, the costs of imported corn have risen sharply, meaning that consumers have to pay more for their tortillas. In order to preserve some stability, the Mexican government has bought corn futures which guarantee corn prices for a period of time.

How is it possible that the country that gave the world corn is now so dependent on imports of corn, almost all of which come from the USA? According to the CNPAMM, it is the result of speculation, market distortion and failures in Mexico’s economic policy. Héctor Carlos Salazar, the president of CNPAMM, called on maize growers to demand better prices, a reduction in imports, and some guarantees from the politicians fighting this year’s federal elections that they will take steps to ensure Mexico’s self-sufficiency in foodstuffs.

Salazar has been quoted in the press as offering some interesting statistics for the impacts of every additional ton of corn that Mexico imports from abroad. He claims that each ton imported reduces agricultural employment by 4.54 man-hours. It also reduces other inputs: diesel by 6 liters, fertilizers by about 100 kg, insecticides by 1 liter, pesticides by 3 liters and improved seeds by about 4 kg.

The bottom line is that it is not just the food security, particularly of Mexico’s poorest, that is threatened by rising corn imports, it is also Mexico’s economy.

Related posts:

How has the movement of tectonic plates affected Mexico?

 Excerpts from Geo-Mexico  Comments Off on How has the movement of tectonic plates affected Mexico?
Apr 122012
 

In a previous post, we identified the tectonic plates that affect Mexico. In this piece, we look at some of the major impacts of Mexico lying on or close to so many different plates.

To the east of Mexico, in the last 100 million years, outward expansion from the Mid-Atlantic Ridge (a divergent boundary) first pushed South America ever further apart from Africa, and then (slightly more recently) forced the North American plate (and Mexico) away from Eurasia. The Atlantic Ocean continues to widen, expanding the separation between the New World and the Old World, by about 2.5 cm (1 in) each year.

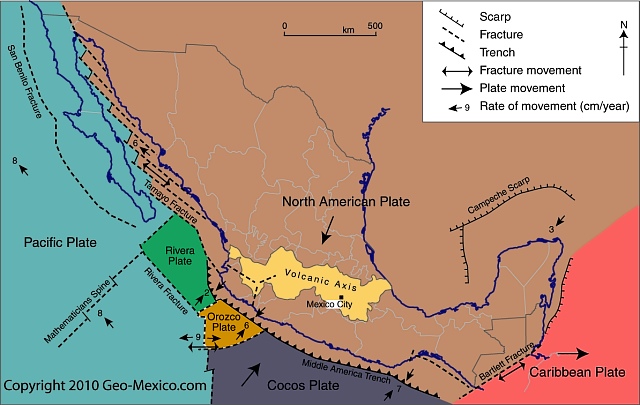
Mexico's position in relation to tectonic plates

Mexico's position in relation to tectonic plates.Map: Geo-Mexico.com; all rights reserved

Meanwhile, to the west of Mexico, an analogous situation is occurring in the Pacific Ocean, where the Cocos plate is being forced eastwards away from the massive Pacific plate, again as a result of mid-ocean activity. The Cocos plate is effectively caught in a gigantic vice, its western edge being forced ever further eastwards while its leading eastern edge smacks into the North American plate.

The junction between the Cocos and North American plates is a classic example of a convergent plate boundary. The collision zone is marked by a deep ocean trench, variously known as the Middle America trench or the Acapulco trench. Off the coast of Chiapas, this trench is a staggering 6662 m (21,857 ft) deep. The trench is formed where the Cocos plate is forced to dive beneath the North American plate.

As the Cocos plate is subducted, its leading edge fractures, breaks and is partly re-melted into the surrounding mantle. Any cracks in the overlying North American plate are exploited by the molten magma, which is under immense pressure, and as the magma is forced to the surface, volcanoes form. The movement of the plates also gives rise to earthquakes. The depth of these earthquakes will vary with distance from the deep ocean trench. Those close to the trench will be relatively shallow, whereas those occurring further away from the trench (where the subducting plate is deeper) will have deeper points of origin.

As the plates move together, sediments, washed by erosion from the continent, collect in the continental shallows before being crushed upwards into fold mountains as the plates continue to come together. A line of fold mountains stretches almost continuously along the west coast of the Americas from the Rocky Mountains in Canada past the Western and Southern Sierra Madres in Mexico to the Andes in South America. Almost all Mexico’s major mountain ranges—including the Western Sierra Madre, the Eastern Sierra Madre and the Southern Sierra Madre—formed as a result of these processes during the Mesozoic Era, from 245 to 65 million years ago.

However, no sooner had they formed than another momentous event shook Mexico. About 65 million years ago, a giant iridium-rich asteroid slammed into the Gulf of Mexico, close to the Yucatán Peninsula, causing the Chicxulub Crater, and probably hastening the demise of the dinosaurs. An estimated 200,000 cubic km of crust was pulverized; most of it was thrown into the air. The resulting dust cloud is thought to have contributed to the extinction of up to 50% of all the species then on Earth. Not only did this event have an enormous impact on all life forms on Earth, it also left a legacy in the Yucatán. The impact crater is about 200 km (125 mi) across. Its outer edge is marked by a ring of sinkholes (locally known as cenotes) and springs where the fractured crust provided easy access to ground water. These locations include the ria (drowned river valley) of Celestún (now a UNESCO Biosphere Reserve), where fresh water springs mingle with salt water to create an especially rich habitat for birdlife.

In the 65 million years since the asteroid impact (the Cenozoic period), the remainder of Mexico has been formed, including many of the plateaus and plains, and the noteworthy Volcanic Axis, which owes its origin to still-on-going tectonic activity at the junction of the North American and Cocos plates.

Related posts:

Two major earthquakes jolted western Mexico (11/12 April 2012)

 Other  Comments Off on Two major earthquakes jolted western Mexico (11/12 April 2012)
Apr 112012
 

Two major earthquakes in two days! Fortunately, they struck in different sections along Mexico’s west coast, meaning that few if any people were shaken by both. The first earthquake struck in Michoacán on 11 April, and was felt over a wide area of central Mexico. This earthquake registered 6.5 on the Richter scale (preliminary estimates had originally suggested it was magnitude 7.0).

The La Mira earthquake, Michoacán (source: USGS]:

  • Time: Wednesday, April 11, 2012 at 17:55 local time
  • Location 18.272N, 102.732̊W
  • Depth 20 km (12.4 miles)
  • The epicenter was about 61 km (38 miles) NW from Lázaro Cárdenas, Michoacán, 130 km (80 miles) SSW from Uruapan, Michoacán, and 143 km (88 miles) NW of Zihuatanejo, Guerrero. This placed it relatively close to the community of La Mira in the state of Michoacán.
  • Only minor damage was reported following this earthquake, despite its magnitude.

The Santa Isabel earthquake

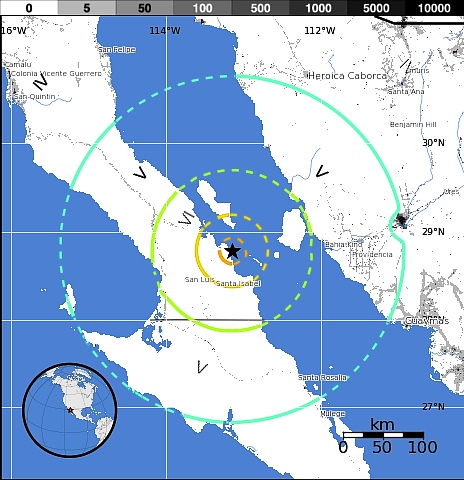
The following day (12.15 am local time on 12 April), an even larger earthquake, magnitude 6.9, hit further north in Mexico, close to the coast of Baja California. Its epicenter was 183 kilometers (113 miles) from Santa Rosalia (Baja California Sur) and 214 kilometers (132 miles) from Hermosillo (Sonora). This meant that its effects were greatest in areas where population is very sparse (see map), and fortunately, once again, there were no reports of any loss of life or major damage.

Few people live in the region struck by the Santa Isabel earthquake.

Few people live in the region struck by the Santa Isabel earthquake.Credit: USGS

These two earthquakes come less than a month after the major magnitude 7.4 earthquake that hit the states of Oaxaca and Guerrero on 20 March 2012. This ‘quake caused significant damage – and was followed by dozens of aftershocks, including one on 2 April that registered 6.0 on the Richter scale.

Now that several parts of this junction of tectonic plates have shifted in quick succession, everyone hopes that these earthquakes will have relieved enough pent-up pressure, and re-adjusted the plates  sufficiently, to prevent further earthquakes in the region in the near future.

Related posts:

Apr 092012
 

A recent report from researchers at the National Autonomous University of Mexico (UNAM) and the Metropolitan Autonomous University (UAM) confirms that the height of the water table below Mexico City is dropping by about one meter a year, as more water is pumped out of the aquifer than the natural replenishment rate from rainfall. About 60% of Mexico City’s drinking water comes from wells, with the remainder piped into the city, mainly via the Cutzamala system. The researchers say that up to 65% more water is taken from some parts of the Mexico City aquifer than the amount replaced each year by natural recharge.

As we reported in a previous post – Why are some parts of Mexico City sinking into the old lakebed? – this has resulted in parts of Mexico City sinking more than seven meters (23 ft) since 1891, with implications for water pipelines, drainage systems, building foundations and the city’s metro network, as well as an increased incidence of ground subsidence.

According to this latest research, the clay soil of the former lake bed below the city is sinking by between 6 and 28 cm/yr in most places, with rates in the southeast part of the city (where numerous wells have been drilled in recent years) sinking by up to 35 cm/yr.

How can the problem of sinking ground be resolved?

The report emphasizes the importance of conserving as much green space as possible within the city, to reduce runoff (and demands on the city’s drainage system) while simultaneously recharging aquifers. The three major alternatives, some combination of which is needed to resolve the problem are:

  • introduce more water-saving strategies so that demand does not continue to increase
  • bring more water from outside the Valley of Mexico (this would be costly and unpopular)
  • feed more wastewater back into the underground aquifers via “surface soaks”. As one example, the National Water Commission (Conagua) has announced plans to build a 200-million-dollar wastewater treatment plant (“El Caracol”) that will inject water back into the aquifer after treatment. It would be Mexico’s first ever large-scale reinjection project.

Perhaps not surprisingly, Mexico City residents pay more for their water than users anywhere else in the country, with an average water rate of US$1.23/cubic meter. Elsewhere, the two states sharing the arid Baja California Peninsula also have higher than average rates of $1.05/cubic meter (Baja California Sur) and $0.94/cubic meter (Baja California). The lowest rate in the country, well below the true cost of supplying water, is in Nayarit, and is just $0.25/cubic meter.

Within Mexico City, access to potable water is far from equally/fairly distributed across the city, as revealed by this thought-provoking quote :

In a study of water access in Mexico City, geographer Erik Swyngedouw found that “60 per cent of all urban potable water is distributed to three per cent of the households, whereas 50 per cent of the inhabitants make do on five per cent of the water”. Critical geographers like Swyngedouw ask us to take note of the spatial nature of power imbalances revealed in patterns of city design and growth: “mechanisms of exclusion… manifest the power relationships through which the geography of cities is shaped and transformed.”  [quote comes from page 31 of Nature’s Revenge: Reclaiming Sustainability in an Age of Corporate Globalization ; the reference is to Erik Swyngedouw’s Social Power and the Urbanization of Water: Flows of Power (OUP 2004).]

This grossly unequal distribution of potable water remains a critical problem that successive administrations in Mexico City and the surrounding State of México have done little to resolve.

Related posts:


Mexico’s political system at the state and municipal levels

 Other  Comments Off on Mexico’s political system at the state and municipal levels
Apr 072012
 

In a previous post – Mexico’s political system: the basics – we looked at the country’s federal political system. In this post, we look at how the political system works at the two other levels of government: state and municipal.

According to the Constitution of 1917, powers not granted to the Federal Government are reserved for the states. State constitutions roughly mirror the federal constitution. Each state has a popularly elected governor who serves one six-year term and cannot be re-elected. The popularly elected members of the state chamber of deputies serve three-year terms. Non-sequential re-election is permitted. Governors generally have more power than the chamber of deputies. State governments depend on the Federal government for much of their revenue, some of which they funnel to municipal governments. Each state has a Supreme Court of Justice with judges appointed by the state governor.

States are divided into municipalities. There are currently 2458 municipalities (counting Mexico City’s delegaciones or boroughs as municipios) which vary greatly in size and population. For example, the average population of Oaxaca’s 570 municipalities is about 6000 while the average population of Baja California’s five municipalities is over 500,000. Each municipality elects a new president and local council every three years.

Municipal governments have taxing authority but rely very heavily on financial support from state and federal sources. Municipalities are responsible for a variety of public services, including water and sewerage; street lighting and maintenance, trash collection and disposal, public safety and traffic, supervision of slaughterhouses, and maintenance of parks, gardens and cemeteries. Municipalities are also free to assist state and federal governments in the provision of elementary education, emergency fire and medical services, environmental protection and the maintenance of historical landmarks.

Greenpeace demands action to clean up Mexico’s surface waters

 Mexico's geography in the Press  Comments Off on Greenpeace demands action to clean up Mexico’s surface waters
Apr 052012
 

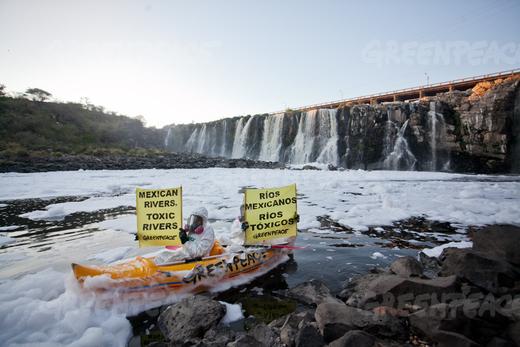
Greenpeace activists chose the Juanacatlán Falls (“The Niagara of Mexico”) for their latest protest to call attention to the poor quality of Mexico’s rivers and lakes. They cited government statistics that show 70% of Mexico’s surface water is contaminated. Most of the pollution comes from industrial dumping, rather than municipal sewage.

It is hard to imagine a better choice. The activists, clad in protective clothing and wearing masks to avoid inhaling toxic gases, paddled kayaks into the River Santiago immediately below the malodorous falls and unfurled banners with slogans such as “Mexican rivers, toxic rivers” (see image).

Greenpeace activists at El Salto de Juanacatlán, 22 March 2012. Photo: Greenpeace.

The activists called on the government to commit to a policy of zero dumping of toxic substances into rivers and lakes by 2020, with sanctions for actions leading to pollution and its effects.

In a coordinated action, thirty NGOs in Jalisco announced the creation of the “Broad Front in Defense of Water and Against Privatization ”, demanding actions towards a fully sustainable use of water. They asked government to take the lead in cleaning up the Santiago River and provide urgent medical attention for residents of communities affected by its high level of pollution (see this blog post). They also called for an end to the privatization of water services.

José Luis Luege, the head of Mexico’s National Water Commission (Conagua), the government body overseeing all Mexico’s water resources, recently presented a portfolio of programs for the country’s 13 water regions which are designed to make Mexico’s water usage sustainable.

Conagua calculates that Mexico currently uses 78.4 million cubic meters of water a year. Of this amount, 66.9 billion cubic meters is taken from surface and underground sources (and is fully sustainable), while about 11.5 billion cubic meters come from the unsustainable use of aquifers, where the rates of abstraction exceeds replenishment. The new programs are designed to reduce and eventually end unsustainable aquifer use, replacing it by a mixture of water-saving programs and by building the necessary infrastructure to obtain more water from sources believed to be fully sustainable.

Related posts:

Which tectonic plates affect Mexico?

 Excerpts from Geo-Mexico  Comments Off on Which tectonic plates affect Mexico?
Apr 022012
 

The theory of plate tectonics suggests that the earth’s crust or lithosphere is from 5 to 65 km (3 to 40 mi) thick and divided into about a dozen large tectonic plates, tabular blocks that drift across the Earth in different directions and at various speeds (up to a few centimeters or inches per year), probably as a result of thermal convection currents in the Earth’s molten mantle. Most plates consist of a combination of both ocean floor and continent, though some are entirely ocean floor.

Each tectonic plate is moving relative to other plates. The movements are not independent because the plates smash into and scrape against one another. Areas in the center of tectonic plates, far from the boundaries, have relatively little seismic activity, but the boundaries between plates are seismically very active, creating earthquakes and volcanoes. The level of seismic activity depends on the relative speed and direction of the plates at the boundary.

There are three distinct kinds of boundaries between plates. At divergent boundaries, along mid-ocean ridges, plates are being steadily pushed apart, with new crust being added by volcanic activity to the rear of each plate as it moves. At convergent boundaries, plates collide and parts of the plates either buckle or fracture or are subducted back down into the molten mantle. The third kind of boundary is where plates are neither created nor destroyed but are moving side by side. The resulting friction as they rub against each other can produce large earthquakes.

Almost all of Mexico sits atop the south-west corner of the massive North American plate (see map). Immediately to the south is the much smaller Caribbean plate. The North American plate extends westwards from the Mid-Atlantic Ridge, which runs through Iceland and down the middle of the Atlantic Ocean, to the western edge of North America. In a north-south direction, it extends from close to the North Pole as far south as the Caribbean.

Mexico's position in relation to tectonic plates

Mexico's position in relation to tectonic plates.Map: Geo-Mexico.com; all rights reserved

While most of Mexico rests on the North American plate, it is also influenced by several other plates.

The Baja California Peninsula is on the gigantic Pacific plate, which is moving northwest and under the North American plate. The intersection of these plates under the Gulf of California causes parallel faults which are part of the famous San Andreas Fault system. Thus, the Gulf of California is an area of heavy seismic activity.

The small Rivera plate, between Puerto Vallarta and the southern tip of Baja California, is moving in a southeasterly direction and rubbing against the Pacific plate; it, too, is moving under the North American plate.

The Cocos plate and tiny Orozco plate are ocean crust plates located off the south coast of Mexico. The collision of the Cocos plate and the North American plate has had several far-reaching consequences, including both the disastrous 1985 earthquakes that caused such severe loss of life and damage in Mexico City and the much more recent 2012 earthquake that, fortunately, was far less destructive.

Related posts:

Mar 312012
 

In a few months time, Mexicans go to the polls to elect a new President. Just how does the Mexican political system work? As a build-up to the important federal elections coming shortly, this post looks at the background to Mexico’s political system and provides a quick summary of the federal level of government. A future post will look at the state and municipal levels.

The current political system in Mexico derives from the Constitution of 1917 which emerged from the Mexican Revolution. The Constitution is a sweeping document that captures the ideals of the Revolution, but also reflects three centuries of Spanish colonial rule. The Constitution is “revolutionary” in that it aggressively protects the rights of workers, peasants and their organizations. It guarantees the right to organize, an eight-hour work day, the rights of female and child workers, and the payment of a minimum wage sufficient to satisfy the necessities of life. The colonial influences are evidenced by highly codified civil law, acceptance of heavy state involvement in civic affairs and business, and the relative strength of the executive over other branches of government. Another important influence is Mexico’s 19th century history which included foreign military occupations, loss of half the national territory and several virtual dictatorships.

The government of the United Mexican States has three branches: executive, legislative, and judicial.

The executive branch is by far the most important and most powerful. The President serves a six-year term, may never be re-elected, and appoints the 18 cabinet secretaries who run their respective secretariats or ministries. The full cabinet meets only rarely. Legislation must be signed by the President to become law. Though the legislature may override a veto, the Constitution dictates that laws can only be enacted after being signed by the President. The President has the power to issue basic rules (reglamentos) independent of the legislature. In fact, most Presidents unilaterally issue more Mexican laws than are passed by the legislature.

The legislature consists of a Senate and a Chamber of Deputies. The 128 senators serve the same six-year term as the President and cannot be re-elected. Each state and the Federal District has two senators from the party getting the most votes in that state and one from the party getting the second most votes.

These 96 senators do not represent equal numbers of constituents. Smaller states have greater representation. For example, in the State of Mexico there are about 4.7 million people per senator whereas in Baja California Sur there are only about 170,000 people per senator. The remaining 32 senators are elected by proportional representation based on the percentage of the national vote obtained by each party. These senators do not have geographical constituents.

There are 500 deputies in the Chamber. Geographic districts directly elect 300 deputies; the remaining 200 are elected by proportional representation. A party must win at least 2% of the national vote to get a deputy in the Chamber. They serve three-year terms and cannot be re-elected.

The ban against re-election means that every three years there is an entirely new Chamber of Deputies. Every six years Mexico has a new President and all new legislators. The ban on re-election diminishes the continuity as well as the overall experience and expertise of Mexican government at all levels.

The judiciary is divided into federal courts and state courts. The federal courts have jurisdiction over constitutional issues, most civil cases (contracts, labor issues, banking and commerce) as well as major felonies (bank robberies, kidnapping), except murder. State courts handle murders, divorces and minor felonies. The Supreme Court consists of 26 judges, selected by the President and confirmed by the Senate. Legally, they serve for life but actually submit their resignation to the new President every six years. Below the Supreme Court are four chambers of judges dealing with criminal, civil, labor and administrative issues. There are 16 federal circuit courts and 68 district courts.

The eruption of El Chichón volcano in 1982

 Excerpts from Geo-Mexico  Comments Off on The eruption of El Chichón volcano in 1982
Mar 282012
 

Not all volcanoes give any warning of impending activity. Exactly thirty years ago, just before midnight 28/29 March 1982, the El Chichón volcano in Chiapas erupted completely without warning and with unexpected fury.  Two further eruptions followed in early April. The lack of warning caused heavy loss of life among local villagers who had been unable to evacuate their villages. About 2,000 people lost their lives as a result of the eruption.

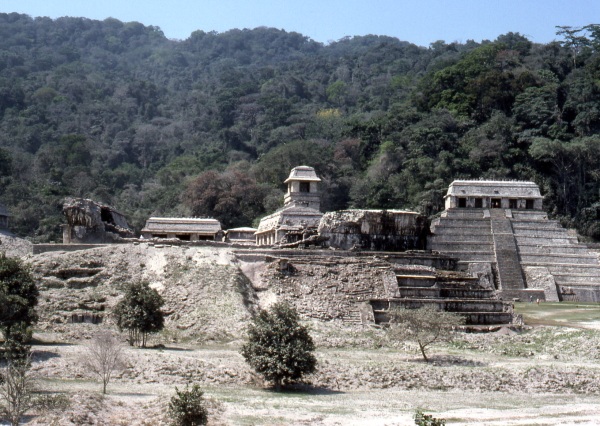
Palenque covered in ash following the eruption of El Chichón

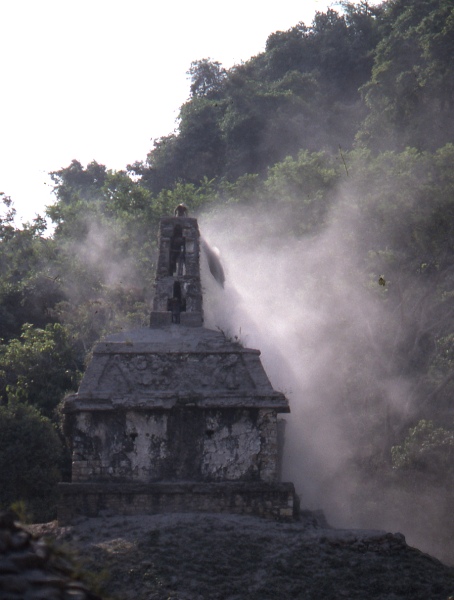
Palenque covered in ash following the eruption of El Chichón. Photo: Tony Burton; all rights reserved.

Ash from El Chichón fell over a wide area of southern Mexico. The nearby Mayan archaeological site of Palenque (set on the edge of what is normally a luxuriant, tropical-green jungle) was covered in ash (see photo above).

Concerned about the potential for the ash to combine with rainfall and form an acidic solution that might erase delicate and intricately carved stones, workers at the site engaged in a major clean up, even before all the ash had stopped falling. The second photo (below) shows a worker on top of one of Palenque’s distinctive roof combs sweeping the recently-fallen ash off the structure.

Sweeping ash off Palenque following the eruption of El Chichón

Sweeping ash off Palenque following the eruption of El Chichón. Photo: Tony Burton; all rights reserved.

Vulcanologists later worked out that the last previous eruption of El Chichón had been 1200 years earlier. The eruption “left behind a brooding, sulfuric, acidic lake that formed when the dome collapsed into a crater and filled with water.”

Aztec glyph for a “hill that smokes”

El Chichón forced more than 7 million tons of sulfur dioxide and 20 million tons of particulate material into the stratosphere. The resultant cloud of volcanic gases circled the Earth in three weeks and was still dissipating three years later. It was expected that the additional particulates in the atmosphere would reduce the solar radiation reaching the earth and cause the following summer to be cooler than usual. However, in an unlikely coincidence, an El Niño event began that same year, negating any significant cooling effect from the volcano’s particulates.

The El Chichón eruption was one of the largest volcanic eruptions of the 20th century, exceeded only by the 1991 Mt. Pinatubo eruption in the Philippines in terms of the amount of volcanic gases and particulates entering the stratosphere. Ash fell over a wide area, from Campeche to San Cristóbal de las Casas in Chiapas.

By the time the eruption was over, the volcano, whose summit had been 1260 m (4134 ft) prior to the eruption, had lost 200 m in height. The Chiapanecan Volcanic Arc, which includes El Chichón, falls outside Mexico’s Volcanic Axis (the location of almost all Mexico’s volcanoes) and is thought to be related to the subduction of the edge of the Cocos Plate underneath the North American plate.

Related posts:

A matter of scale: Mexico compared to Spain

 Other  Comments Off on A matter of scale: Mexico compared to Spain
Mar 262012
 

Scale matters, especially when two countries or regions are going to be compared. A case in point is depicted on this Mexican airmail stamp from 1977 issued to celebrate the resumption of diplomatic relations between Mexico and Spain. Mexico had broken off relations with Spain in 1939 at the end of the Spanish Civil War when Francisco Franco gained control. Following that war, more than 30,000 Spaniards sought refuge in Mexico, giving a significant boost to the country’s entrepreneurs. It took until 28 March 1977 for diplomatic relations between Mexico and Spain to be restored.

The outline maps on the stamp show Mexico and Spain as having approximately the same area. Presumably this was to ensure that the stamp would be seen as politically-correct, even if not spatially-correct, and would make the two countries look like equal partners. In real life, or on any equal-area map projection,  Mexico (almost 2 million square kilometers) is about four times as large as Spain (close to 50,000  square kilometers).

If the maps were drawn proportional to population, then Mexico would be more than twice as large, since its population of about 112 million (2010) is more than double that of Spain (48 million in the same year). This difference is widening with the years, since Spain’s population growth rate has fallen to about 0.6%/year, while Mexico’s (which has also fallen) remains significantly higher at about 1.1%/year.

Suburbia in Mexico: Alejandro Cartagena’s images of Monterrey

 Books and resources  Comments Off on Suburbia in Mexico: Alejandro Cartagena’s images of Monterrey
Mar 242012
 

What do Mexican suburbs look like? What is their function? As the country’s towns and cities continue to expand, new suburbs appear on their outer edge. Some are gated communities, generally aimed at high income families; these suburbs sometimes include private schools and sports clubs. Other suburbs offer smaller homes aimed at low-income families.

Photographer Alejandro Cartagena lives in the Monterrey Metropolitan Area, which includes nine different municipalities in the state of Nuevo León: Monterrey, Guadalupe, San Nicolás, San Pedro, Santa Catarina, Escobedo, Apodaca, García and Juárez.

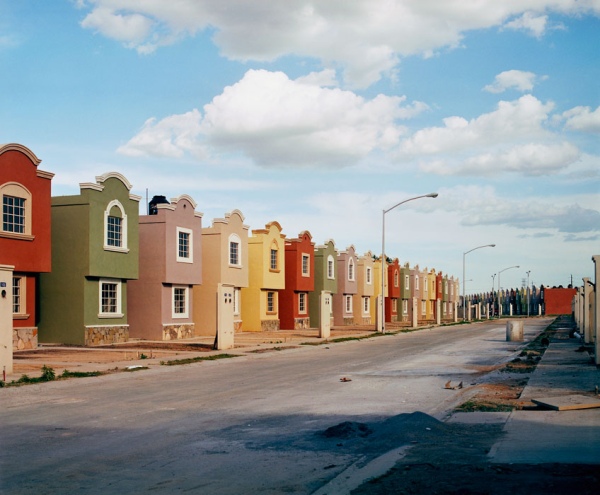
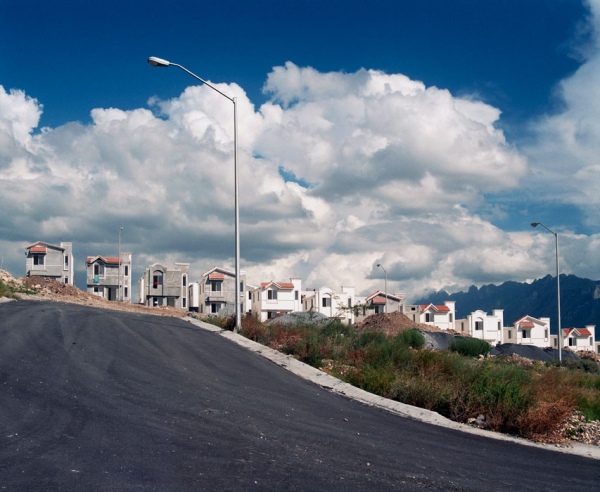
Cartagena spent years exploring the edge of the city to document the manifestations of “suburbia mexicana” through photographs. The suburbs he depicts are mainly low-income suburbs, some still being constructed. Cartagena recognized that change was happening at a very rapid pace, and often by developers with more lust for profit than desire to improve the local community. Since 2001, more than 300,000 new homes have been built in the Monterrey Metropolitan Area. Many suburbs were badly planned, as some of Cartagena’s photos clearly reveal. Considerations of roads, parks and public transport are often ignored in the decision-making of these developers.

Copyright: Alejandro Cartagena; all rights reserved. Image from "suburbia mexicana"; reproduced by kind permission.

Copyright: Alejandro Cartagena. Image from "suburbia mexicana". Reproduced by kind permission.

“Suburbia mexicana” includes five series of images, each briefly described below. For fuller descriptions of Cartagena’s ideas, please use the links from the title of each series to visit his relevant section of his website:

Fragmented Cities explores what the homes look like, as if being photographed for a real estate brochure.

Lost Rivers looks at the “environmental problems that stem from excessive urban and suburban development such as dried up and polluted rivers and streams.”

The Other Distance attempts to “connect the wealthy with the new-middle and low class urbanization models” by looking at San Pedro Garza García, which is one of the richest municipalities in Mexico, and easily the wealthiest part of the Monterrey Metro Area. Quoting geographer David Harvey on the “inter-connectivity between urbanization and capital accumulation”, Cartagena explores the economic contrasts that have created two distinct spaces (based on wealth), one that lacks specific “social cohesion space” such as parks, not designed to take into account “infrastructure, hospitals or education centers”, and one occupied by the wealthy sectors of society where such things are considered their “right”. Cartagena recognizes that both these spaces have an interdependent symbiotic relationship.

Copyright: Alejandro Cartagena; all rights reserved. Image from "suburbia mexicana"; reproduced by kind permission.

Copyright: Alejandro Cartagena. Image from "suburbia mexicana". Reproduced by kind permission.

Urban Holes depicts abandoned spaces in downtown Monterrey, so “highly overpriced by market speculation” that “investors look to un-urbanized land to create new developments that are lacking all kinds of infrastructure”.

The People of Suburbia, the final section, is based on a return to some of the areas photographed previously, including the municipality of Juárez, where urbanization has led to the population tripling since 2002. It is a “visual study of the unending capitalist endeavor of urban growth”.

In Cartagena’s own words, the photos of “suburbia mexicana” “depict a global issue from a local perspective” and one his intentions is “to point out the struggle our contemporary world faces between the ideals of capitalism and the striving and desire for fairer and more equal cities in which to live.” As such, this splendid collection of photographs certainly deserves the widest possible audience.

If you like Alejandro Cartagena’s work, you may like to know that he has published a book of “suburbia mexicana”, available via his website.

For more details about the Monterrey Metropolitan Area, see this 2008 paper by Dr. Peter Ward:

Mexico has more World Heritage sites than any other country in the Americas

 Other  Comments Off on Mexico has more World Heritage sites than any other country in the Americas
Mar 172012
 

The status of World Heritage site is a UNESCO (United Nations Educational, Scientific and Cultural Organization) denomination. The status is conferred on selected sites under the terms of “The Convention Concerning the Protection of the World Cultural and Natural Heritage”, adopted at UNESCO’s 17th General Conference in November 1972 and subsequently ratified by 189 member states.

Nations were invited to submit their proposals for any cultural or natural sites that they considered “of outstanding universal value”, and therefore eligible for inclusion on the World Heritage list. All proposals have to be approved by a special UNESCO World Heritage Committee.

The attraction of having a site classified as a World Heritage site is that it affords extra possibilities for obtaining technical co-operation in matters relating to conservation, for international assistance for research, training and equipment, and for emergency assistance in the event of damage due to specific natural or man-made disasters. All these sites are also valuable as cultural or environmental tourism destinations.

The list was first published in 1978, at which time it mainly featured European sites. Since then, regular additions have been made. As of March 2012, the list includes 936 locations in 153 member states. Of these sites, 725 are considered to have cultural significance, 183 to have natural importance and there are also 28 which share both cultural and natural value.

Mexico has 31 sites on the list, considerably more than any other country in the Americas. For example, the U.S. has 20 (together with a share of a 21st that straddles the border with Canada), Brazil 17 (as well as one jointly held with Argentina), Canada 14 (plus the joint U.S.-Canada site) and Peru 11.

Worldwide, only five countries have more World Heritage sites than Mexico. Four of these countries are in Europe: Italy, Spain, Germany and France. The other country is China.

Mexico’s existing World Heritage sites

Date added to list  – Name of site (state in brackets)

1987 Sian Ka’an biosphere reserve (Quintana Roo)
1987 Pre-Hispanic city and national Park of Palenque (Chiapas)
1987 Historic Center of Mexico City and Xochimilco (Mexico D.F.)
1987 Pre-Hispanic city of Teotihuacan (State of Mexico)
1987 Historic Centre of Oaxaca and archaeological site of Monte Alban(Oaxaca)
1987 Historic Centre of Puebla (Puebla)
1988 Historic town of Guanajuato and Adjacent Mines (Guanajuato)
1988 Pre-Hispanic city of Chichen-Itza (Yucatán)
1991 Historic Centre of Morelia (Michoacán)
1992 Pre-Hispanic city of El Tajin (Veracruz)
1993 Whale Sanctuary of El Vizcaino (Baja California)
1993 Historic Centre of Zacatecas (Zacatecas)
1993 Rock Paintings of the Sierra de San Francisco (Baja California)
1994 Earliest 16th-Century monasteries on the slopes of Popocatepetl (Morelos)
1996 Prehispanic town of Uxmal (Yucatán)
1996 Historic Monuments, Zone of Querétaro (Querétaro)
1997 Hospicio Cabañas, Guadalajara (Jalisco)
1998 Historic Monuments, Zone of Tlacotalpan (Veracruz)
1998 Archeological Zone of Paquimé, Casas Grandes (Chihuahua)
1999 Historic fortified town of Campeche (Campeche)
1999 Archaeological Monuments, Zone of Xochicalco (Morelos)
2002 Ancient Maya City and biosphere reserve of Calakmul (Campeche)
2003 Franciscan Missions in the Sierra Gorda (Querétaro)
2004 House and Studio of Luis Barragán (in Mexico City)
2005 Islands and protected areas of the Gulf of California
2006 Agave landscape and old tequila-making facilities in Amatitán, Arenal and Tequila (Jalisco)
2007 Central University City Campus of the Universidad Nacional Autónoma de México (UNAM) (Mexico City)
2008 Monarch Butterfly Biosphere Reserve (Michoacán and State of México)
2008 San Miguel de Allende and the Sanctuary of Jesús de Nazareno de Atotonilco (Guanajuato)
2010 Camino Real de Tierra Adentro, the 2,900 kilometer historic route linking Mexico City to Santa Fe in New Mexico
2010 Prehistoric caves of Yagul and Mitla in the Central Valley of Oaxaca

Mexico’s proposed World Heritage sites:

Mexico has formally proposed numerous additional sites for World Heritage Status. The applications are coordinated by the National Anthropology and History Institute (Instituto Nacional de Antropología e Historia), better known by its Spanish acronym INAH. Proposals include:

1.  Historic town of San Sebastián del Oeste (Jalisco)
2. Tule (ahuehuete) tree of Santa María del Tule (Oaxaca)
3. Zempoala aqueduct, a project of Padre Tembleque (Hidalgo and State of Mexico)
4. Monterrey’s old industrial facilities, including a foundry, brewery and glassworks (Nuevo León)
5. The Aguascalientes railroad station and residential complex (Aguascalientes)
6. The Museo Casa Estudio Diego Rivera and Frida Kahlo (Mexico D.F.)
7. Ludwig Mies van Der Rohe and Félix Candela’s industrial buildings, including the offices of Bacardí y Compañía (State of Mexico)
8. Historic city of San Luis Potosí (San Luis Potosí)
9. Chapultepec Woods, Hill and Castle (Mexico D.F.)
10. Historic town of Alamos (Sonora)
11. Pre-Hispanic city of Cantona (Puebla)
12. The church of Santa Prisca in Taxco (Guerrero)
13. The former Jesuit college in Tepotzotlán (State of Mexico)
14. The churches of the Zoque province (Chiapas)
15. The pre-Hispanic city of Chicomostoc-La Quemada (Zacatecas)
16. Archaeological monuments, zone of Mitla (Oaxaca)
17. Cuatrociénegas flora and fauna reserve (Coahuila)
18. Franciscan convent and Our Lady of the Assumption cathedral in Tlaxcala (Tlaxcala)
19. Historical town of the Royal Mines of Cosala (formerly known as the Royal of the Eleven Thousand Virgins of Cosala) (Sinaloa)
20. Huichol Route used by Huichol Indians through their sacred sites to Huiricuta (San Luis Potosí) (sometimes spelt as Wirikuta)
21. The former textile factory La Constancia Mexicana and its housing area (Puebla)
22. The Lacan-Tún—Usumacinta region (Chiapas)
23. The Banco Chinchorro Biosphere Reserve(offshore in Quintana Roo)
24. The El Pinacate and the Great Altar Desert Biosphere Reserve (Sonora)
25. The Selva El Ocote Biosphere Reserve (Chiapas)
26. Sotáno del Barro, a 450-meter-deep sinkhole (Querétaro)
27. Tecoaque archaeological site (Tlaxcala)
38. Valle des Cierges, including Montevideo Canyon (Baja California)

Not all sites are accepted. For instance, Mexico’s rejections include the Lake Pátzcuaro region, in the state of Michoacán, and the El Triunfo nature reserve.

Mexicans are justly proud of their nation’s history and culture, and have always been prepared to share them with visitors. By getting so many locations on UNESCO’s list of World Heritage sites, the country is reaffirming its commitment to trying to ensure that its cultural and natural treasures are well protected for future generations. Any of the places mentioned in this article is well worth visiting and exploring. In some cases, it is possible to construct fascinating “itineraries” combining several of the sites in a single trip.

Bear in mind, though, that there are also numerous attractions not yet listed as World Heritage sites that probably deserve to be included in the future. For starters, how about Paricutin Volcano, one of only a handful of new volcanoes to appear on land in historic times? Or how about the Copper Canyon region, with its grandiose scenery and indigenous Tarahumar population?

For more information:

Related articles:
 

How does money laundering work, and what is being done about it?

 Other  Comments Off on How does money laundering work, and what is being done about it?
Mar 152012
 

How is drugs money laundered?

Drug funds have allegedly financed hotels, car dealerships, bus companies, airlines, casinos, beauty salons, skyscrapers and restaurants, as well as the lavish lifestyles of individual cartel members who acquire gold jewelry, expensive cars, vehicles, yachts and planes.

Trade-based laundering” is on the rise. Drug cartels are reported to be increasingly using regular cross-border trade to launder their ill-gotten gains. Profits from the sale of drugs in the USA and elsewhere are used to purchase truckloads of goods such as fruit, toys and fabric, which are then sent south to Mexico to be sold for pesos. This cross-border trade effectively changes US dollars into pesos with few questions being asked.

In a variation on the theme, the dollars are used to buy things such as toys or fabric from a third country such as China. The goods are then exported to Mexico and resold. The net effect is the same: dollars become pesos, ready to help pay for the next shipments of drugs. Trade-based laundering is hidden in the massive regular trade-flows between Mexico and the USA which total almost 400 billion dollars a year. Authorities always seem to be one step behind the cartels, partly because, as this LA Times article points out, cartel bosses are “among the world’s most expert transnational entrepreneurs”. Indeed, the sheer scale of the drug money flows threatens to overwhelm Mexico’s police and security forces.

Drug money is being transferred via a variety of means, from cash transfers (formal or informal) and deposits in bank accounts to the purchase of goods and services (including pirated merchandise).

How can money laundering be reduced?

In recent years, Mexican authorities have focused more attention on chasing the money involved in the drugs trade. Government officials claim that more than $50 billion in drugs money is laundered each year, more than the value of Mexico’s oil exports and equivalent to 3% of GDP. Mexico’s laws are barely keeping up with the ingenuity of money launderers, and convictions for money-laundering are rare.

What has Mexico done to try and prevent money laundering? There are now strict limits on the use of US dollars in Mexico, and on cash deposits into bank accounts. The latest tightening of the rules extends the reporting of higher value US dollar transactions to all real estate offices, car dealerships, betting parlors, art galleries and public notaries. Any purchases using cash for items such as vehicles costing over about $14,000, and for real estate over about $70,000 are now automatically reported to federal authorities.

As Mexico tightens its accountancy rules, drug gangs may have to keep more of their funds in the USA or go elsewhere. Mexico is becoming a much less friendly place for the drug cartels’ informal “retirement funds”.

Map of Oaxaca state, with an introduction to its geography

 Maps  Comments Off on Map of Oaxaca state, with an introduction to its geography
Mar 122012
 

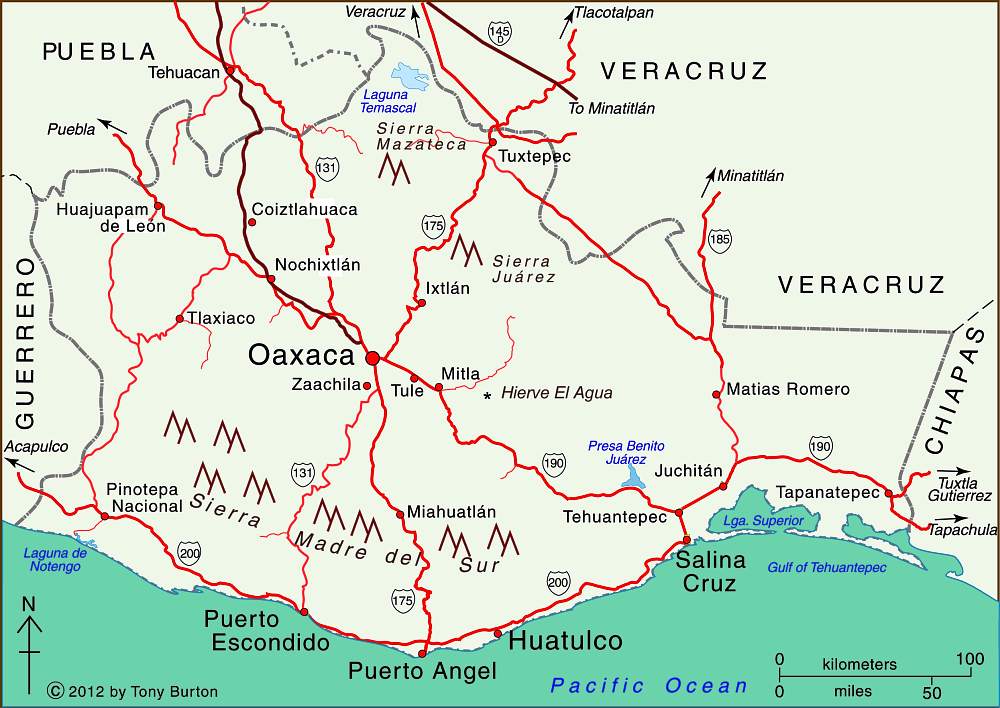
The state of Oaxaca is Mexico’s fifth largest state, with an area of  93,793 square kilometers (4.8% of the national total) and Mexico’s tenth most populous state, with 3.8 million inhabitants in 2010.

The state has considerable variety in terms of relief, climate and natural vegetation, and has about 570 km of shoreline bordering the Pacific Ocean. Oaxaca City, the centrally located state capital, is an important city for tourism as are three towns on the coast—Puerto Angel, Puerto Escondido and Huatulco.

The eastern part of Oaxaca state is part of the low-lying Isthmus of Tehuantepec, once considered as an alternative location to Panama for a trans-continental canal. In recent years, the Tehuantepec area has received massive investments in wind power, with several major wind farms already operational and more on the drawing board.

Map of Oaxaca state, Mexico. Copyright Tony Burton;

Map of Oaxaca state, Mexico. Copyright Tony Burton; all rights reserved. Click map to enlarge

Oaxaca state state has greater linguistic and cultural diversity than any other state in Mexico. According to the National Commission for the Development of Indigenous Peoples, more than 1.5 million people in Oaxaca live in a home where at least one of the residents either speaks an indigenous language or considers themselves indigenous (even if they do not speak an indigenous language).

About one million inhabitants of Oaxaca, 35% of the state’s total population, speak one or more indigenous language. The largest indigenous linguistic groups in the state include about 350,000 Zapotec, 230,000 Mixtec, 165,000 Mazatec, 100,000 Chinantec, 100,000 Mixe, and 40,000 Chatino.

Related posts:

Mexico City has largely escaped drug violence

 Other  Comments Off on Mexico City has largely escaped drug violence
Mar 082012
 

Previous posts have analyzed drug war death rates in Mexican states, cities over 500,000, the most violent municipalities and areas of particular interest to expatriates. This post focuses on Mexico City or D.F. (Distrito Federal). We focus on D.F. because the rate of drug war deaths is exceptionally low there, less than one eighth the national average.

In all of 2010 there were 191 drug war deaths in D.F. [note 1] compared to 122 in the first nine months of 2011. [note 2] While this might sound like a large number of deaths, we must remember that there are almost nine million people in D.F.  The 2011 drug war death rate per 100,000/yr in D.F. was 1.8 compared to a national rate 15.3 and a rate of 134 in Acapulco. [note 3] The rate for D.F. declined 15% from the 2010 rate while the rates for all of Mexico and Acapulco increased by 13% and 187% respectively. Today, people seeking better security are moving into D.F. from other cities in the country.

Why are the rates in D.F. so low? In previous decades D.F. was thought to be one of the most violent places in the country, but this is no longer the case. The total murder rate for D.F. is half the national rate [note 4] and less than a third that of Washington, DC. [note 5] A major reason is that D.F. has a more competent, better organized, better paid and less corrupt police force than any of the other cities. The fact that the national government is in D.F. also helps as do more effective youth programs. That D.F. has higher overall income levels is also a factor. Some even speculate that major cartel bosses have family in D.F. and have an unspoken agreement to avoid violence in the capital [note 6].

The drug war death rates are quite low in all parts of the city. The wealthy delegation of Cuajimalpa in western D.F. had zero deaths in 2011 compared to 11 a year earlier. In 2010 it had the city’s highest rate of 5.9, but this was still less than half the national average. Relatively sparsely populated Milpa Alta in the southeast also had zero deaths in 2011. Cuauhtemoc and Venustiano Carranza, two central delegations, had the highest rates in 2011, but they both less than a third the national average.

The 13 suburban municipalities adjacent to D.F. in the State of Mexico experienced 331 drug war deaths in 2011, almost three times the number in D.F. These suburbs with a total population of just over six million had a combined drug war death rate of 7.3, four times as high as D.F. While the death rate in these municipalities increased 42% over the 2010 level, it was still less than half the national average. Based on the data presented above, it is not surprising that people worried about drug violence would rather live in or near D.F. than in most other cities, especially those in northern and western Mexico.

Notes:
  1. “Mexican drugs war murders data mapped”, The Guardian, posted by Johanna Tuckman, Jan 14, 2011. http://www.guardian.co.uk/news/datablog/2011/jan/14/mexico-drug-war-murders-map. For data see: http://www.google.com/fusiontables/DataSource?dsrcid=393962.
  2. “Van mas de 47 mil muertos por nacroviolencia: PGR”, El Universal, 12 January 2012, http://www.eluniversal.com.mx/notas/822078.html.
  3. The rates for 2011 were adjusted because data are available for only the first nine months of the year.
  4. “Is Mexico City safe from drug cartel war – or the next target,” CNN, January 17, 2012, .http://www.cnn.com/2012/01/17/world/americas/mexico-city-security/index.html
  5. “Mexico’s violence not as widespread as seems,” USAToday, 3 August 2010. http://www.usatoday.com/news/world/2010-08-03-Mexico-drug-violence_N.htm.
  6. Is Mexico City safe from drug cartel war — or the next target,” CNN, January 17, 2012, .http://www.cnn.com/2012/01/17/world/americas/mexico-city-security/index.html.
Mar 072012
 

Artificial reefs are usually created by sinking a ship (after it has been thoroughly cleaned to prevent any toxic substances from entering the marine environment) or some other massive metal or concrete structure. Marine sediments gradually collect in, on, and around the objects, which are rapidly colonized by marine life. For rapid reef building, individual corals are sometimes transplanted onto the new structures.

The latest artificial reefs in Mexico are works of art. Jason deCaires Taylor, a British artist and dive instructor, has built an extraordinary collection of concrete sculptures and then carefully positioned them underwater in a marine park near Cancún, Mexico’s most popular tourist resort. The objective was to create an underwater “museum”, which divers and snorkelers can explore, while simultaneously providing a variety of structures for sea-life to inhabit.

One of the more remarkable sculptures is entitled “The Archive of Lost Dreams”. It features a librarian (pet dog at his feet) caring for and cataloging a collection of messages in bottles into “hopes”, “fears”, etc.. Another of the sculptures is a full-size model of the iconic Volkswagen Beetle.

The art-park, begun in 2009, is planned to house 400 sculptures in all and is billed as the largest underwater art museum in the world.

Another work now under construction is modeled on the ears of every child in a grade school class; it will be fitted with a hydrophone to enable marine biologists to analyze reef sounds (New Scientist, 17 December 2011).

Marine grade concrete is used for the exhibits, which are built to withstand a Category 4 hurricane. It is anticipated that hard and soft corals will eventually cover the sculptures, partially making up for the damage done to natural reefs by storms, tourists and boats, and reducing visitor pressure on the natural reefs. The natural reef off the coast of Quintana Roo, is part of the Mesoamerican Reef, the longest coral reef in the northern hemisphere and the second largest coral reef in the world. It is under constant pressure from coastal developments such as new hotels and cruise ship berths, as well as from climate change. The marine park near Cancún is visited by about 800,000 tourists a year.

The artist may think his idea is laudable, but not everyone is convinced. Critics argue that art works are not a good fit with the natural world, and why try to improve on nature? In addition, if artificial reefs are not carefully sited and well managed, they may be torn loose during storms and then cause extensive damage to any nearby natural reefs.

Related posts:

Mar 052012
 

In a previous post–The development of Huatulco, the tourist resort in southern Oaxaca–we looked at how the tourist resort of Huatulco was created by Mexico’s National Tourism Development Fund (Fonatur) on a series of small bays in the state of Oaxaca. Clearly, this development was very much “top-down” and it has been widely criticized from many distinct points of view. From a geographical perspective, the most important criticisms have arisen from researchers such as Evelinda Santiago Jiménez and David Barkin, co-authors of a short article entitled “Local Participation and Sustainability: a study of three rural communities in Oaxaca, Southern Mexico.”

Their view is that government programs, such as Huatulco, “are generally conceived for areas where there are resources that can be transformed into commodities”. In the case of Huatulco, this means that “access to public services, such as potable water, is designed to satisfy the demands of the visitors and affluent local service providers, while the majority suffer from inadequate supplies and must accept the conditions imposed on them.” Santiago Jiménez and Barkin see this as “a new form of colonization, implemented in the name of modernity to expropriate communal lands with minimal guarantees and compensation; a process of excluding local peoples; a way to subordinate the local inhabitants…; and a process than causes harm to the environment.”

The article by Santiago Jiménez and Barkin appears in a book entitled Nature’s Revenge: Reclaiming Sustainability in an Age of Corporate Globalization (University of Toronto Press/Garamond 2006). This book, which in its own words, “proposes a radical definition of sustainability, reclaiming the word from the rhetoric typically used by corporations and governments to facilitate unrelenting economic growth and the notion of ‘business as usual'”, is well worth reading.

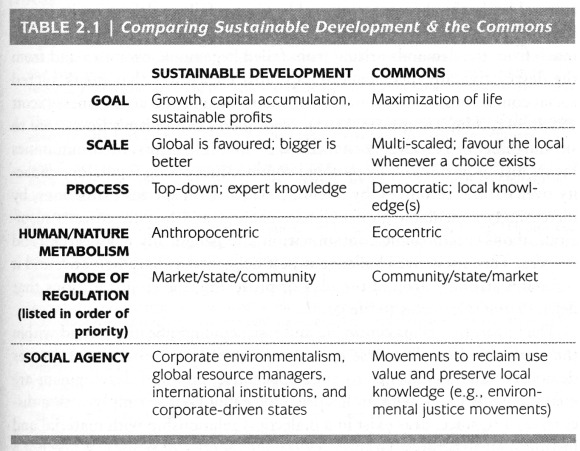
The authors argue for adopting a “commons”-based approach, where the term “commons” is understood to include not only the idea of commonly-held or shared rights and property (such as water, air, soil) but also the “social commons” comprised of community knowledge and culture. In stressing “the complex interrelations that exist at local, regional, national, continental, and global levels of human organization”, the authors critique advocates of “localism” and argue that “there can be no simple solution confined to one particular scale of action.”

A table in Chapter Two (Who cares about the Commons? by Josée Johnston) summarizes the key differences between sustainable development (as used by corporations and governments) and the commons-based approach favored by the book’s authors:

Table 2.1 of "Who cares about the Commons" by Josée Johnston.
Table 2.1 of “Who cares about the Commons” by Josée Johnston.

It is an example of this commons-based approach that Santiago Jiménez and Barkin examine in their chapter. They analyze an alternative, locally initiated project, based on the Integrated Development of Natural Resources (Administración Integral de los Recursos Naturales, AIRN), which stands in sharp contrast to Fonatur’s “top-down” development model. The AIRN approach recognizes that local communities have a symbiotic relationship with their surrounding natural environment that is “crucial for mutual survival”. It also recognizes that the community-environment links are dynamic, not static, and will change or evolve with time as the community develops.

AIRN proposals aim, essentially, to speed up this development process, helping to find new productive projects for the communities while managing ecosystems effectively and sustainably. The success of AIRN development projects relies on an active participation by the local community to identify issues, opportunities and ways to progress. It is crucial that the local people are equal partners in the decision-making process.

In the Huatulco area, the Center for Ecological Support (Centro de Suporte Ecológico, CSE), an NGO, adopted an AIRN approach to devise appropriate strategies to reverse the damage done to water resources by the construction and expansion of Huatulco tourist resort, which had destroyed forest cover, reduced infiltration and abstracted water from the aquifer that underlies the Copalita River. The CSE proposed a reforestation program to actively regenerate (not just protect) the forests throughout the basin, including parts of the Southern Sierra Madre (Sierra Madre del Sur). At the same time, the CSE helped local inhabitants to explore new (alternative) sources of employment and income based in their communities, which offered them a viable option to abandoning their land and accepting menial low-paid  jobs in the tourist resort or elsewhere.

Santiago Jiménez and Barkin looked at three small villages that had participated in the AIRN proposals made by the CSE: Santa María Xadani, Santa María Petatengo and El Achiote. Each village had participated in different ways, and with varying degrees of success. Close familial ties in Petatengo, for example, ensured more community support than in Xadani where internal divisions reduce social cohesion. El Achiote is a small “rancho” of 14 families, all of whom participated in the reforestation project. The families also combine to carve and paint the colorful Oaxacan whimsical wooden figures known as “alebrijes”. The settlement gained electricity service in 2000 and telephone service in 2001. Sadly, a combination of circumstances led to many local inhabitants migrating away from the area in search of better incomes and the CSE was forced to suspend its operations.

The authors point out that development plans have to take account of three very different concepts of time. The local communities in this region view time as somewhat flexible, preferring to make decisions by consensus, rather than in order to meet any deadline. Organizations providing funding for projects see time in terms of deadlines and financial commitments. Local and state governments view time in terms of political cycles, with a project having more chance of success if it is launched early on in an administration’s term. Santiago Jiménez and Barkin also emphasize the importance of projects having an effective mediator (as the CSE proved to be) “capable of balancing the rhythms of Western culture, of nature, and of traditional culture”.

Mexico badly needs more examples of successful mediators, particularly where large scale tourism projects are concerned.

Related posts:

Drug war death trends in areas of Mexico of interest to foreign tourists and retirees

 Other  Comments Off on Drug war death trends in areas of Mexico of interest to foreign tourists and retirees
Mar 022012
 

Non-Mexicans are far more interested in some parts of Mexico than others. These areas of interest may be well-known tourist destinations, have thousands of expatriate residents or are located on major expatriate travel routes. Mexico’s major cities, which are also of interest to foreigners, were discussed in a previous post. This post focuses on 24 municipalities of less than 500,000 population. (These are listed alphabetically in the table linked to at the end of the post.)

Drug war death rates vary enormously among the 24 communities. Data released by the Office of the President [note 1] indicate that some of these municipalities have extremely high drug war death rates. The number of deaths in Zihuatanejo went from 16 in 2010 [note 2] to a startling 90 in the first nine months of 2011. This results in a rate of 115 deaths per 100,000 population/yr or over seven times the national average of 15.3 [note 3]. This places Zihuatanejo among the 20 most dangerous communities in Mexico (see earlier post) along with the other famous Guerrero beach resort of Acapulco.

Other dangerous municipalities listed in the table are Tepic, Nayarit at 69 (4.5 times the average); Mazatlán at 58 (3.8 times the average) and Nuevo Laredo at 50 (3.3 times the average). Thousands of expatriates live in Mazatlán while thousands drive through Tepic and Nuevo Laredo. The temporal trends in these dangerous cities vary widely. Between 2010 and 2011, the rate for Zihuatanejo went up 650% while Nuevo Laredo’s increased by 67% and Tepic edged up 14%. The rate for Mazatlán was down 20%.

The most worrisome trend is the very rapid drug violence increase in Veracruz State. From 2010 to 2011 the death rate for Xalapa went up 1,066%. In 2010 there were a total of 15 drug war deaths in Xalapa, Boca del Río and Veracruz City combined; but in the first nine months of 2011 this went up to 284. It remains to be seen if this dreadful trend will continue into 2012 and beyond.

Other cities in the table with rates significantly above the national average include Nogales with a rate of 28, down 68% from 2009. The rate for Playas de Rosarito (Baja California) was up 41% to 28, nearly double the average of 15.3. Matamoros’ rate increased 13% to 20 while Cuernavaca’s was down 49% to 19.

The death rates in towns near Lake Chapala varied markedly. The rate for Ixtlahuacán de los Membrillos dropped from 34 in 2010 to 16 in 2010, but was still above the national average and twice the rate of neighboring Chapala. The rate for nearby Jocotepec of 13 was between the other two. Though local media suggest a growing drug violence problem in these three communities, the actual number of deaths dropped from 24 in 2010 to 12 in 2011. The death rate for the three communities dropped from 34% above average in 2010 to 33% below average in 2011.

The great news is that three of communities in the table—Bahia de Banderas, Guanajuato and San Miguel de Allende—had zero drug war deaths in the first nine months of 2011, compared to 27 in 2010. Bahia de Banderas, in Nayarit just north of Puerto Vallarta, is of particular interest because it had 19 deaths in 2010. If this precipitous drop is not a statistical anomaly it represents a major anomaly because the number of deaths in the adjoining community of Puerto Vallarta almost doubled from 15 in 2010 to 28 in 2011; furthermore there were 196 deaths in nearby Tepic.

Several tourist areas had drug war death rates less than a sixth the national average. These include Ensenada, La Paz and Los Cabos on the Baja Peninsula as well as Oaxaca City. Not far behind was Playa del Carmen with a rate about one quarter of the average. These data suggest that tourists worried about drug violence and seeking a beach resort vacation might lean toward Baja California Sur or the Maya Riviera instead of Acapulco, Zihuatanejo or Mazatlán.

Notes:

[1] “Van mas de 47 mil muertos por nacroviolencia: PGR”, El Universal, 12 January 2012, http://www.eluniversal.com.mx/notas/822078.html.

[2] “Mexican drugs war murders data mapped”, Theguradian, posted by Johanna Tuckman, Jan 14, 2011. http://www.guardian.co.uk/news/datablog/2011/jan/14/mexico-drug-war-murders-map. For data see: http://www.google.com/fusiontables/DataSource?dsrcid=393962.

[3] The rates for 2011 were adjusted because data are available for only the first nine months of the year.

Mexico and USA sign agreement for development of Gulf of Mexico oil reserves

 Updates to Geo-Mexico  Comments Off on Mexico and USA sign agreement for development of Gulf of Mexico oil reserves
Feb 272012
 

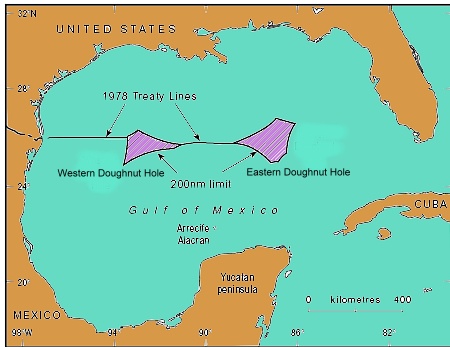
The USA and Mexico share the Gulf of Mexico, with periodic arguments about the precise offshore limits of each country’s jurisdiction. An earlier post includes a brief summary of the history of negotiations over this contentious maritime boundary:

The reason this boundary matters is because the deep waters of the Gulf of Mexico are thought to have massive deep-water oil and gas fields. The USA has encouraged major oil multinationals such as Shell and BP to explore relatively deep parts of the Gulf, those lying more than 500 meters or 1,640 feet below sea level.

location of doughnut holesDeveloping these fields requires advanced, specialist deep-water drilling techniques, which only a small number of major international (multinational) oil firms currently have the expertise to undertake. As was seen not long ago, accidents in these fields can be very difficult to avoid and any resulting damage very difficult to clean up:

The legal battle connected to that spill has been postponed; it had been due to start today (27 February 2012) in a New Orleans court. The April 2010 accident killed 11 oil workers and released up to 5 million barrels of oil into the Gulf.

In the Mexican sections of the Gulf of Mexico, very little oil exploration and development has yet been carried out. All oil exploration and development in Mexico is managed by state-owned oil giant Petroleos Mexicanos (Pemex), though they can contract other firms to undertake work on their behalf if or when needed. Pemex is the world’s third-largest oil producer and the largest contributor to Mexico’s federal budget. It is one of the very few oil companies worldwide that manages all aspects of the productive chain, from exploration to refining and marketing. Pemex has had more than its fair share of serious environmental issues:

Mexican experts believe that up to 29.5 billion barrels of oil might reside in Mexico’s share of the Gulf, but Pemex has little to show for almost a decade of deep-water drilling apart from some relatively minor gas finds.

A few days ago, Mexico and the USA finally signed an accord that, in the words of Mexican President Felipe Calderón, “ensures that each country can develop its corresponding oil and natural gas deposits in the trans-border area of the Gulf of Mexico.” In a joint formal statement, Mexico’s Foreign Affairs and Energy Secretariats said that the “historic” agreement “will generate the necessary legal certainty for the long-term development of resources that may be found in that area.” It remains to be seen just how quickly and efficiently Pemex can actually take advantage of the deep-water drilling opportunities that the new agreement is designed to safeguard.

Related posts:

Drug war impacts extend to child arrests, border tunnels and stressed zoos

 Mexico's geography in the Press  Comments Off on Drug war impacts extend to child arrests, border tunnels and stressed zoos
Feb 252012
 

More children being arrested

One extremely unwelcome development in the war on drugs is that an increasing number of young adolescents (aged 11 to 17) are involved in drug smuggling and related activities, according to U.S. Drug Enforcement Administration and U.S. Immigration and Customs Enforcement (ICE). Most of the children are Hispanic, and many hold US citizenship. They are enticed by the lure of “easy” money and know they that, if caught, they can be tried only as juveniles. The Gulf cartel and the Zetas reportedly pay adolescents an average of $500 to smuggle drugs, and $1,000 to guard a kidnap victim for a month. In southern California, the number of arrests of adolescents has risen sharply, with charges ranging from drug trafficking to extortion and kidnapping.

Where are most drug tunnels?

Several major cross-border drug tunnels have been unearthed in the past few months, including one linking warehouses in Tijuana and San Diego which contained 32 tons of marijuana. This tunnel, 600 meters long, was particularly sophisticated and used electric rail cars. More than 70 cross-border tunnels have been found since October 2008.

Significant clusters of tunnels have been found in three main areas:

  • San Diego,
  • California’s Imperial Valley, where the clay soil makes for easy excavation
  • Nogales (Arizona), a city underlain by a network of existing underground drainage canals

Mexico’s zoos struggle to cope with unexpected influx of exotic animals

Press reports such as Captured Drug Kingpin’s Pets Strain Mexican Zoos have highlighted the problems resulting when rare and dangerous animals are confiscated from drugs cartel leaders. Several major cartel figures have amassed extensive private collections of exotic animals, from ostriches and parrots to monkeys, tigers, lions and giraffes. For example, when Jesús “The King” Zambada, a powerful member of the Sinaloa drug cartel, was arrested in mid-2011, authorities had to find new homes for several hundred animals, many of them exotic species. The nation’s zoos are struggling to cope with the influx of so many unexpected new arrivals.

Drug capos do not view animals only as a status symbol. They are also a means to hide drug shipments. Animals have also regularly been used in drugs trafficking. In recent years, grisly finds have included frozen sharks stuffed with cocaine, cocaine-fed snakes, and even liquid cocaine in shipping containers used for tropical fish.

Related posts:


Which Mexican communities have the highest drug war death rates?

 Other  Comments Off on Which Mexican communities have the highest drug war death rates?
Feb 232012
 

In a previous post we noted that big Mexican cities with populations of over 500,000 have drug war death rates about 40% higher than the rest of Mexico. However the highest rates of all are in small northern municipalities which have experienced very high levels of drug violence.

Mier, Tamaulipas was the most dangerous municipality in 2011 as it was in 2010. Though the number of drug war deaths in the town of 4,768 (2010) decreased from 93 in 2010 [note 1] to 50 in the first nine months of 2011 [note 2], it still led the country with 1,398 drug war deaths per 100,000/yr [note 3]. This is 91 times the rate for all of Mexico which was 15.3 in 2011 and also over ten times as dangerous as Acapulco, the large city with the highest rate of drug violence. Actually the death rate per population for Mier is probably higher because the mayor estimates that a third of the population may have fled the violence-prone town [note 4]. Mier is only about eight kilometers (five miles) from the Texas border and roughly midway between Nuevo Laredo and Reynosa. The municipality may be a bit more peaceful now that the Mexican military has occupied the town.

Guerrero, Mier’s immediate neighbor to the northwest with a population of 4,468, ranked second with a death rate of 1,045 or roughly 68 times the average. Both Guerrero and Mier are located between two warring drug cartels, the Zetas and the Gulf Cartel. Mier’s other neighbor along the Rio Grande, Miguel Alemán, fared somewhat better. Its death rate dropped from 407 in 2010 to 114 in 2011; but its 2011 rate was still over seven times the national average. The data reveal that municipalities along the border between Nuevo Laredo and Reynosa are among the most dangerous in all of Mexico. Interestingly, the rate for Reynosa itself was only 11 or about 27% below the average.

In third place is San Fernando, also in Tamaulipas, with a death rate of 680, about 44 times the average. This community of 57,220 suffered 292 deaths in 2011. Over half of these deaths were discovered in mass graves of Central Americans who were trying to immigrate to the US, but were kidnapped and murdered by drug cartels.

Next on the list are three small municipalities in Chihuahua – Guadalupe (rate of 496), Gran Morelos (373) and Cusihuiriachi (369). The 2011 death rates in these towns were 24 to 32 times the national average. While the rate for Guadalupe declined 42% since 2010, the rates for Gran Morelos and Cusihuiriachi were up 50% and 150% respectively. As mentioned in an earlier post, the State of Chihuahua had the highest 2011 drug war death rate among Mexico’s 32 states.

Drug war death totals in small communities can change dramatically from year to year. For example, Saric, Sonora with a population of 2,703 had 30 deaths in 2010 and zero in 2011. General Bravo, Nuevo Leon had 18 deaths in 2010 and zero in 2011 while Yecora, Sonora had 18 deaths in 2010 and only one in 2011. The number in General Treviño, Nuevo León went from 21 down to only two, but it still had the 8th highest rate among Mexico’s municipalities.

On the other hand, drug war deaths in Boca del Rio, Veracruz went from 2 in 2010 to an alarming 94 in 2011. This resulted in a rate increase of 6,167% and a rate six times the average. The rate for Zihuatanejo de Azueta, Guerrero increased by 650%; that of Yurécuaro, Michoacán went up by 452% while that for Cosalá, Sinaloa was up 317%, giving it a rate 13 times the average.

Zihuatanejo de Azueta is different than many of the other communities with very high drug war death rates because it has a rather large population of 104,609 and includes the famous international resort of Ixtapa. The number of drug war deaths in the municipality went from 16 in 2010 to a very disturbing 90 in 2011, giving it a death rate of 115, almost as high as Acapulco’s rate of 134. Certainly, the high drug war death rates in Zihuatanejo and Acapulco have damaged their tourism industries.

Twenty municipalities had drug war death rate in 2011 higher than 100 per 100,000/yr or about seven times the national average (see table). Two of these are the large municipalities of Ciudad Juárez and Acapulco. The 20 communities are spread across six northern and western states: six in Chihuahua, five in Tamaulipas, three in Guerrero, two in Sinaloa and Michoacán, and one each in Sonora and Nuevo León. Before randomly traveling in areas of these states, it would be a good idea to check local media and bulletin boards for indications of recent drug violence.

Notes:

[1] “Mexican drugs war murders data mapped”, The Guardian, posted by Johanna Tuckman, Jan 14, 2011. http://www.guardian.co.uk/news/datablog/2011/jan/14/mexico-drug-war-murders-map. For data see: http://www.google.com/fusiontables/DataSource?dsrcid=393962.

[2] “Van mas de 47 mil muertos por nacroviolencia: PGR”, El Universal, 12 January 2012, http://www.eluniversal.com.mx/notas/822078.html.

[3] The rates for 2011 were adjusted because data are available for only the first nine months of the year.

[4] Christopher Sherman (AP), “Drug War: Despite army takeover, fear grips Mexican town”, Press-Telegram, Long Beach, CA, Dec 7, 2011. http://www.presstelegram.com/breakingnews/ci_19488405

Drug war deaths in Mexico’s biggest cities

 Other  Comments Off on Drug war deaths in Mexico’s biggest cities
Feb 182012
 

Drug war deaths occur in communities of all sizes, but they are a bit more likely in the biggest cities. However, there are gigantic geographic variations. For example, Acapulco, with a population of about 790,000, had 795 drug war deaths in 2011 (Jan–Sept) [note 1] while there were zero drug war deaths in Mérida, with 828,000 residents. Clearly drug cartel battles are very geographically concentrated.

Compared to the rest of the country, Mexico’s 37 largest municipalities with populations of over 500,000 experience about 40% more drug war deaths per 100,000 population than the rest of the country. These big cities account for about 36.5% of Mexico’s population and 44% of the drug war deaths in both 2010 and 2011.

In 2010, Ciudad Juárez was the drug war hotspot with 2,736 deaths for a rate of 206 per 100,000/yr compared to the national rate of 13.6 [note 2]. This dropped by a surprising 41% in 2011 to a rate of 121 [note 3]; but  Ciudad Juárez still led the nation’s death toll with 1,206 deaths. Acapulco’s 795 deaths gave it the highest rate among big cities of 134, up a frightening 186% over 2010. Other dangerous big cities with high drug war death rates include Torreón with a rate 99 (up 100%), Durango with 89 (up 244%), Chihuahua with 65 (down 20%) and Culiacán with 57 (down 17%).

Tijuana used to be a major center of drug violence, but not anymore. Between December 2006 and December 2009, it experienced 1,195 drug war deaths, behind only Ciudad Juárez with 3,699 and Culiacán with 1,303. Its death rate for that period was over four times the national average. But the number of deaths dropped from 472 in 2010 to 183 in 2011 bringing the rate down to 15.6, just above the national average of 15.3. In nearby Mexicali, the rate was only 4.1 in 2011, about a quarter of the average. The state of Baja California is no longer a key battleground in the Mexican drug war.

Drug violence deteriorated most rapidly in Veracruz City which went from 9 deaths in 2010 to 155 in 2011 resulting in a rate increase of almost 2,200%. This increased the rate to 37, nearly two and a half times the national average. Smaller cities in Veracruz State also experienced rapid increases. For example, Jalapa went up 1,066% and Bocas del Rio was up 6,167%. For the state as a whole, the rate was up over 300%. Clearly, the drug war has reached Veracruz.

Drug war violence has also increased rapidly in Monterrey where the number of deaths increased from 179 in 2010 to 399 in 2011, more than doubling its death rate. Deaths in Monterrey’s two large suburbs of Guadalupe and Apodaca also went from 91 to 220. While the rate in Monterrey was just above the national average in 2010, in 2011 it was up to 47, three times the average. Deaths in nearby Saltillo also went up rapidly, from 15 to 50, pushing its rate up by 344%.

Guadalajara also experienced an upsurge in drug violence. While its death rate went up 61% to 7.3 in 2011, this is still less than half the national average. However, the 2011 data do not include the 26 bodies dumped in the city in November 2011. Death rates were also up nearly 50% in Guadalajara’s two big suburbs of Zapopan and Tlaquepaque.

Surprisingly the Mexico City Federal District has been relatively free of drug violence. Total drug war deaths dropped from 191 to 122 pushing its 2011 rate down to only 1.8 deaths per 100,000/yr. This is only about one eighth the national rate. A future post will provide a more detailed analysis of drug violence in Mexico City.

In addition to Mérida, Tuxtla Gutierrez in Chiapas also had zero deaths in 2011. Other big cities with very low drug war death rates include Puebla (0.6), Querétaro (0.8), León (1.9), Toluca (2.1) and Villahermosa (2.5). Apparently drug cartels and their enemies have not been very active in these cities.

Notes:

[1] All the references for 2011 are for January through September based on the data released by Mexican Government

[2] “Mexican drugs war murders data mapped”, The Guardian, posted by Johanna Tuckman, Jan 14, 2011. http://www.guardian.co.uk/news/datablog/2011/jan/14/mexico-drug-war-murders-map. For data see: http://www.google.com/fusiontables/DataSource?dsrcid=393962.

[3] The rates for 2011 were adjusted because data are available for only the first nine months of the year.

Can Mexico’s decline in cacao production be reversed?

 Other  Comments Off on Can Mexico’s decline in cacao production be reversed?
Feb 162012
 

In a previous post, we looked at The geography of cacao production in Mexico. and saw how the area under cultivation and production have both fallen sharply since 2003. This post examines two recent projects that aim to reverse this recent trend of a steep decline in Mexico’s cacao production.

Major organic cacao project

The Agriculture Secretariat (Sagarpa) has several projects designed to rejuvenate Mexico’s cacao-growing sector. These include the production of young plants of high-yielding varieties, primarily in Tabasco for use in several southern states. Propagation method is either via grafting or via cuttings. (Tabasco is a leading centre for the development of tropical crops such as cacao, coconut palm and oil palm.)

In addition, Sagarpa is introducing improved methods of cultivation, harvesting and processing. The Secretariat is supporting a multi-phase plan to turn Mexico into the leading producer of organic cacao in the Americas. In the early phases, Maya Biosana will plant one million cacao trees to create 500 hectares (1200 acres) of irrigated orchards in 12 communities near Chetumal in Quintana Roo. The plan is to follow-up with similar numbers of new trees on additional land annually for another three years. The trees are expected to yield 2.4 metric tons of cacao per hectare (destined for high quality chocolates) and provide up to 2,000 additional jobs. [Note that the project is not without its critics, and we intend to write more about this in a future post].

NGO support for cacao producer cooperatives in Tabasco

One specific example of a project helping cacao farmers is the Chontalpa Cacao Presidium, a project initiated by the Slow Food Foundation. Tabasco’s most productive region for cacao is Chontalpa, which has ideal conditions for cacao cultivation and is the area where the criolla variety of cacao is thought to have originated.

Traditionally, farmers in the Chontalpa area have sold their cacao to intermediaries, who then market it. However, in recent years, groups (co-operatives) of farmers have been formed, enabling farmers to cut out the intermediaries and get higher prices for their harvest. The cooperatives allow joint purchasing and other economies of scale.

Serious flooding of cacao-growing regions in 2007 made it difficult for farmers to harvest and trade the cacao they had grown, and also helped spread the fungus Monilia roreri in their plantations. Many farmers gave up, sold their land and left for a new life elsewhere.

The Chontalpa Cacao Presidium was launched in September 2008 to help farmers rebuild the sector and introduce organic certification and other modern developments. Organic certification was obtained, which led to higher prices on the local market. The quality of beans was improved by using better post-harvest fermentation and drying methods.

This Chontalpa project currently benefits 18 producers, members of cooperatives in the Cárdenas and Centro municipalities. It helps farmers market the cacao directly in Mexico (and more recently in Italy) without the need for any intermediaries. The long-term objective is to establish a facility to produce semi-processed cocoa products.


Mexico’s crime statistics: fishing for the facts

 Books and resources  Comments Off on Mexico’s crime statistics: fishing for the facts
Feb 152012
 

Diego Valle-Jones’s blog, “Food and Fishing“, is actually more about Mexican crime rates than food and fishing! The blog, described by the author as “mainly about data analysis, programming and statistics, with the occasional interspersed post about food” has numerous posts analyzing the drug war in Mexico. These posts focus partly on geographic patterns of where most activity has occurred but mainly on the quality of the data available and its many deficiencies.

Valle-Jones’ analysis of drug war data is especially enlightening for anyone not familiar with the vagueries of crime-related data in Mexico. Most of his posts are illustrated by well-conceived and well-executed graphics, worthy of close examination in their own right. Posts in the past twelve months on “Food and Fishing” have included:

All are worth reading. It is unfortunate that, unlike Valle-Jones, so many mainstream  journalists have simply repeated facts and figures without any real understanding of where they came from, or what their strengths and weaknesses might be. Food and fishing?  Fishing among the statistics should give them food for thought…

Feb 132012
 

No one doubts the need for reforestation in Mexico. Since colonial times, huge swatches of the country have been denuded of their native vegetation. Recent figures from INEGI suggest that Mexico has lost almost 50% of its native forests due to logging and clearance for farming and settlement. The majority of this loss is in the Volcanic Axis belt that stretches west-east across the center of Mexico at an average height of 3000 m above sea level, but tropical rainforest areas much further south have also been decimated.

There is, however, some encouraging news.

Data released by the UN Environment Programme (UNEP) puts Mexico in a lofty 4th place worldwide for the number of trees planted since UNEP began its “Billion Trees Campaign”  in 2007. According to the UNEP figures, only China, India and Ethiopia have planted more trees than Mexico.

The “Billion Trees Campaign, inspired by the work of the late Nobel Peace Prize Laureate Wangari Maathai, recognizes that trees bring multiple benefits to people, ranging from carbon sequestration and the provision of timber to soil erosion control, enhanced aesthetic value and opportunities for recreation. UNEP claims that 12 billion trees have been planted worldwide since the program began.

The short Youtube video – Taking Root The Vision of Wangari Maathai –”tells the dramatic story of Kenyan Nobel Peace Prize Laureate Wangari Maathai whose simple act of planting trees grew into a nationwide movement to safeguard the environment, protect human rights, and defend democracy—a movement for which this charismatic woman became an iconic inspiration.” (http://takingrootfilm.com)

Poster prepared by Reforestamos México A.C.

Poster prepared by Reforestamos México A.C. (Mexican NGO) Visit www.reforestamosmexico.org for more information

But are the UNEP figures all they appear to be? Certainly, Mexico’s Environment Secretariat has organized, for many years, on-going programs of reforestation and conservation designed to stem the tide of logging that decimated Mexico’s natural forests over the past century. Official figures show that the pace of this effort has accelerated in the past few years. For example, between 2007 and 2011, Mexico’s National Forestry Commission protected, restored or reforested 21,000 square kilometers  (8100 sq. mi) across the country, an area equivalent to the state of Hidalgo. The total area reforested in those five years amounts to more than 3500 square kilometers  (1350 sq. mi).

On the other hand, critics of Mexico’s forestry policies, such as Greenpeace claim that up to 70% of all lumber sold in Mexico has been illegally harvested, and that less than 60% of trees planted in national campaigns survive their first few critical years.

Deforestation in the Monarch Butterfly Biosphere Reserve

One of the most critical areas, one where continued deforestation could be a real “game-changer”, is the Monarch Butterfly Biosphere Reserve which straddles the boundary between Michoacán and the state of Mexico. This is where millions of Monarch butterflies arrive each year from as far north as Canada to spend their winter. The butterfly itself is not endangered (there are non-migratory populations in many countries, and a year-round resident population in Mexico) but what assuredly is endangered is the “migratory phenomenon” of the Monarchs. Adequate forest cover at an altitude where winter weather is consistently within a narrow temperature band is absolutely crucial to the survival of this spectacular annual migration.

According to the National University (UNAM)’s Environmental Geography Research Center, at current rates of deforestation, the area of overwintering sites for the Monarch butterflies could be reduced by 75% in the next 18 years, leaving just 12,000 ha of suitable habitat. The protected area, established in 2000, covers 560 square kilometers (56,000 ha. or 216 sq. mi) but includes land cleared for pasture, settlement and cultivation. Researcher José López García claims the reserve is losing 3% of its forest each year. He blames clearance and changes of land use more than illegal logging. The rate of forest clearance has been exacerbated by a rapid rise in the population of the El Rosario ejido. El Rosario is the gateway to the most-visited part of the reserve, attracting thousands of tourists annually. The ejido’s population rose by an average of 5.65%/year between 2005 and 2010.

How will climate change affect Mexico’s forests?

Climate change is predicted to have several effects on Mexico’s forests. These include:

  • tropical rainforests (in both Mexico and Brazil) will gradually decline in extent, rainforest soils will have reduced fertility and some parts will become tropical grasslands.
  • the semi-arid areas in central and northern Mexico will become drier, and the total area of arid areas will increase

Globally, deforestation is believed to account for 17.4% of greenhouse gas emissions, so forest protection and reforestation are key strategies in efforts to mitigate the effects of further cliamte change.

Recent geographic trends in Mexico’s drug violence

 Other  Comments Off on Recent geographic trends in Mexico’s drug violence
Feb 112012
 

Drug related violent deaths during the first nine months of 2011 increased by about 13% compared to 2010.  Data released by the Office of the President  in January 2012 indicate that from January through September 2011 Mexico had a total of 12,903 drug war deaths. This is a rate of about 15.3 per 100,000 people per year [2011 rates were adjusted because data are available for only the first nine months of the year] compared to 13.6 in 2010 and 7.55 in 2009 [“Mexican drugs war murders data mapped”]. While the rate of increase declined significantly in the past two years, still drug violence is increasing rapidly.

The geographic pattern of drug violence is still mainly concentrated in northern border states and some western states. Chihuahua was still the most violent state with 2,289 deaths in 2011 (Jan-Sept) for a rate of 90 deaths per 100,000 per year.  Other states with high rates were Guerrero (61), Durango (58), Sinaloa (53), Tamaulipas (45), Nayarit (42), Nuevo León (33), and Coahuila (28). Note that four of these states are along the border and four are in western Mexico.

At the other end, Yucatán had only one death for a rate of 0.07. Other states with low rates were Tlaxcala, 0.8; Puebla, 1.22; Querétaro, 1.24; Campeche, 1.62; Chiapas, 1.73; Hidalgo, 1.75; and the Federal District (Mexico City), 1.83. It is very interesting that the drug war death rate in the capital city was one of the lowest in the country and less than one eighth the national. A future post will investigate drug war death rates in Mexico City.

Among border states, drug war death rates decreased significantly for the western states. Baja California was down 38%; Sonora down 36%, and Chihuahua down 31%. Before 2010, Baja California and Sonora had death rates over twice the national average largely because of high death totals in Tijuana and Nogales. However for 2011 the rates for Baja California and Sonora were 31% and 22% below the national average. The worst drug violence in these two northwestern states might be a thing of the past.

The eastern border states all suffered increases. Coahuila was up 99% and Nuevo Leon was up 143%. Both now have death rates over twice the national average. Tamaulipas’ already high rate of 37 in 2010 increased 22% to 45, almost three times the average. Clearly the battleground of drug cartel clashes along the border has shifting to the east.

Violence is up in some western states where it already was quite high. The rate in Guerrero increased 80% to 60 deaths per 100,000 people, four times the national average. Nayarit suffered an increase of 21% to a rate 42, almost three times the average. Smaller, but still significant, increases were registered in Colima, up 24%, and Michoacán, up 40% putting these two states above the average. On the other hand, the some of the violent non-border states experienced declines. The rate in Sinaloa declined 19%; but with a 2011 rate of 53 it is still three and half times the average. Morelos was down 18% putting it just above the average.

Drug violence increased very rapidly in some non-border states that were relatively peaceful through 2010. The drug war death rate in Zacatecas increased 361% while that in Veracruz was up 302%. While these increases are alarming, these two states still had rates below the national average in 2011. Jalisco suffered an increase of 40%, but its 2011 death rate of 11 was still less than three-fourths of the average. The State of México was up 24%, but its rate was still less than a third the average.

In conclusion, drug violence in Mexico continued to increase in 2011. The violence appears to be mostly concentrated in a wide geographic arc formed by the border states and those in western Mexico. Within this region some areas are suffering rapid increases while drug violence is declining in other places.  It is not clear how this pattern will change in the years ahead. To get a clearer picture of the current pattern, in future posts we will investigate trends in drug violence among Mexico’s 2,458 municipalities.

Eco-tortillas: an environmentally friendly way to make Mexico’s staple food

 Mexico's geography in the Press  Comments Off on Eco-tortillas: an environmentally friendly way to make Mexico’s staple food
Feb 092012
 

Mexican scientists continue to find ways to improve the humble tortilla, one of the essential components of Mexican cuisine and a major source of calcium for many Mexicans. We described two years ago how researchers at the Autonomous Metropolitan University of Mexico (UAM) had reduced pollution from the making of corn tortillas. This month, a press release from Cinvestav (Centro de Investigación y de Estudios Avanzados del Instituto Politécnico Nacional) reveals that researchers have developed a way to reduce the amount of lime required in the making of tortillas, while enhancing their dietary value. This will further reduce the pollution and ecological footprint associated with tortilla making:

Researchers have developed “environmentally friendly tortillas” that are more nutritious, help prevent osteoporosis, slow the aging process and help fight obesity. A team led by Juan de Dios Figueroa Cárdenas, of Cinvestav’s unit in Queretaro, developed an environmentally-friendly method to turn gourmet corn into tortillas that have a high nutritional content and double the shelf life, without increasing the price of the final product.

The current process used to make tortillas is “highly polluting” and “not very efficient,” resulting in tortillas that “in many cases do not contain the fiber or calcium” people need. Given the importance of tortillas in the Mexican diet since pre-Columbian times, researchers worked on developing a process that “does not produce pollutants” and replaces lime, a corrosive substance, with salts and other ingredients in the cooking process. The use of other salts retains the outer layers of corn kernels during cooking and preserves a large amount of nutrients that end up being lost in the existing process and generating an enormous amount of pollution and wasted water.

The tortillas are also useful in fighting obesity (a huge problem in Mexico) because they contain double the fiber of a traditional tortilla, Figueroa Cárdenas said, adding that the tortillas’ high calcium content will help prevent osteoporosis.

[This post is based on the text of the press release]

Tortilla-making. Photo: krebsmaus07 (Flickr)

Related posts: