admin

Oct 032011
 

The word “Bimbo” in common English usage refers to an inept person, an airhead or a “cheap” flirtatious “dumb blond”. In Spanish, “Bimbo” has no particular meaning, but is the name of Mexico’s predominant bread baker, a massive multinational company. It is so well-known that in many parts of Latin America, packaged, sliced white bread is often referred to simply as “pan bimbo”.

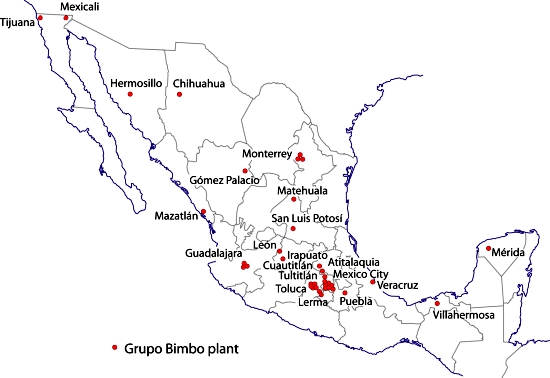
Grupo Bimbo is the world’s largest bread baker and fourth largest food company on the planet behind only Nestle, Kraft and Unilever. The firm has a presence in 17 countries, supplying consumers with more than 150 brands, via a network of 42 plants in Mexico (see map), 25 elsewhere in Latin America, 34 in the USA and 2 in China. It is currently the only bread company that has a national footprint throughout the USA.

bimbo-logoWhile most people may not be familiar with Grupo Bimbo as a corporation, virtually everyone in the Americas at one time or another has consumed Bimbo products. The company makes over 7,000 different products using various brand names, including Sara Lee; Thomas’ English Muffins; Entenmann’s pastries; Arnold’s, Orowheat, Mrs. Baird’s, Wonder (in Mexico only); Freihofer’s; Stroehmann’s; Brownberry; Old Country; Milpa Real and Tia Rosa (tortillas and related products); Barcel (chips and salted snacks; Marinela (sweet snacks); Boboli (pizza crusts); Coronado (cajeta) and El Globo fancy pastry and coffee shops.

How did Grupo Bimbo get to be so big?

Grupo Bimbo was established in Mexico City in 1945, and has grown mainly through acquisitions. In 2008 it paid $2.4 billion for the US food operations of George Weston Foods Ltd of Canada. In 2010 it bought Sara Lee’s fresh bakery division for about a billion dollars. These acquisitions enabled Bimbo to double its total revenues in the last decade to almost $10 billion.

Grupo Bimbo plants, 2011

Grupo Bimbo plants, 2011

Grupo Bimbo has a worldwide network of more than 41,000 distribution routes serving an astounding 1.8 million points of sale, varying from tiny corner stores in remote villages to major supermarkets in big cities.

Bimbo product with biodegradable packaging

Bimbo product with biodegradable packaging

In recent years, Grupo Bimbo has been busy boosting its green credentials via a series of environmental initiatives. These include a 90-megawatt wind park in Unión Hidalgo in the state of Oaxaca, which will generate almost 100% of the power Grupo Bimbo requires to run its plants in Mexico, and will be the largest wind park in the global food industry. It will diminish Grupo Bimbo’s environmental footprint and mean that almost half of Grupo Bimbo’s total global electricity consumption will come from renewable sources.

Grupo Bimbo is one of only ten Mexican companies that have earned the Socially Responsible Company Award from the Mexican Center for Philanthropy (CEMEFI) for ten years in a row. The company is involved in numerous environmentally and socially-responsible initiatives, including Reforestamos Mexico, an NGO committed to protecting Mexico’s forests and rainforests. This has worked with young people from 40 rural communities to help restore forests and raise awareness about the need for certified forestry products and forestry carbon certificates.

So, next time you go shopping, keep your eyes open for Grupo Bimbo brands and see how many Grupo Bimbo products you can recognize…

The GINI index: is inequality in Mexico increasing?

 Updates to Geo-Mexico  Comments Off on The GINI index: is inequality in Mexico increasing?
Oct 012011
 

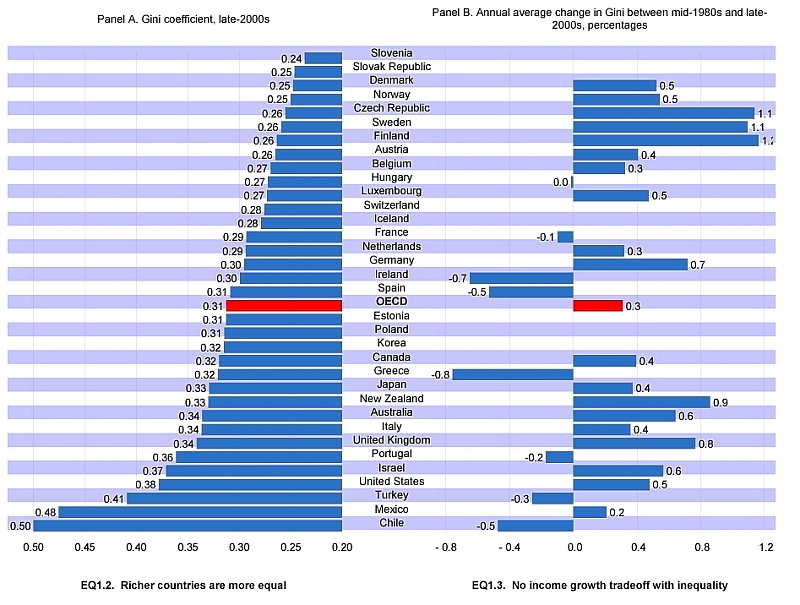
The GINI index, used to quantify the degree of inequality within a population or country (the higher the value, the more inequality), was introduced in a previous post. In this post we report on the change in GINI index for the member countries of the OECD (Organisation for Economic Cooperation and Development). The OECD regularly publishes updated GINI coefficients. Society at a Glance 2011 – OECD Social Indicators includes the following graph which gives a great view of changes in inequality between the mid 1980s and the late 2000s.

GINI coefficients for OECD members
GINI coefficients for OECD members (OECD, 2011) Click image to enlarge

It is no surprise to see that Mexico’s inequality is almost the highest of any OECD member country. However, the right hand side of the graph shows that the increase in inequality in Mexico over the period was actually smaller than the OECD average, and well below the change in the USA, Canada and several European countries. This suggests that Mexico’s economy is becoming increasingly resilient and economic downturns do not necessarily result in raising inequality in Mexico as much as elsewhere.

It will be interesting to see how Mexico’s GINI index changes in coming years. High levels of economic inequality remain one of Mexico’s most-pressing issues, and one which will be central to the upcoming 2012 elections.

Related posts:

Examples of high risk settlements located near Pemex pipelines

 Mexico's geography in the Press  Comments Off on Examples of high risk settlements located near Pemex pipelines
Sep 292011
 

There have been several fatalities associated with Pemex pipeline explosions in recent years, sometimes resulting from illegal attempts to tap into the lines. They include the disastrous blast in San Martin Texmelucan, Puebla, in December 2010 that killed 28 people. It therefore comes as something of a surprise to find press reports highlighting areas where people continue to live in vulnerable locations exposed to unacceptably high risks. In this post, we look at three examples, from the states of Oaxaca, Veracruz and Hidalgo respectively.

According to a report by Martha Izquierdo in Mexico City daily Reforma, more than 300 families in the industrial port of Salina Cruz (Oaxaca) live in homes sitting atop Pemex pipelines.

Previous municipal administrations are alleged to have issued permits for their construction, in total disregard for the potential dangers involved. The current municipal and state authorities have no plans to relocate these families, despite the daily risk they face. The pipelines carry oil into Pemex’s Salina Cruz refinery.

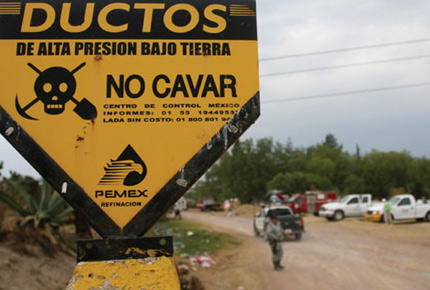
Pemex pipeline danger sign
Pemex pipeline warning sign. Credit Revista Buzos

The areas at risk are in the Deportiva, Hugo Mayoral, San Pablo Norte and San Pablo Sur districts (colonias) of Salina Cruz. Besides the homes, there are also vehicle repair shops, restaurants and even a shopping center in the zone along the pipelines.

In Coatzacoalcos, Veracruz, near another Pemex refinery called Pajaritos, a small town called Mundo Nuevo has sprung up to house construction and refinery workers. Its 20,000 residents live in close proximity to no fewer than 26 pipelines entering and leaving the refinery and, according to this report from  Jesús Lastra Ríos, they are not even certain of what materials are being carried in the pipelines, let alone their toxicity, flammability and explosiveness. In this case, apparently, the state “risk atlas” includes details of the pipeline diameters, but not their contents.

Clearly, settlements of any kind should not be allowed so close to Pemex pipelines, but there are many similar instances in Veracruz, as there are in many other states.

In Hidalgo state recently, the Education Ministry identified three schools as having been built “in high-risk areas near Pemex pipelines”. The state is making emergency plans to relocate the schools at an estimated cost of around $5 million. The schools are in the municipalities of Villa de Tezontepec, Ajacuba and Tlaxcoapan. The Hidalgo state government has a “risk atlas” covering landslide and other risks, but, apparently, most existing maps are based mainly on events that have already occurred.

These three examples serve to illustrate the seriousness of the situation in many parts of Mexico where planning restrictions have not been effectively enforced, and where risk assessments permitting accurate mapping of the most vulnerable areas have still not been completed and are therefore not available to municipal or state authorities.

Related posts:

To read more about the geography of hazards in Mexico, use the “Hazards” tag: http://geo-mexico.com/?tag=hazards

Natural hazards in Mexico are discussed in detail in chapters 2, 4 and 7 of Geo-Mexico: the geography and dynamics of modern Mexico.

Mexico’s geomorphosites: The Piedras Bola (Stone Balls) of the Sierra de Ameca, Jalisco

 Other  Comments Off on Mexico’s geomorphosites: The Piedras Bola (Stone Balls) of the Sierra de Ameca, Jalisco
Sep 272011
 

The Sierra de Ameca is a range of hills a short distance west of Guadalajara. The area was important in colonial times for gold and silver mining. One of the mines is called Piedra Bola (Stone Ball). The landscape immediately around this mine is so distinctive and unusual that it featured on the cover of the August 1969 edition of National Geographic.

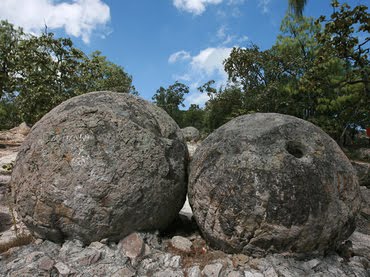
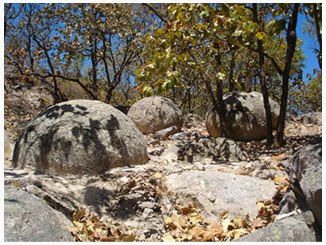
In the middle of the forest surrounding the Piedra Bola mine are about a hundred strange stone balls. They are almost perfectly spherical and range in diameter from about sixty centimeters to more than ten meters. These symmetrical boulders are unusually large. Nothing quite like them exists elsewhere in Mexico and few similar examples are known anywhere in the world.

Piedras Bola

Piedras Bola

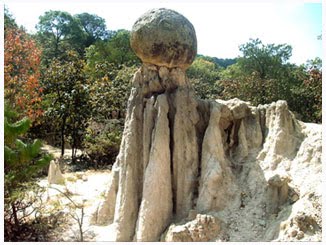
Some are buried, others partly or fully exposed. In some places, erosion of the surrounding rocks has left a sphere perched precariously atop narrow columns of softer rock, seemingly ready to topple in the next strong wind. These “hoodoos” or earth pillars have been formed as a result of water erosion and they may survive for centuries until the processes of sub-aerial weathering and erosion finally cause them to fall.

Piedra Bola atop an earth pillar

Piedra Bola atop an earth pillar

How were the Piedras Bola formed?

This summary of the most likely explanation of the origin of the stone spheres is based on that offered by Dr. Robert Smith of the U.S. Geological Survey in the original National Geographic article.

During the Tertiary geological era, 10-12 million years ago, a local volcano erupted, causing a deluge of glassy fragments of molten lava and ash, together with large quantities of volcanic gas trapped in the mixture. The mixture was very hot, probably between 550 and 800̊C. The deluge of material partially filled an existing valley, burying the former surface.

As the mixture cooled down, the existing glassy fragments formed nuclei around which much of the remainder of the material crystallized. Spherical balls began to form, their size depending on how long the crystallization process continued uninterrupted. The longer the time, the bigger the ball…. The most perfect balls were formed near the previous ground level, inside the hot mass of ashes, where the cooling would have occurred more evenly than in the bulk of the matrix material. The crystallized material is a kind of rhyolite which has an identical chemical composition to the fragments of glassy obsidian also found in the area.

The remainder of the ashes cooled down and became a consolidated accumulation of ashes and glassy fragments or tuff, without clearly defined spheres. This tuff is weaker, and has a lower density than the stone balls within it. During succeeding millenia, the combined processes of physical and chemical weathering weakened the surrounding tuff, and water (rain and rivulets) then eroded away this loose material, exposing some of the rhyolitic boulders completely and others partially.  As these processes continue, so more of the boulders will be exhumed from beneath their cover of tuff, and be revealed to us.

Protected?

The Jalisco State government has developed a small park around the Piedras Bola, including decent trails, some signposts and an amphitheater. There are even (reportedly) two ziplines, though I haven’t yet had the dubious pleasure of seeing them for myself. Increasing the number of visitors to  geomorphosites is not a bad idea, but some basic education and protection is needed if these and other geomorphological sites are going to be preserved intact for future generations. In the case of the Piedras Bola, graffiti now mar many of the exposed stone spheres and some of the spheres have been dynamited, apparently in the mistaken belief that the center of the sphere contained gold.

picture of piedras bolaHow to get there:

The entrance road to the Piedras Bola (formerly only a hiking trail) begins from km. 13 of the paved road that crosses the mountains from Ahualulco to Ameca. For anyone who does not have time for the hike, but still wants to see what these extraordinary stone spheres look like, the locals have thoughtfully rolled one down the mountain and onto Ahualulco’s main plaza.

Want to read more?

For more images and details, see John Pint’s article, Las Piedras Bola: the great stone balls of Ahualulco, on MexConnect, together with his outstanding gallery of photos.

Mexico City: attracting businesses from northern Mexico and revitalizing downtown core

 Mexico's geography in the Press  Comments Off on Mexico City: attracting businesses from northern Mexico and revitalizing downtown core
Sep 262011
 

Some businesses leaving northern Mexico and moving to Mexico City

According to Laura Velázquez, the Economic Development Secretary for the Federal District, the city has attracted 1650 firms from the north of Mexico in the first six months of 2011. The Federal District does offer some financial incentives for newly established companies, but the main reason is believed to be that the firms see Mexico City as having a higher level of public safety than some of the cities in states such as Nuevo León, Chihuahua, Coahuila, Durango and Sinaloa in northern Mexico,

A diverse range of businesses is involved; most are relocating in the northern and eastern sectors of Mexico City. The migration has boosted the number of available jobs in Mexico City and also led to an increase in foreign investment.

The continued face-lift of Mexico City’s historic downtown core

We introduced the on-going renovation project to beautify Mexico City’s Historic Center in The revitalization of Mexico City’s historic downtown core. The Trust Fund set up to rejuvenate Mexico City’s Historic Center repaired and cleaned more than 1000 facades between 2007 and 2010, with a total street frontage of 11.24 km. The work is part of the renovation of Mexico City’s Historic Center which now looks better than ever! Work continues on many other buildings that still require attention.

Cycle taxis becoming a popular means of transport in city center

Cycle taxis or pedicabs (bicitaxis) have become a much more common sight in downtown Mexico City. Less than three years after their introduction, they are now carrying about 180,000 passengers a year, according to an official of Mexico City’s Historic Center Trust Fund. The vehicles were introduced as part of the Trust Fund’s efforts to revitalize the historic downtown core of Mexico City. They help to reduce the city’s CO2 emissions. There are currently 132 licensed cycle taxis operating in the downtown area. They combine pedal power with small electric motors. Their “drivers” double as informal tour guides. Each cycle taxi is about 3 m (10 ft) long.

Other posts related to Mexico City

Traffic congestion still a serious problem for commuters in Mexico City

 Updates to Geo-Mexico  Comments Off on Traffic congestion still a serious problem for commuters in Mexico City
Sep 242011
 

An IBM survey of 8,042 commuters in 20 cities on six continents shows that more people are now taking public transport rather than driving. In general, people report that traffic has improved over the past three years.

The survey, entitled Global Commuter Pain, found that commuting in Mexico City was the “most painful” of the 20 cities studied; commuting in Montreal, Canada, was the “least painful”. The survey suggests that infrastructure investments in congested cities are repaid with improved travel times. Mexico City’s investments in public transport over the next few years should help move it away from the bottom place in the rankings.

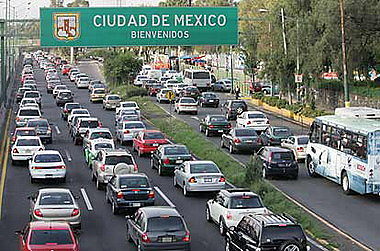
Mexico City traffic

"Welcome to Mexico City"

Two-thirds of drivers in Mexico City said they had decided not to make a driving trip at least once in the last month due to anticipated traffic conditions. Asked about the longest amount of time they had been stuck in traffic over the past three years, the mean time reported by Mexico City drivers was over two hours. (Drivers in Moscow fared even worse, with 30% reporting delays over three hours).

The index is comprised of 10 issues: 1) commuting time, 2) time stuck in traffic, agreement that: 3) price of gas is already too high, 4) traffic has gotten worse, 5) start-stop traffic is a problem, 6) driving causes stress, 7) driving causes anger, 8) traffic affects work, 9) traffic so bad driving stopped, and 10) decided not to make trip due to traffic.

The cities scored as follows: Mexico City: 108; Shenzhen 95; Beijing 95; Nairobi 88; Johannesburg 83; Bangalore 75; New Delhi 72; Moscow 65; Milan 53; Singapore 44; Buenos Aires 42; Los Angeles 34; Paris 31; Madrid 28; New York City 28; Toronto 27; Stockholm 26; Chicago 25; London 23; and Montreal 21.

  • The IBM report on the 2011 Commuter Pain Survey (pdf file).

Update on Mexico and the UN Millennium Development Goals (MDGs)

 Mexico's geography in the Press, Updates to Geo-Mexico  Comments Off on Update on Mexico and the UN Millennium Development Goals (MDGs)
Sep 222011
 

In a previous post, we looked at Mexico and the UN Millennium Development Goals. This post is the text of a press release issued by the President’s Office in September 2011:

As part of the celebrations of the 50th Anniversary of the United Nations Development Program (UNDP), President Felipe Calderón gave the General Administrator of the Program, Helen Clark, Mexico’s report on the progress achieved in the Millennium Development Goals.

He highlighted the influence of UNDP in Mexico which, throughout its existence, has contributed to the alleviation of poverty and inequality, sustainable human development, the prevention of risks from natural disasters, the implementation of environmental policies and the promotion of democracy.

The main achievements highlighted by the president, regarding the fulfillment of the Millennium Goals, were: achieving universal coverage in primary education, eliminating the education gap between men and women, which eradicated the gender gap in education and increased female empowerment, improvements in the population’s living conditions, through the reduction of mortality and child malnutrition, the sustained increase in life expectancy and specialized care for expectant mothers, the expansion of access to the population’s health services, in which he declared that by the end of this year, universal coverage will be achieved, and the expansion of access to basic services such as safe drinking water, information technologies, communication and decent housing.

The main challenges to be met, said the president, were the alleviation of poverty, improvements in the per capita income and the reduction of the inequality gap. However, he also expressed confidence that they would be fully met in a timely fashion, since he confirmed the fact that the authorities are working continuously to achieve the universalization of pre-school and secondary education, improve the quality of education and improve the Human Development Index through successful programs such as Opportunities and the Popular Insurance Scheme.

The president ended by confirming his commitment to enabling Mexico to fully achieve the values, ideals and agenda set by UN in a timely fashion.

[This post is the text of a press release issued by the President’s Office in September 2011)

The Ethos Foundation’s Multidimensional Poverty Index

 Other  Comments Off on The Ethos Foundation’s Multidimensional Poverty Index
Sep 202011
 

We looked in a previous post at the Multidimensional Poverty Index (MPI), originally presented in an Oxford Poverty & Human Development Initiative (OPHI) working paper, and explained its advantages over earlier poverty measures, especially the relatively crude single-factor approaches like “a dollar a day”.

Earlier this year (2011), the Ethos Foundation, a Mexican NGO, presented its own Ethos 2011 Multidimensional Poverty Index, using the expertise of the authors of the MPI as its starting point.

The Ethos Foundation believes that poverty is comprised of both household poverty, an inability to satisfy basic household needs, and by aspects of ambient poverty that make it impossible for people to achieve well-being given the existing political, social and economic conditions. As a result, their index gives a more “Latin American” perspective on poverty.

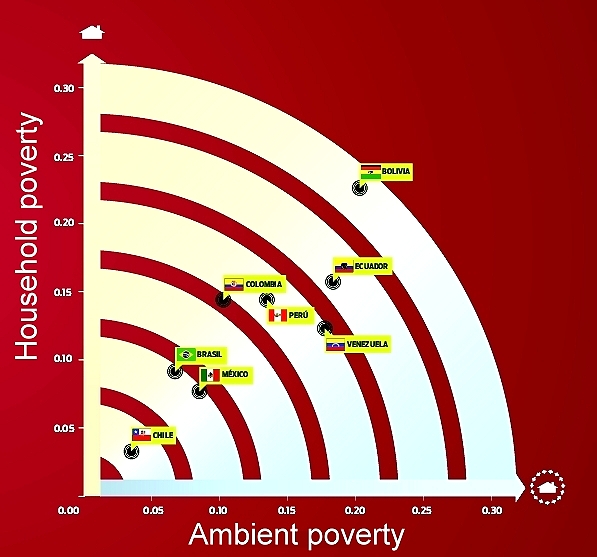
In applying its Multidimensional Poverty Index to an analysis of poverty in the eight largest economies in Latin America, the Ethos Foundation concluded that Chile is the country with the least poverty, followed by Brazil and Mexico.

Ethos Poverty Index applied to Latin America's largest economies. (Ethos Foundation, 2011)

The graph shows how the 8 countries rated, with the axes of the graph being household poverty and ambient poverty respectively. Overall, Brazil and Mexico are almost equal. While Brazil has less “ambient poverty” than Mexico, Mexico has less “household poverty”. Both countries have a long way to go to reduce poverty levels to match those in Chile.

What factors are included in the Ethos Foundation Poverty Index?

A. Household Poverty:

  1. Income per person (under $60 a day)
  2. Education (head of household uneducated? One child or more aged 7-15 not attending school?)
  3. Provision of drinking water and drainage
  4. Building materials (solid walls? three or more people sleeping in same room?)
  5. Cooking fuel used
  6. Availability of electricity

B. Ambient Poverty (21 variables in 7 categories, but not all equally weighted):

  1. Public Health (life expectancy, infant mortality, public health access)
  2. Institutions (government effectiveness; corruption; political stability)
  3. Economy (unemployment rate; competitiveness; access to micro-loans)
  4. Democracy (civil liberties; political rights and freedom)
  5. Public safety (homicide rate, vehicle theft rate, confidence in police)
  6. Gender (salary parity, educational parity, women in government)
  7. Environment (CO2 emissions/person; species in danger of extinction; rate of deforestation)

The Ethos 2011 Multidimensional Poverty Index is an interesting and valuable addition to the literature on poverty measurement. It is a salutary reminder to geographers that the world is often too complex a place for the same methods of study and quantification to work well everywhere. The great strength of the Ethos Foundation’s index is that it adopts a Latin American viewpoint on poverty, one that is more localized but of far greater relevance to Mexico than previous alternatives.

Related posts:

The financial flows involved in Mexico’s vehicle manufacturing industry

 Other, Teaching ideas  Comments Off on The financial flows involved in Mexico’s vehicle manufacturing industry
Sep 192011
 

In previous posts, we have seen Where Mexico’s vehicle assembly plants are located, as well as looked at some of the reasons for Mexico’s success in this industrial sector and examined Mexico’s vibrant autoparts sector.

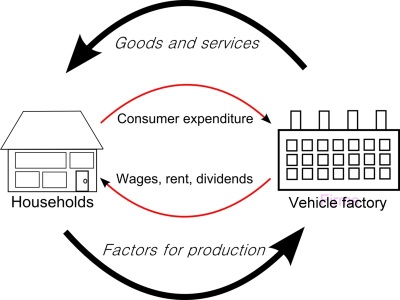
In this post we analyze the varied financial flows involved in the industry. Both local and international financial flows underpin vehicle manufacturing in Mexico.

financial flows

The following are some of the most important financial flows in the vehicle manufacturing sector.

  • International financial flows are in green
  • Domestic/local financial flows are in magenta

1. Foreign firms form Mexican subsidiaries and invest in Mexico; start-up capital to construct the factory and set up the business comes almost entirely from outside the country and enters Mexico as FDI. In recent years, FDI for auto firms has varied from $1 billion to $3 billion.

2. In many cases, local partners are involved, and they also contribute some of the start-up funds.

3. The factories employ workers, in some cases several thousand of them. These workers earn wages and spend most of their wages in the local economy. Each manufacturing job therefore has an economic multiplier effect, and generates more (indirect) jobs in the local economy. These jobs include positions in shops, services, transport, banking, auto-repair, etc. It is estimated that the economic multiplier for vehicle manufacturing is 3:1 – in other words, for every dollar spent in the industry three more are spent in the economy.

4. The factories purchase parts (components), some from Mexican suppliers, and some from overseas.

5. The factory produces vehicles, some of which are sold in the local market, via a series of vehicle distribution/sales points. This generates smaller two-way financial flows within the country.

6. Most of the parts and vehicles made in Mexican auto factories are exported. This generates another major financial flow, as purchasers overseas send funds back into Mexico to pay for their goods. This financial flow (a) allows production to continue and (b) generates profits for the factory owners (the car firms and shareholders).

7. The majority of these profits leaves Mexico, and is repatriated to the corporation’s home country, but both the workers in the factory, as well as the factory owners, pay taxes (state and federal) which remain in Mexico. In the case of shareholders, it is usually a financial flow towards their home country.

Previous posts in the mini-series:

Class exercise:

Use the description of financial flows above to draw an annotated diagram or a map to show the financial flows associated with the manufacturing of vehicles in Mexico. If you can think of additional flows that might be important, add those as well. Compare your diagram/map with that of other students and discuss the results.

The reasons why Mexico is fast becoming a key player in aerospace manufacturing

 Updates to Geo-Mexico  Comments Off on The reasons why Mexico is fast becoming a key player in aerospace manufacturing
Sep 172011
 

In a previous post, we looked at why  Querétaro has become a hub of aerospace manufacturing, home to major manufacturing or research plants for such firms as Bombardier and GE.

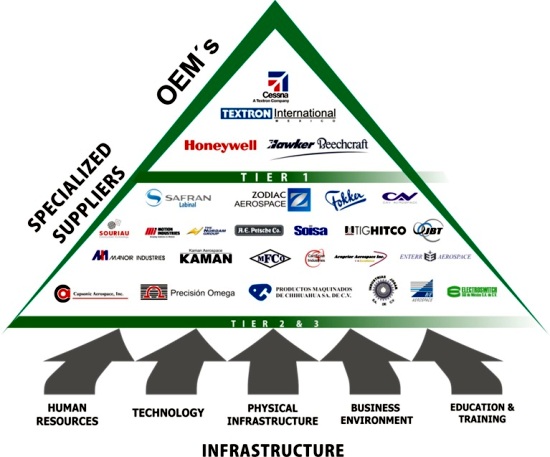
In this post we take a further look at the aerospace industry in Mexico, which, according to ProMexico,  the Mexican federal agency that promotes trade and investment, has expanded at 17% a year since 2005. Mexico’s aerospace manufacturing, which began as a relatively simple assembly industry, has evolved today into sophisticated aero-parts and fuselage manufacturing, well supported by specialist education and training programs. In the next phase, Mexico is expected to acquire full service airplane assembly meeting all relevant international design and innovation requirements.

Aerospace parts

The shift in aerospace from simple assembly to complex design, manufacturing and research, echoes what has already happened in some other sectors, such as vehicle manufacture.

Today, the aerospace industry employs 32,000 people in 16 Mexican states. the four most important states for the aerospace industry in Mexico are Baja California, Querétaro, Nuevo León and Chihuahua.

Approximately half the jobs in the sector are located in Baja California, mainly in either Tijuana or Mexicali. The first two aerospace companies to locate in Baja California (in the mid 1960s) were Rockwell Collins and Switch Luz. Today, aerospace firms in Baja California make electronic components, air conditioning systems, cable harnesses, hoses and seals, rustless steel bolts, turbine connector assemblies and blankets for commercial and military aircraft. Honeywell International has been influential in developing aerospace in Baja California since 2007, when it opened a testing facility in Mexicali.

How important is the aerospace sector in Mexico?

  • The number of aerospace manufacturing companies in Mexico is expected to grow from 232 in 2010 to more than 350 in 2015.
  • The aerospace sector is expected to provide 37,000 direct jobs in 2015, 28% more than in 2010
  • Exports of aerospace parts were worth $3.1 billion in 2010, a figure expected to jump to $5.7 billion by 2015.

Aerospace firms

The major factors that have helped Mexico set up and develop aerospace manufacturing are:

  • Mexico has the second largest fleet of private aircraft in the world after the USA,
  • Since 2009, it has become one of the world’s largest recipients of aerospace foreign direct investment
  • Mexican firms meet technical requirements and delivery schedules
  • Mexico offers easy access to raw materials for all phases of production
  • The Mexican market is economically, socially and politically stable
  • The government has offered strong support for the aerospace industry in Mexico. Import duties on aeronautics components were abolished in Mexico in 2007, the same year that Mexico and the USA signed a Bilateral Aviation Safety Agreement to facilitate cross-border aviation-related trade and services
  • Several Mexican states, especially those along the northern border have a well-established industrial infrastructure
  • The proximity of Baja California to the established aerospace industry and important aerospace markets in California, has been an important stimulus to aerospace firms in that state
  • Overall, Mexico offers lower production costs
  • Labor costs are not as cheap as India and China, but that is more than compensated by reduced transport costs. Aerospace parts made in Mexico can reach an assembly plant in the USA in 16 hours by road, compared to about 21 days from China by sea.
  • There is a large pool in Mexico of skilled labor, trained for electronics and auto-parts manufacturing.
  • Mexico’s workers are well educated, with sound engineering and technical skills

The available evidence suggests that there are now more engineering courses and graduates in Mexico each year than in the USA. The number of engineering graduates in the USA has not risen in recent years, and the number of engineering courses has actually declined. In Mexico, the numbers of engineering courses and graduates have both continued to grow at a very rapid rate. Specialist courses are already training students for the aerospace industry. For example the private university CETYS,  with campuses in Tijuana and Mexicali, has added aerospace to its graduate and undergraduate curricula and also offers a Master’s in Aerospace Engineering. Undergraduate programs in aerospace have been introduced at two public universities: the Autonomous University of Baja California and the Tijuana Technological Institute. The Tijuana Technological University has started to train technicians in assembling harnesses for the aerospace industry, modeled on a curriculum developed for a technical school in Toulouse, France (the home of Airbus).

Upcoming trade event:

Mexico is hosting an Aerospace Summit in the city of Chihuahua, October 18-20, 2011, in the Chihuahua Convention Center. (Graphics used above come from the trade event site.)

Sources include:

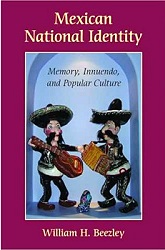
Review of “Mexican National Identity, Memory, Innuendo and Popular Culture”, by William H. Beezley

 Books and resources  Comments Off on Review of “Mexican National Identity, Memory, Innuendo and Popular Culture”, by William H. Beezley
Sep 152011
 

William H. Beezley, a professor of history at the University of Arizona, has written widely about Mexican history. He was co-editor, alongside Michael C. Meyer, of the Oxford History of Mexico, an illustrated “narrative chronicle” through the centuries, and a landmark modern history of Mexico. In this book, first published in 2008, Beezley explores the development of Mexican National Identity through a history of some facets of its popular culture.

As in the case of his earlier work (Judas at the Jockey Club and Other Episodes of Porfirian Mexico), Beezley’s Mexican National Identity. Memory, innuendo and popular culture (University of Arizona Press), is wide-ranging and engaging. The book consists of five essays on different themes which Beezley considers central to the development of Mexican National Identity.

In the first chapter, Beezley looks at how the character known as El Negrito came to be “one of the most famous marionettes of nineteenth-century puppet theater”. El Negrito, an Afro-American usually portrayed as a Veracruz cowboy, personified the attitudes of nationalistic Mexicans in the nineteenth century, with his mocking of the French and Maximilian, his temper tantrums, his infidelity, his wit and his resistance to the American invaders.
beezley - coverFrom a geographic perspective, chapter two is the book’s most interesting. The chapter opens by looking at the development of maps which “like symbolic physical features and regional individuals, portrayed Mexico with diversity as the salient attitude”. He describes two 18th century maps, drawn specifically for clerical travelers, highlighting altitude (and therefore climate) and language (ethnicity), but lacking scales, physical features or other landmarks. The modern era of Mexican map-making began with Alexander von Humboldt, and was extended later in the 19th century by others including Antonio García Cubas.

The production of maps necessarily included decisions as to which landmarks, places and features were most important. It also prompted clearer definitions of national boundaries, in both the north and south. In Beezley’s words, “This question of borders had political significance, and both cultural and social dimensions as Mexicans believed the boundaries divided their civilized society from the barbarians beyond.”

Chapter 2 then examines the role of almanacs and lotería (lottery cards), the quintessential Mexican parlor game, in helping to foment national attitudes. Almanacs were “a source of popular or local history and collective memory”. They gave potted summaries of the lives of the saints and martyrs, lists of holy days, images and biographies of political leaders and so on.

Lottery cards shared stereotypical views of objects and characters, often related to local stories. Beezley says that the version played in Campeche eventually gained the greatest popularity. The images used in Campeche formed the basis for the earliest commercially produced sets of cards when Clemente Jacques (a French immigrant and founder of the eponymous food processing brand)  first launched his range of culinary products, from chiles, olive oil and mole sauce to beans, jams and honey, and founded his own printing business to print his own labels. Jacques promoted his brand at the world’s fairs in Chicago (1893) and St. Louis (1904), using printed decks of lotería cards as a form of advertising. His cards became the basis for the modern packs of lotería cards sold throughout Mexico. Many of the most common images have multiple associations, some even including an overtly sexual double meaning. Some figures such as El Borracho (The Drunk) and El Valiente (The Brave One) and La Sirena (The Siren/adultery) are not associated with a particular region or place. Others such as The Scorpion and The Toad are readily associated with specific geographic regions or states: Durango and Guanajuato respectively. Almanacs and lotería cards helped reinforce a sense of national identity while recognizing regional and ethnic differences.

In Chapter 3, Beezley focuses on how celebrations of Mexican Independence gradually came to assume a massive significance for national identity. Independence came in 1821, but it was not until 1869 that annual celebrations of Independence Day really took off. On September 16, 1869, the Mexico City-Puebla railway line was inaugurated, beginning an exciting new era for transportation, which was to have far-reaching effects. During the presidency of Porfirio Díaz, Mexico celebrated its centenary of Independence, an event marked with banquets, parades and the opening to the public of a hastily-restored section of “The Pyramids” at the archaeological site of Teotihuacan. Beezley outlines how the popular perception of Mexico’s patron saint, the Virgin of Guadalupe, changed in less than a century from “the terrifying emblem of Padre Miguel Hidalgo’s insurrection, and the patron of downtrodden, rebellious Mexicans, to the patron saint of the dictatorship’s elite.”

Chapter 4 looks at the role of itinerant puppet theater in molding Mexico’s national identity. The largest and most famous single troupe was the Rosete Aranda troupe, formed by two Italian immigrants in 1850. The troupes went from strength to strength in the next half-century. By 1880, the Rosete Aranda company had 1,300 marionettes and by 1900 a staggering 5,104. Their creativity knew few bounds, and by undertaking annual tours around the country, they helped influence opinions and attitudes. Incidentally, their need to undertake annual tours was in keeping with the established principles of central place theory. As described in Geo-Mexico, the same principles apply in the case of traveling circuses.

In the hierarchy of central places, each step up sees a smaller number of places, each providing a wider range of goods and services, and serving a larger market area. This occurs because for a service to be provided efficiently there must be sufficient threshold demand in the central place and its surrounding hinterland to support it. For this reason we do not find new car dealers, heart surgeons or ballet schools in every small village. These activities can only survive in much larger centers where there is sufficient demand. Individual residents are not prepared to travel far in order to access a service of relatively low value. This poses a challenge for services such as puppet shows which are unable to command a high ticket price, but which need large numbers of potential viewers (a large threshold population) if they are to succeed. This quandary can be resolved by moving from one mid-sized center to another throughout the year, gaining access to a new audience in every location.

Needless to say, the invention of modern communications systems such as television means that this is no longer entirely true, except for live performances.

Beezley’s entertaining romp through Mexican popular culture and its links to national identity is well worth reading. It may not discuss all aspects of how Mexico’s national identity developed during the 19th century, but it provides numerous valuable insights into how a country of such diversity gradually acquired a clearer sense of national identity and purpose.

Where to buy:

Mexican National Identity. Memory, innuendo and popular culture, by William H. Beezley (link is to Sombrero Books’ amazon.com page).

The measurement of poverty: the Multidimensional Poverty Index (MPI)

 Other  Comments Off on The measurement of poverty: the Multidimensional Poverty Index (MPI)
Sep 132011
 

Measuring poverty sounds easy but is surprisingly difficult. What exactly constitutes poverty? What is “extreme poverty”? Simple poverty measures are often uni-dimensional. For example, many poverty figures quoted in the past were based on the proportion of the population having to survive on less than a dollar a day (later revised upwards to $1.25 a day). Such indices are simple and appealing, but inherently misleading. One of the more serious flaws of such indices (whatever the dollar figure used) is that $30 a month may be sufficient to purchase far more goods and services in some countries than in others. $30 in a European city like Geneva will not go anywhere near as far as $30 in the Mexican city of Oaxaca which in turn will not go anywhere near as far as in a mid-sized Chinese city.

The “Human Poverty Index” (HPI) was a vast improvement, since it combined the proportion of the population facing serious shortfalls in life expectancy, with measures of literacy and of living standards. HPI calculations are based on:

  • the percentage of population expected to die before the age of 40 years
  • the illiteracy rate among adults
  • the standard of living, worked out by combining the percentage of population lacking access to health services, the percentage lacking access to safe water, and the percentage of children under 5 years of age suffering from malnutrition.

Even this multi-criteria approach to defining poverty had its critics, with most arguments centering on which criteria should be included, or on their relative weighting within the index.

Another approach, adopted by Mexico’s National Political and Social Development Commission (Coneval) is (as we saw here) to combine income limits (about three dollars a day in this case) with social indicators in a multidimensional system. People in poverty have incomes below the limit and lack access to at least one of the list of social rights.

In 2010, an alternative multi-dimensional index, the Multidimensional Poverty Index (MPI) was published. This has quickly gained international acceptance and is rapidly becoming the preferred way of measuring poverty. The Multidimensional Poverty Index (MPI) was originally presented in an Oxford  Poverty & Human Development Initiative (OPHI) working paper by Sabina Alkire and Maria Emma Santos: OPHI WORKING PAPER NO. 38: Acute Multidimensional Poverty: A New Index for Developing Countries (July 2010).

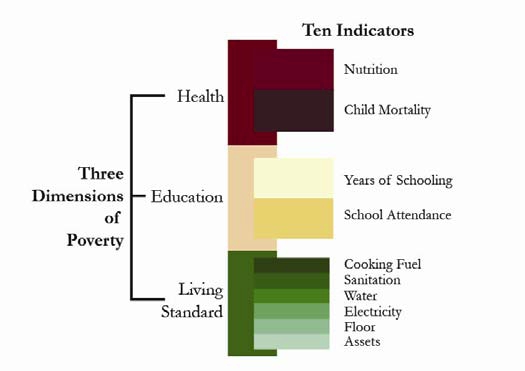
The MPI recognizes that poverty is a very complex phenomenon and seeks to identify the “deprivations that batter a person at the same time.” In the original paper, the index was calculated for 104 countries, with a combined population of 5.2 billion. The index consists of ten indicators corresponding to the three dimensions that are used to calculate the widely-used Human Development Index (HDI): Education, Health and Standard of Living. Each of the three dimensions is given equal weighting in the final index. Each of the indicators within each dimension is also given equal weighting.

Multi-dimensional Poverty Index

Multidimensional Poverty Index (MPI) (From Alkire & Santos, 2010)

Dimension One: Health [weighting 1/3 of total] Indicators:

  • Child Mortality: has any child in the family died?
  • Nutrition: Are any adult or children in the family malnourished?

Dimension Two: Education [weighting 1/3 of total] Indicators:

  • Years of Schooling: Have all household members completed 5 years of schooling?
  • Child Enrollment:  Were any school-aged children out of school in years 1 to 8?

Dimension Three: Standard of Living [weighting 1/3 of total] Indicators:

  • Electricity: Does the household lack electricity?
  • Drinking water: Does the household fail to meet Millennium Development Goal (MDG) targets, or is it more than 30 minutes walk to water
  • Sanitation: Does the home fail to meet MDG targets, or is the toilet shared?
  • Flooring: Is the floor of the home dirt, sand, or dung?
  • Cooking Fuel: Is cooking fueled by wood, charcoal, or dung?
  • Assets: Does the household own only one or none of the following: radio,TV, telephone, bike, motorbike?

From these values, the MPI can be calculated as the product of two numbers:

  • the percentage of people involved and
  • the “average intensity of deprivation” which reflects the number of dimensions in which households are deprived.

Many of these indicators overlap with indicators used to evaluate the Millennium Development Goals (MDGs). This means that analyzing MPI should help countries check their progress towards meeting several Millennium Development Goals (MDGs), while focusing on their most vulnerable people. (For details see the original paper). By looking at the simultaneous deprivations of households, it should help policy makers decide where they need to develop new strategies and where they need to refocus their efforts.

How does Mexico stack up on the Multidimensional Poverty Index (MPI)?

Mexico had an MPI rank of 29 out of the 104 countries surveyed (where the #1 rank means the least poverty), with 10.1% of the population deprived in terms of education, 9.2% deprived in terms of health and 6.7% deprived in terms of living standards.

A cautionary note is needed since any index is only as good as the data used in its calculations, but the MPI does seem to be a far more robust measure of poverty and personal deprivation than any of its predecessors.

Related posts:

Geo-Mexico: the geography and dynamics of modern Mexico is an excellent resource for courses in geography, economics, sociology and development studies, designed to be relevant to both general and academic readers. It provides an up-to-date account of Mexico suitable for students taking initial university or college courses related to geography, economics and Mexican or Latin American studies.  Buy your copy today!

Education professionals are invited to contact us if they would like to request a review copy. In addition, the entire book is searchable via the “Look Inside” feature of amazon.com

Sep 122011
 

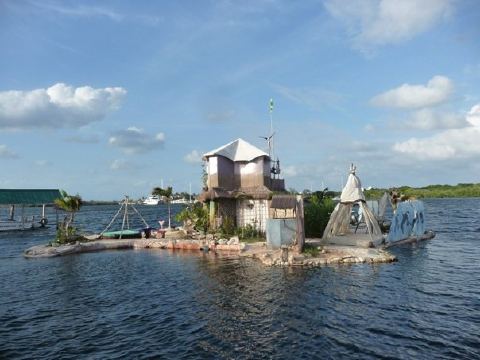
Richie (Rishi) Sowa is back! In 2002, Sowa, a former carpenter from Middlesbrough in England, completed the construction of his own private island paradise off the coast of Quintana Roo—built entirely of plastic bottles. Amazing but true! Sowa painstakingly constructed his island, known as Spiral Island, using more than 200,000 plastic bottles, and then lived on it! Unfortunately, his island home was entirely demolished by Hurricane Emily in 2005.

This was seemingly only a minor defeat since Sowa has since completed an even bigger and more resilient island on which to live, using the knowledge acquired from Spiral Island. His new creation is known as Joysxee. It is currently tethered to the island of Isla Mujeres, north of Cancún.

Joysxee

Joysxee. Photo: Rishi Sowa

Besides plastic bottles, Sowa used discarded wood and has planted vegetation including mangroves to help stabilize his home. His latest plan is to install a wave-powered propulsion system, allowing him to relocate his island at will, something I’m guessing he’s going to do next time a hurricane comes roaring in!

For Joysxee, Sowa has so far “reused” 125,000 plastic bottles. The island is 25 meters in diameter, and fitted with solar panels, a wave-powered washing machine. It comes complete with its own waterfall, river and (small) lakes. The island is designed to allow Sowa to be largely self-sufficient. The island’s vegetation includes many food sources such as palm trees, cacti, spinach, melons, lemons and tomatoes. The island will act as home to corals and fish as well.

Sowa’s ambition? To sail his eco-island round the world. He is the latest in a long line of English eccentrics, but you can only admire his creativity, artistry, vision and determination. Other people have sunk rusty old ships to make new underwater reefs, but how many have built an entire island from scratch, using discarded plastic bottles?

Not surprisingly, Joysxee, Sowa’s amazing home, has become an increasingly popular tourist attraction, receiving dozens of curious visitors a day. It is also a testimony to ecological sustainability.

Read more:

Want to support Joysxee?

Mexico’s vibrant autoparts sector

 Other  Comments Off on Mexico’s vibrant autoparts sector
Sep 102011
 

In previous posts in this mini-series, we have seen where Mexico’s vehicle assembly plants are located and looked at some of the reasons for Mexico’s success in this industrial sector. In this post, we consider the importance of the autoparts industry.

Each year, Mexico makes about 2 million vehicles, of which about 1.5 million are for export. Vehicle manufacturing is heavily dependent on parts manufacturers and suppliers. Vehicle assembly plants often require parts to be delivered in a “just in time” basis, to reduce the costs associated with warehousing and inventory. Mexico’s autoparts industry has grown rapidly in the last decade, and now accounts for about 7% of all the GDP derived from manufacturing activities, and for more than 8% of all manufactured exports.

The autoparts sector comprises about 1100 companies, one-third of which are Mexican-owned or controlled. Autoparts manufacturers employ more than 400,000 workers nationwide and exports of autoparts to the USA are worth more than $25 billion a year.

Car factories breed tire factories. Bridgestone, the Japanese tire-maker, and Pirelli, its Italian counterpart, are both investing in Mexico this year, expanding their production facilities and supply of tires to the North American market. Bridgestone is spending $100 million to upgrade its plants in Cuernavaca (Morelos) and Monterrey (Nuevo León), allowing production to rise to 10 million tires a year. Bridgestone also operates a retreading facility for truck tires in León, Guanajuato. Meanwhile, Pirelli is building a 210-million-dollar factory in Silao (Guanajuato) which will turn out 3 million high performance tires each year.

Good-Year campaign to recycle tires

Goodyear recycles tires

Related links:

For a useful map of major scrap tire piles either side of the border and a scary count of scrap tires, see Border 2012: U.S.–Mexico Border Scrap Tire Inventory, Summary Report (May 2007) (pdf file)

For some other (fun and extraordinary) ideas as to how old tires can be re-used, see Tires as Art.

Sep 082011
 

Geotourism is geography tourism (as opposed to tourism geography!). It applies to any recreational (tourism) activity where one of the primary objectives is to visit some phenomenon of geographic importance. This could be a coral reef, mangrove swamp, volcano, mountain peak, cave or canyon, but it could just as easily be a sinkhole, waterfall, new town or sugar mill. Ideally, geotourism should be sustainable, ecologically-aware and culturally-sensitive.

Geotourism often involves visiting landforms that hold special value: geomorphosites. Mexico has an amazing diversity of geomorphosites, quite possibly the richest collection of any country in the world.

What exactly are geomorphosites?

Geomorphosites were first defined in 1993 by Mario Panniza. Essentially, they are landforms that have acquired, over time, a certain value. Once noticed and made accessible to people, the landforms acquire scientific, cultural, historical, aesthetic, and socio-economic value. [1]

Panniza subsequently defined geomorphosites as,”landforms that have acquired a scientific, cultural/historical, aesthetic and/or social/economic value due to human perception or exploitation.” [2]

Reynard and Panniza state that geomorphosites can vary in scale from a single geomorphological object (eg a sink hole) to a wider landscape (eg a mountain range) and that geomorphosites “may be modified, damaged, and even destroyed by the impacts of human activities.” [3]

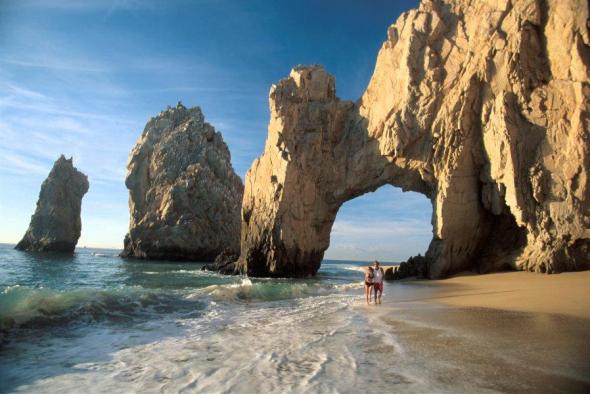
The marine arch at Cabo San Lucas, an example of a geomorphosite

The marine arch at Cabo San Lucas, an example of a geomorphosite

The dominant additional value may be economic, ecological, aesthetic or cultural, and this provides a starting point for assessing whether or not a particular landform is a geomorphosite or not.

The science study (see first comment below!) of geomorphosites is still in its infancy. Several competing classifications have been proposed, and no definitive consensus has yet been reached on the best way to quantify the value of a particular example.

One set of criteria for assessing geomorphosites includes:

A. Economic value:

  • accessibility,
  • number of visitors,
  • inclusion in promotional literature

B. Scientific/ecological value:

  • palaeogeographical interest,
  • singularity,
  • integrity (state of conservation)
  • ecological interest

C. Aesthetic value:

  • the number and spacing of belvedere points (high points from which a view is possible over the surrounding landscape)
  • shape
  • altitude
  • color

D. Cultural value:

  • cultural legacy (writing, art etc),
  • historical and archaeological significance,
  • religious relevance,
  • artistic and cultural events

Mexico has literally thousands of geomorphosites. We have already described some of them, including:

and we plan to highlight many more in future posts, including:

  • Piedras Bola (Stone Balls) in Jalisco
  • Peña de Bernal, a monolith in Querétaro
  • Sumidero Canyon in Chiapas
  • the iconic marine-eroded arch at Cabo San Lucas (see photo)

The scientific study of geomorphosites should enable researchers to suggest ways to approach their management. Unlimited access to some geomorphosites may generate a healthy flow of admission fees but could also easily increase erosion and hasten the destruction of the very thing that the tourists are paying to see.

On your next trip to Mexico, make sure to visit one or more of the country’s super-numerous geomorphosites!

References:

[1] Comanescu and Nedelea, Area (2010) 42:4, 406-416.

[2] Panizza M. (2001) Geomorphosites : concepts, methods and example of geomorphological survey. Chinese Science Bulletin, 46: 4-6

[3] Reynard, E and Panizza, M. (2005 ) Geomorphosites: definition, assessment and mapping, Géomorphologie : relief, processus, environnement , 3/2005

Is poverty in Mexico on the rise?

 Mexico's geography in the Press  Comments Off on Is poverty in Mexico on the rise?
Sep 062011
 

According to a recent government study, almost half of Mexico’s population now lives in poverty. The report came from the National Political and Social Development Commission (Spanish language acronym: Coneval). Poverty rates had been falling for several years, so this is clear evidence that Mexico’s economy has been struggling in the wake of the economic recession in North America.

How does Coneval define poverty?

Coneval uses a simple multidimensional poverty index, which considers the following criteria:

  • household income
  • access to education
  • access to food
  • access to health care
  • access to social services
  • housing quality
  • access to basic household services (electricity, water, drainage)

According to Coneval, people living on less than 2,114 pesos (about $180) a month in urban areas (or 1329 pesos in rural areas) and who lack at least one of the basic social rights in the list are living in poverty.

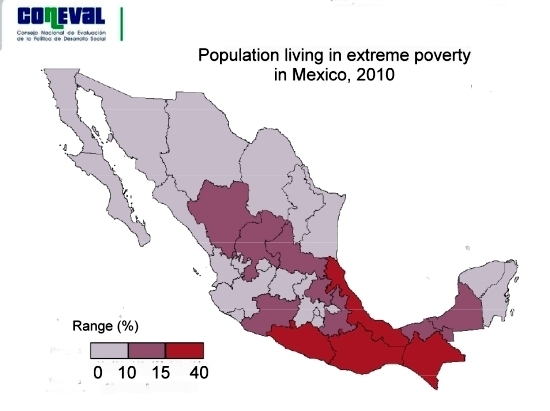
Extreme poverty (see map)  is applied to people living on less than 978 pesos ($85) a month in urban areas (684 pesos in rural areas) and lacking at least one social right.

Map of extreme poverty in Mexico 2010By these definitions, 46.2% of Mexico’s population (or about 52 million people) are currently living in poverty. This has risen from 44.5% in 2008. However, the percentage living in extreme poverty has dropped slightly since 2008 from 10.6% to 10.4%.

The distribution of poverty shown on the map above is not a surprise; we have seen many times in previous posts that the southern half of Mexico (excluding the Yucatán Peninsula) is much less wealthy in economic terms and social indicators than the north, even if it has a wealth of indigenous groups and cultural traditions.

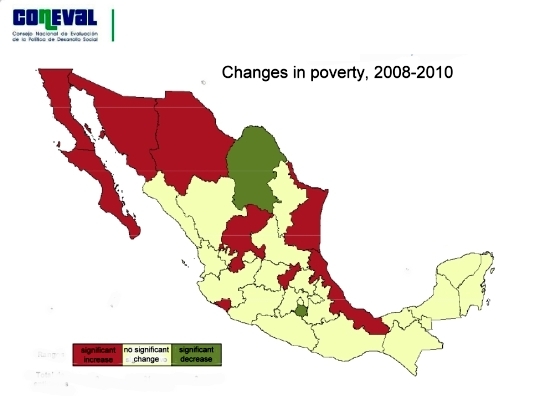
The map below is perhaps more interesting since it highlights the areas where the incidence of poverty has changed significantly between 2008 and 2010. The green areas have experienced a significant decrease in poverty and the red areas a significant increase in poverty. It is clear that the effects of the economic recession are being felt much harder in northern Mexico, where export-led manufacturing is prominent, than in the south.

map of changes in poverty in Mexico, 2008-2010Poverty in Mexico is on the rise, and it is on the rise faster in northern Mexico than the already poverty-stricken south. Only time will tell whether this increase in poverty is a temporary and short-lived trend or whether it heralds the start of tough times for many people in Mexico, especially those living in the rural areas, where the incidence of poverty and extreme poverty are far higher than in urban areas.

Given that the income levels used to define poverty in urban areas are more generous than those used for rural areas, the true level of poverty in the Mexican countryside is almost certainly much higher than this study suggests, something for politicians to bear in mind as they gear up for national elections next year.

Related posts:

The reasons why Mexico has become one of the world’s top ten vehicle-making countries

 Other  Comments Off on The reasons why Mexico has become one of the world’s top ten vehicle-making countries
Sep 052011
 

As we saw in an earlier post – Where are Mexico’s vehicle assembly plants located? – Mexico’s autoparts and vehicle assembly industry plays a vital role in Mexico’s economy, attracting foreign direct investment (FDI), providing employment and bringing in billions of dollars in export earnings each year.

vw-plant-mexico

Mexico also has a large internal (domestic) market for vehicles. According to the Mexican Automotive Distributors’ Association, 820,000 vehicles were sold on the national market in 2010. The market leader is Nissan (with 23.5% of the domestic market), followed by General Motors (19.5%) and Volkswagen (13.2%). Mexico’s best-selling cars are the Nissan Tsuru/V16 and the Volkswagen Jetta. Nissan aims to have domestic suppliers for 90% of all its components by the end of 2011.

Why has Mexico become one of the world’s top ten vehicle-making countries?

  • Mexico already had a highly competitive manufacturing sector
  • Mexico has an excellent communications network, with several trans-border highways and rail lines, as well as several major ports. This means lower shipping costs
  • Stable exchange rate
  • Significant domestic market (population 112 million)
  • Mexico has formed an outstanding network of trade and investment agreements. Mexico has the world’s largest free trade agreements network, spanning three continents, and offers preferential tariffs to more than 44 countries.
  • Competitive labor costs
  • Responsible federal fiscal policies have increased the resilience of the national economy
  • Availability of skilled labor and well-educated, multilingual managers
  • Proximity to the USA, both for investments and for markets
  • Lower production costs: since 2009, the manufacturing costs for vehicles in Mexico has been between 80% and 90% of the equivalent cost in the USA.
  • Total production and delivery costs: For vehicles sold in the USA, costs are lower for vehicles made in Mexico than for those made anywhere else, including China, India and Brazil.
  • Government support: To stimulate higher-value activities (engineering, design, testing, R&D), Mexico’s government offers numerous incentives, including job training and tax credits.

Vehicles made in Mexico are high quality
Mexican manufacturing plants have consistently done well in the annual quality surveys undertaken by market research firm JD Power and Associates. The study has been conducted annually for the past 17 years and provides an important benchmark for the automotive sector. Vehicles made in Mexico usually have fewer defects than those made in the USA. In 2008, the Toyota plant in Baja California won the award for the top ranking plant in the Americas.

The top ten manufacturers:

According to the latest figures from the International Organization of Motor Vehicle Manufacturers (OICA), Mexico was the world’s 9 th largest vehicle-maker (2.2 million vehicles) in 2010, behind China, Japan, USA, Germany, South Korea, Brazil, India and Spain, but ahead of France, Canada, UK, Italy and Russia.

Further information:

For more facts and figures (with graphs and maps useful for teaching purposes): Mexico and the Automotive Industry, a strategic place to invest. Gerardo Ruiz Mateos, Ministry of Economy. June 2010. (pdf file)

Sep 032011
 

The sugar industry accounts for 0.5% of national GDP. Sugarcane fields cover 670,000 hectares (1.6 million acres) in Mexico, the second largest crop area after corn. Yields of sugarcane range from 60-70 metric tons/hectare.

Main growing areas in Mexico

The main cane producing states are: Veracruz (1.9 million metric tons), San Luis Potosí and Jalisco (each 0.6 million), Oaxaca and Chiapas (each 0.3 million), and Nayarit, Tamaulipas and Morelos (each 0.2 million). Veracruz is the leading state by far in terms of area of sugarcane fields, with 260,000 hectares devoted to cane, folled by Jalisco, San Luis Potosí and Oaxaca (each with around 56,000 ha) and Tamaulipas (43,000 ha).

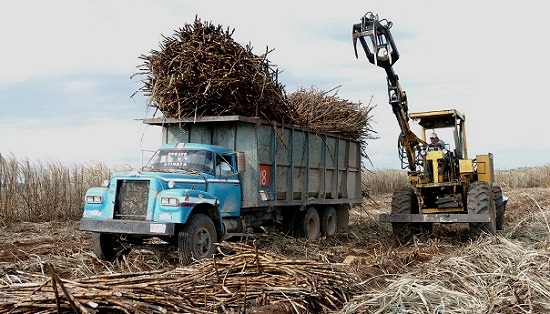
SugarcaneSugarcane fields and their associated sugar mills form a highly distinctive landscape in many parts of Mexico, with the greatest concentrations on the coastal plains on the Gulf and Pacific coasts, together with numerous higher-altitude river valleys in central Mexico.

History and land tenure

Sugarcane was brought to Mexico by Spanish settlers. Many major plantations were established, as they were in the Caribbean and Brazil. Mexico’s indigenous population provided a resident labor force, augmented by the introduction of some slaves from Africa (see Blacks outnumbered Spaniards in Mexico until after 1810).

The large colonial sugar haciendas in Mexico (and some were very, very large indeed) exerted considerable influence over politics and local economies. Sugarcane remained an important crop following the Mexican Revolution (1910 onwards) which led to rural reorganization and much stricter controls on the size of land holdings. Sugarcane is grown on 150,000 farms, making their average size small, under 4.5 hectares (11 acres) each. This is partly a consequence of the Mexican Revolution which limited maximum farm size. About half of all sugarcane production units are 2 hectares or less in area. The small average size of sugarcane farms places severe restrictions on possible investments and effectively prevents any economies of scale.

Employment

The sugarcane sector employs about two million people directly and indirectly. The number of direct jobs includes:

  • 150,000 growers
  • 100,000 seasonal sugarcane cutters
  • 20,000 cane transport workers
  • 30,000 sugarmill workers
  • 7,000 administrative, technical and management personnel

Harvesting and production

The annual harvesting of sugarcane in Mexico runs from late October to June. During the 2010-2011 harvest, 670,000 hectares of cane fields were cut yielding 44 million metric tons of cane, from which 5.2 million metric tons of sugar was extracted, 7.4% more than for the 2009-2010 harvest.

Sugar mills

More than 50 sugar mills currently operate in Mexico. The mills vary greatly in size, age and technology. Many are small, old and inefficient, which increases the cost of sugar production in Mexico compared to countries with newer methods and equipment. Mexico’s sugar mills have weathered numerous financial crises. In 2001, 27 mills were placed under government control, with about half of these mills later sold back to private ownership. In 2005, a revised Sugarcane Law guaranteed a basic reference price for growers, improving their financial security. Almost half of all Mexico’s sugar mills are located in Veracruz state. The remaining sugar mills are scattered among an additional 15 states.

Domestic consumption of sugar

Mexico’s domestic market consumes around 4.5 million metric tons a year, with the largest demand coming from the soft drinks industry. Consumption is expected to fall this year, due to reduced consumer purchasing power and escalating domestic prices for sugar fueled by speculation and supply shortages.

Sugar exports

Mexico is the world’s 6th largest exporter of sugarcane, and the main supplier of sugar to the USA. For the 2010-2011 season, sugar exports to the USA totaled  a record 1.3 million metric tons. This figure has been increasing rapidly in recent years, partly due to sugarcane’s inclusion under the terms of NAFTA.

Despite its exports, Mexico also imports small quantities of sugar, mainly from Nicaragua in order to maintain its own sugar reserves of around 1 million tons.

The challenges faced by Mexico’s sugar industry

Mexico’s sugarcane industry faces numerous serious challenges, including:

  • poor drainage of soils in some areas
  • winter frosts in some mountain areas, especially in the more northerly growing regions.
  • limited rainfall – cane requires 1100–1500 mm (43–60″) of precipitation a year; unreliable precipitation, especially periods of drought, are a major problem, especially in Veracruz where irrigation systems are inadequate
  • level of production inputs (fertilizers, pesticides, etc)
  • transport costs which contribute to the high price of sugarcane in Mexico
  • small size of production units which limits investment and improvements
  • low efficiency of older sugar mills

Environmental degradaion

Environmental degradation is one of the most serious issues facing Mexico’s sugar industry, given the nature of sugarcane processing and the age of many of Mexico’s sugar mills:

  • much of Mexico’s cane is still hand-cut, and burning the cane fields prior to harvest is still a common practice, since it makes harvesting easier and drives out snakes. However, it has an adverse effect on air quality as well as on soil nutrients, structure and microorganisms.
  • Large volumes of water are used in growing and processing sugarcane. Much is wasted; some is returned to groundwater sources or streams heavily polluted. More recycling and water treatment plants are needed.
  • Air pollution is also a problem with some mills still to fit modern emissions control devices.
  • The safe disposal of processing waste (some of which has potential value for subsequent use in other industries) is also a continuing problem. Sugar mills produce a variety of waste materials, many of which are currently dumped.

Further reading:

The geography of Mexico in the 21st century (cartoon)

 Other  Comments Off on The geography of Mexico in the 21st century (cartoon)
Sep 022011
 

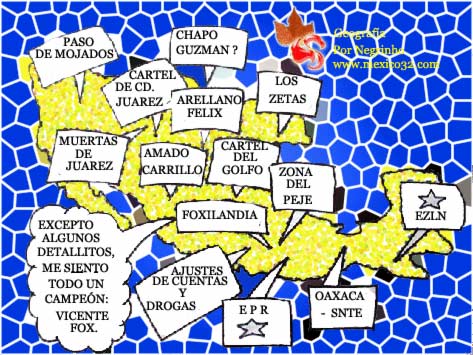
Below is Mexican cartoonist Negrinho’s view of the “Geography of Mexico in the 21st Century“, which shows how “In the course of history, the geography of Mexico has changed: its natural environment due to deforestation, its politics, society and even its security…”

Geography of Mexico in the 21st Century

Geography of Mexico in the 21st Century. Credit: Negrinho

The cartoon dates from a few years ago, and features references to politics, drug cartels and their leaders, the spate of unsolved murders of young women in Ciudad Juárez and “mojados” (“wetbacks“, undocumented migrants crossing the border into the USA).

This cartoon is one of a series entitled Mexico 32: Futbol y Caricaturas Políticas.

Sep 012011
 

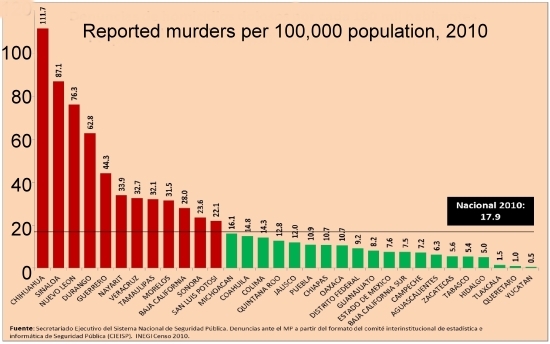
In a recent post, we looked at the vexed question of the overall 2010 homicide rate for Mexico. We included a mention of  National System of Public Security (SNSP) data for Mexico that show that there were 18 intentional homicides (murders) per 100,000 population in 2010. This rate varies greatly from state to state (see graph). The rate in the state of Chihuahua, the epicenter of drug war violence, is 112 per 100,000 which is roughly twice as high as any individual country on the planet. Sinaloa which has experienced a rapid upsurge in drug violence was second with a murder rate of 87 per 100,000.

murders by state, 2010

Source: National System of Public Security (SNSP)

Other states with very high murder rates are Nuevo León with 76, Durango with 63, and Guerrero with 44. All of these states suffer from very high rates of drug-related murders. Over 93% of all murders in Chihuahua are drug-related, compared to 73% in Sinaloa, and about 70% in both Guerrero and Durango. The non-drug-related murder rate for Chihuahua of 9.4 is just above the national average of 8.1.

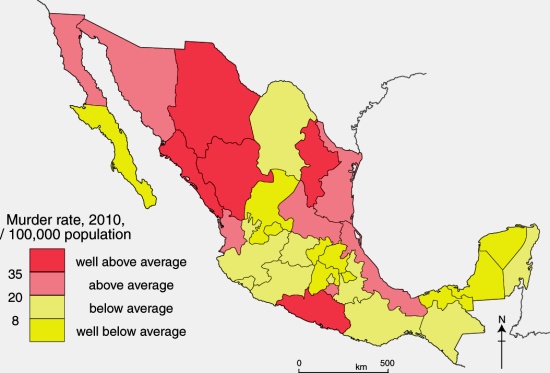
Yucatán has the lowest murder rate with just 0.5 murders per 100,000, lower than the rate in Canada and about one-tenth that of the USA. Other states with relatively low murder rates (see map) include Querétaro (1.0), Tlaxcala (1.5), Hidalgo (5.0) and Tabasco (5.4). All of these states are relatively free of drug-related violence.

Map of murder rate, 2010

Map of murder rate, 2010. Credit: Tony Burton / Geo-Mexico.

The national murder rate of 17.9 is almost twice the rate for the Federal District (D.F.) which is 9.2 per 100,000. Only about 18% of the murders in the capital city are drug-related. The murder rate in Jalisco of 12.0 is well below the national average, even if it has increased rapidly. Over half the murders in Jalisco in 2010 were drug-war-related. The State of Mexico also has a relatively low murder rate of 7.6 with 30% of murders related to the drug wars.

The main conclusion is that many northern states like Chihuahua, Sinaloa, Nuevo León and Durango are plagued by drug war violence and have very high murder rates. On the other hand, most states in the south and southeast, like Yucatán, Campeche and Tlaxcala are relatively free of drug war violence and historically have had low murder rates. One significant anomaly in the overall pattern appears to be Guerrero which is well to the south but has a high murder rate and a very significant amount of drug violence.

Mexico’s Fair Trade coffee faces an uncertain future

 Updates to Geo-Mexico  Comments Off on Mexico’s Fair Trade coffee faces an uncertain future
Aug 302011
 

An earlier post looked at why Mexico’s coffee harvest was unlikely to meet expectations this year. The 2010-11 harvest, hit by poor weather, totaled a disappointing 4 million 60-kg sacks (240,000 metric tons), almost entirely Coffea arabica and about 70% destined for export. This post looks at some recent trends relating to the production and consumption of coffee in Mexico.

Mexico is the world’s seventh largest coffee producer (after Brazil, Vietnam, Indonesia, Colombia, India and Ethiopia) and one of the leading suppliers of organic, shade-grown coffee. The nation’s 480,000 coffee growers, most working small parcels of land less than 5 hectares (12 acres) in size, are concentrated in the states of Chiapas, Veracruz and Oaxaca.

Mexico’s domestic consumption of coffee

Despite being one of the world’s leading coffee producers,Mexico’s domestic consumption averages only 1.2 kg (2.6 lbs) per person each year. While this figure has doubled since 2000, is is still only about half the equivalent figure for the coffee-growing Central American nations, and way below consumption in wealthier countries such as world-leader Finland (12 kg per person) or the USA (5.5 kg per person). Domestic consumption is rising but remains low.

Yields need to rise

According to Amecafe (Asociación Mexicana de la Cadena Productiva del Café), a major growers’ organization, global climate change is expected to have an adverse long-term effect on prices and on the sustainability of coffee-farming in Mexico. In an effort to raise yields of coffee to at least 12 quintals/hectare (19 bushels/acre) within 3 years and to 20 quintals/ha (32 bushels/acre) eventually, Mexico’s Agriculture Secretariat has announced financing of 16 million dollars for a program to gradually replace aging coffee groves in 12 states.

Fair trade coffee faces uncertain future

Soaring coffee prices might signal the beginning of the end for Fair Trade coffee. Much of the world’s specialty coffee comes from small-scale growers in Latin America, including Mexico, and much of it is marketed as “organic” or “fair trade”. After a decade of depressed prices, wholesale and retail prices for coffee have risen sharply in the past year. US retail prices have risen more than 20%; the price of coffee on international commodity markets has risen almost 60%.

The higher prices should be good news for growers, but as Kevin Hall points out in “Coffee prices being pushed by speculators” this is not necessarily the case. Many co-operative marketing organizations, including those considered socially-responsible or “Fair Trade”, do not have the resources to pay the new higher prices and acquire sufficient coffee to meet their existing contracts. This means they can no longer compete against the well-financed middlemen who specialize in purchasing coffee for regular distribution via commodities markets and major buyers. Farmers want the maximum return they can get on their crop, and they want it on delivery, which makes life difficult for any fair trade co-operative that lacks strong financial resources.

Further statistics:

  • USDA (US Department of Agriculture) June 2011 update on coffee (pdf file).

Related post:

Aug 292011
 

In a previous post–Ciudad Juárez faces economic fallout from the effects of the war on drugs–we looked at how violence in one border city has adversely affected the local economy, causing many businesses to close. The violence has also resulted in many people migrating away from the city. How many have moved? There is limited evidence to quantify the movement, but one demographer believes 40,000 have fled Ciudad Juárez to the U.S. as a result of drug-war violence since 2008.

Ciudad Juárez is not the only city from which people have moved as a result of the security situation. According to some demographers, the “Mexican exodus” comprises at least 125,000 individuals who have chosen to move away from the border area, and perhaps as many as 200,000. An interesting website–Mexodus– features some quality student journalism that examines some of the personal stories involved.

In its own words, “Mexodus is an unprecedented bilingual student-reporting project that documents the flight of middle class families, professionals and businesses to the U.S. and safer areas of México because of soaring drug cartel violence and widespread petty crime in cities such as Ciudad Juárez.” The project, partly funded by the Ethics and Excellence in Journalism Foundation, involved nearly 100 student journalists from four universities:

The collaborative nine-month venture resulted in more than 20 short articles, videos and slideshows relating to the on-going exodus of working families from border cities.

What makes the Mexodus project so interesting is that it is based on highly personal stories, ranging from families who paid ransom money to kidnappers to businessmen who chose to flee rather than pay protection money to safeguard their property. Some of the articles focus on the motives and decision-making processes of people who chose to stay rather than leave.

Mexodus is a valuable resource about the effects of drug-war violence on the lives of people in Mexico’s border cities, and on their decision to stay or leave.


Where are Mexico’s vehicle assembly plants located?

 Teaching ideas  Comments Off on Where are Mexico’s vehicle assembly plants located?
Aug 272011
 

Mexico is one of the world’s “Top Ten” countries for vehicle production and for vehicle exports. 75% of Mexico’s annual production of around 2 million vehicles are made for export. The industry attracts large amounts of Foreign Direct Investment (FDI). Vehicle assembly plants provide around 60,000 jobs, with a further 80,000 employed in distributorships nationwide and a whopping 420,000 employed in the autoparts sector. The combined exports of vehicles and autoparts bring 85 billion dollars a year into the Mexican economy.

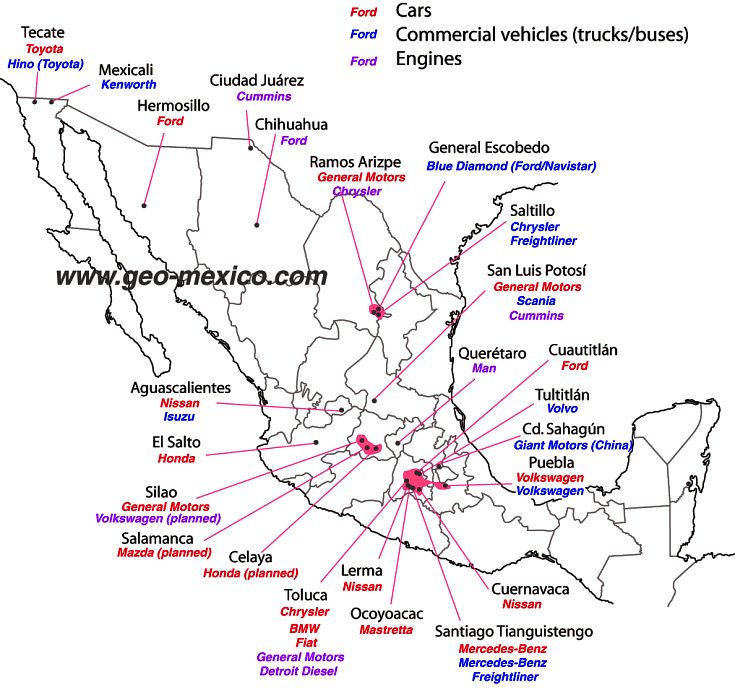
There are more than 25 vehicle assembly plants in Mexico, manufacturing many brands of cars and trucks (see map). In addition, there are 1100 firms specializing in making parts for vehicles. In this post, we consider the location of vehicle assembly plants; in a later post we will look more closely at the characteristics of the vehicle assembly and autoparts industry in Mexico.

Vehicle assembly plants in Mexico, 2011

Vehicle assembly plants in Mexico, 2011. Credit: Tony Burton/Geo-Mexico; all rights reserved.

As the map shows, certain areas of Mexico have attracted more investment in vehicle assembly plants than other areas. The two largest existing concentrations are focused on Toluca in the State of México, and on Saltillo in northern Mexico. However, the fastest growing cluster is in the central state of Guanajuato, where two major plants are currently in the planning stages.

  • 1. What are the advantages and disadvantages of having several vehicle assembly plants in the same area?
  • 2. What the advantages and disadvantages of locating vehicle assembly plants far apart?
  • 3. Vertical linkages occur when one company controls many or all stages in the production of a product. For instance, an auto company may make its own engines and accessories to attach to the vehicles it makes. Horizontal linkages exist where one company is supplied with the components (engines, gearboxes) it needs by another company. What part do you think vertical and horizontal linkages might play when a major automaker decides where to locate a new vehicle assembly plant?
  • 4. Why are there no vehicle assembly plants in southern or eastern Mexico?
  • 5. What are the main reasons for the cluster of vehicle assembly plants near Mexico City and Toluca?
  • 6. Why has Ford chosen to locate its two plants in northern Mexico in different states?

Discuss your suggestions with your classmates and teacher. The answers to these questions should give you a useful list of the major factors that explain the distribution of vehicle assembly plants in any country, not just Mexico.

Related post:

A case study of clustering in a different industry

Are homicide rates in Mexico increasing? Perhaps, but…

 Other  Comments Off on Are homicide rates in Mexico increasing? Perhaps, but…
Aug 252011
 

This question is far more complicated to answer than might initially appear. To start with there are two primary sources of homicide data in Mexico which provide very different results and vary significantly from state to state and year to year.  The National System of Public Security (SNSP) compiles homicide statistics from police reports and investigations.  The National Institute of Statistics and Geography (INEGI) obtains homicide data from death certificates reported through the Ministry of Health. For 2010, SNSP reported 35,053 homicides in Mexico, while INEGI – Reporta el INEGI más de 24 mil muertes en 2010 – reported 24,374 homicides.

For a very interesting comparison (in Spanish) of trends over time for these two data sources, including a detailed look at the trends in some individual states, see:

For two earlier posts using SNSP data, see:

What factors may explain why the data is so different?

The terminology associated with homicides is very complex. This is equally true in English and Spanish. Even the basic subcategories do not necessarily match closely from the legal system in one country to that in another. Legal definitions and classifications depend in part on subjective decisions by officials concerning such things as the perpetrator’s motive, intent and state of mind.

In general terms, homicide (homicidio) means the deliberate killing of one person by another. A homicide may be either an:

  • intentional homicide or murder (homicidio doloso) or an
  • involuntary homicide, negligent homicide or case of manslaughter (homicidio culposo)

In some jurisdictions, intentional homicides are further divided into such categories as “first degree murder” and “second degree murder”.

The data associated with homicides are at least as complicated as the legal definitions. Statistics originating from police records will never exactly match those coming from death certificates or public records. For instance, some individuals may have been recorded originally as dying from accidents, natural causes or suicide on their death certificates, but then shown later to have been intentionally killed (murdered) and therefore counted in police records as murder victims. There are numerous possible scenarios in which the police data will differ from the data recorded on death certificates.

Differences in terminology, definitions and application may explain some of the differences in the two data sets, but is very unlikely to explain 100% of such significant differences, so care is needed before drawing any conclusions about Mexico’s homicide rate.

What do the figures for homicides suggest?

In 2000, INEGI, Mexico’s National Statistics Agency, recorded 10,743 homicides in Mexico. This number dropped gradually to 8,897 in 2007 before jumping up to 14,006 in 2008, 19,803 in 2009 and leaping  23% in 2010 to 24,374. Current information suggests the number of homicides will be at least as high in 2011.

The SNSP data have become significantly higher than INEGI data in recent years. They also show an increase in the number of homicides in 2010 (compared to 2009), but of only 11%.  Both data sets indicate a rapid increase. This is especially troublesome given that murder rates had declined rather steadily up until the “drugs war” started in earnest in 2007.

If we average the INEGI and SNSP numbers, it suggests that the overall 2010 homicide rate was about 27 per 100,000 population.

How does Mexico’s murder (intentional homicide) rate compare to that in other countries?

Wikipedia’s list of intentional homicide (murder) rates claims that Mexico’s murder rate in 2010 was 15 per 100,000. SNSP data for Mexico show 2010 figures of 18 per 100,000. Either of these figures is very high compared to Canada (1.6 per 100,000), Peru (3.2) or the USA (5). On the other hand, Mexico’s homicide rate is rather low compared to Honduras (78), El Salvador (65), Venezuela (48), South Africa (34) and Brazil (25). In 2007, Mexico’s murder rate was about 8.4 per 100,000, very close to the world average.

How many of Mexico’s murders are drug-war related?

Data released last January by the Mexican government indicated that drug-war deaths increased in 2010 by 5,659 from 9,614 to 15,273. These data suggest that 63% of Mexico’s intentional homicides in 2010 were related to drug violence compared to only 49% in 2009, 28% 2007 and roughly 10% in 2006. In fact, non-drug-war-related intentional homicides in Mexico appear to have declined 11% from 10,189 in 2009 to 9,101 in 2010, less than the total number of homicides in any year from 2000 through 2006.

This brings us back to our original question, “Are homicide rates in Mexico increasing?” Yes, they are increasing, but only as a result of the much publicized “war on drugs”. It is likely that if there was no drugs war, then Mexico’s homicide rate would be continuing to decline, consistent with its long-term trend.

Related posts, relying on data issued by the Office of the President of Mexico:

Car-makers building new assembly plants in Mexico

 Mexico's geography in the Press  Comments Off on Car-makers building new assembly plants in Mexico
Aug 232011
 

Two major Japanese car-makers—Mazda and Honda—have announced expansion plans in Mexico in recent months. They will help ensure that Mexico remains the 9th largest car manufacturer in the world, and the 6th largest vehicle exporter. In addition, Italian auto-maker Fiat is expanding its plant in Toluca.

Mazda plant in Salamanca

Mazda is building a new 500-million-dollar plant in Salamanca (Guanajuato) to assemble its best-selling Mazda2 and Mazda3 models. The Mazda3 is the Mazda’s top selling model in the USA. The Mazda plant, scheduled to open in 2013, will employ about 3,000 workers and produce 140,000 vehicles a year.

Honda plants in El Salto and Celaya

Honda, which currently has two manufacturing plants in El Salto (Jalisco), is to construct a third plant, in Celaya (Guanajuato). The new plant will produce the fuel-efficient Honda “Fit” for the North American market. Due to open in 2014, it represents an investment of 800 million dollars and will have the capacity to assemble 200,000 vehicles a year.

Mexican-made cars being exported to China

By early next year, Fiat will be producing 100,000 units a year of its model 500 at its new plant in Toluca, in the state of Mexico. Only 3.5% of these units will be sold in the domestic market. The remainder are destined for export markets, including China, Brazil and the USA. China has already received its first shipment of 100 exclusive “First Edition” vehicles and is expected to take 50,000 a year once the Fiat plant is operating at full capacity.

Related posts:

Mexico’s economic geography is analyzed in chapters 14–20 of Geo-Mexico: the geography and dynamics of modern Mexico. Buy your copy of this invaluable reference guide today!

Aug 222011
 

The proposed implementation of a United Nations-supported carbon storage program (REDD) in the southern Mexican state of Chiapas is provoking plenty of controversy. The debate is hotting up because a follow-up program called REDD+ is due to start in 2012. A good summary of the situation is provided by REDD rag to indigenous forest dwellers.

What is REDD?

  • REDD stands for Reducing Emissions from Deforestation and Forest Degradation
  • It is a carbon storage program, started in 2008 by the Food and Agriculture Organization (FAO), the U.N. Development Programme (UNDP) and the U.N. Environment Programme (UNEP).
  • It aims to conserve biodiversity and boost carbon storage by preventing deforestation and by replanting forests
  • It is focused on developing countries, and provides them wih funds and technical support

At first glance, it would seem like a good fit for Chiapas, one of Mexico’s poorest states, where a high proportion of the population are reliant on subsistence farming. The Chiapas state government backs REDD, considering it as one way of helping mitigate the likely consequences of climate change in the state. Chiapas’ total emissions of carbon dioxide amount to 32 million metric tons/year, about 4.5% of the national figure. The Chiapas contribution comes mainly from deforestation and farming.

NGOs working in Chiapas warn that REDD poses a serious threat to indigenous people. About 20% of the 4.8 million people living in Chiapas belong to one or other of the state’s numerous indigenous groups. Land tenure in many parts of Chiapas is hotly disputed; this was one of the reasons for the EZLN (Zapatista Army of National Liberation) uprising in 1994.

Protests in support of indigenous rights, Cancún climate summit

Protests in support of indigenous rights, Cancún climate summit, 2010

Miguel García, a spokesperson for an NGO founded in 1991 which supports indigenous groups and protects the environment, has been quoted as saying that REDD “will alter indigenous culture, will commodify it, giving commercial value to common assets like oxygen, water and biodiversity.” He is especially concerned that “resentment of and confrontation with the Zapatista grassroots supporters are being accentuated.”

As with so many geographic issues, there is no easy “right answer” here. The rights of indigenous groups need to be respected and their views taken into account, before any decision is made about the value of their forest home to global efforts to mitigate climate change.

This is one controversy we plan to follow as it plays out in coming months.

Want to read more?

Related posts:

Which cities have the best and worst water systems in Mexico?

 Books and resources  Comments Off on Which cities have the best and worst water systems in Mexico?
Aug 182011
 

The Water Advisory Council (CCA), a Mexican NGO specializing in water research, education and policy, has published its 2011 report on Mexico’s water management, sewerage and sanitation. The report looks at data for 50 Mexican cities, each of which has a population in excess of 250,000.

The report —Gestión del Agua en las Ciudades de México (Water Management in Mexican Cities)— uses data for 20 variables to develop the following 10 indicators: drinking water coverage; drainage and sewerage coverage; continuity and extension of services; productivity; metering; physical efficiency; business efficiency; operating income; wastewater treatment; and institutionalization.

In terms of overall performance, the city of León came top, followed by Saltillo, Monterrey, Mexicali, Aguascalientes, Cancún and Tijuana. Of the top six, three (Saltillo, Aguascalientes and Cancún) are managed by private operators, while León, Mexicali and Tijuana are public water systems. There is clearly no discernible difference between the performance of private operators and the best public systems. Towards the bottom of the rankings, all the cities have public water systems. The worst-ranking cities include several in the State of Mexico, as well as others in the south and southeast of the country.

For water quality, the leader was Ciudad Victoria, followed by Colima, Monterrey, León, Torreón, Tepic and Hermosillo. The ten worst were Villahermosa, Cuernavaca, Acapulco, Oaxaca, Xalapa, Chetumal, Chilpancingo, Celaya, Chimalhuacán and Campeche.

For efficiency, the leader was Saltillo, followed by León, Monterrey, Tijuana and Aguascalientes. The least efficient were Ecatepec, Campeche, Villahermosa, Celaya, Chilpancingo and Chimalhuacán.

The report says that where the private sector is involved, the important issues are transparent tenders; clear, balanced and flexible contracts; effective controls to prevent abuse; legal certainty; and effective regulation with stable, long-term regulating agencies.  The authors also emphasize the importance of pricing that reflects costs, and of removing the payment exemptions currently given to government agencies.

The Water Advisory Council argues that the Federal Agency for Environmental Protection (PROFEPA) should be in charge of all water monitoring, though its powers need strengthening to ensure it can fully carry out its mandate.

Aug 162011
 

In several previous posts we have looked at specific migration channels connecting Mexico to the USA:

A Mexican government website, for its Institute for Mexicans Abroad, has lots of statistics about the number of Mexicans registered at each of Mexico’s consulates (which number more than 40) in the USA, together with their state of origin. A series of handy interactive maps for 2008, 2009 and 2010 provide a quick overview of some of the major flows.

  • Mexicans registered in consulates in the USA, 2008
  • Mexicans registered in consulates in the USA, 2009
  • Mexicans registered in consulates in the USA, 2010

Hovering your mouse over any state in Mexico brings up details of which consulates in the USA attracted the highest number of registrations for migrants who originated from that state.

Example of map

Example of migration map, courtesy of Dr. Seth Dixon

By way of illustration, consider the patterns shown using the 2010 map for migrants who originated in the three states (Campeche, Yucatán and Quintana Roo) forming the Yucatán Peninsula. It turns out that migrants from the state of Yucatán are far more concentrated than migrants from the other two neighboring states. About 60% of all migrants from the state of Yucatán who registered in Mexican consulates in the USA registered in either San Francisco, Los Angeles (both California) or Portland (Oregon).

For migrants from Campeche, the “top three” consulates are Omaha (Nebraska), Atlanta (Georgia) and Dallas (Texas), but these three account for only about 22% of all Campeche migrants registered with a consulate, meaning that the spread of migrants from Campeche is far less focused than that of migrants from Yucatán state.

In the case of Quintana Roo, the top three consulates for registrations are San Francisco (California), Atlanta (Georgia) and Dallas (Texas); these three account for almost 40% of all registrations of migrants from Quintana Roo.

Identifying a pattern, or variations between the patterns for several states is one thing; explaining it is another!

Q. What factors might influence the differences in patterns noted for the three states of the Yucatán Peninsula?

The extraordinary ecological recovery of Mexico’s Cabo Pulmo Marine Park

 Updates to Geo-Mexico  Comments Off on The extraordinary ecological recovery of Mexico’s Cabo Pulmo Marine Park
Aug 152011
 

In an earlier post—Can Mexico’s Environmental Agency protect Mexico’s coastline? we took a critical look at proposals for a tourism mega-development near Cabo Pulmo on the eastern side of the Baja California Peninsula. Cabo Pulmo (see map), a village of about 120 people, is about an hour north of San José del Cabo, and on the edge of the Cabo Pulmo National Marine Park (CPNP).

Baja California Sur MapJacques Cousteau, the famous ocean explorer, once described the Sea of Cortés as being the “aquarium of the world.” The protected area at Cabo Pulmo, ideal for diving, kayaking and snorkeling, covers 71 sq. km of ocean with its highly complex marine ecosystem.

Cabo Pulmo is on the Tropic of Cancer, about as far north as coral usually grows. The water temperatures vary though the year from about 20 to 30 degrees C (68 to 86 degrees F).

The seven fingers of coral off Cabo Pulmo comprise the most northerly living reef in the eastern Pacific. The 25,000-year-old reef is the refuge for more than 220 kinds of fish, including numerous colorful tropical species. Divers and snorkelers regularly report seeing cabrila, grouper, jacks, dorado, wahoo, sergeant majors, angelfish, putterfish and grunts, some of them in large schools.

On my last visit to Cabo Pulmo in 2008, local fishermen and tourist guides regaled me with positive comments about the success of the National Marine Park, and the area’s recovery since the area was first protected in 1995. Ever since, I’ve wondered how much their positive take was due to wishful thinking, and how much was due to a genuine recovery in local ecosystems. My doubts have been answered by the publication of Large Recovery of Fish Biomass in a No-Take Marine Reserve in the Public Library of Science (PLoS) ONE journal. The article’s authors present compelling evidence, based on fieldwork, that the area has undergone a remarkable recovery.

Recovery of Cabo Pulmo Marine Park

Recovery of fish in the Cabo Pulmo National Marine Park (CPNP). Credit: Aburto-Oropeza et al (2011)

The graph above shows the changes in biomass for three distinct zones of the Sea of Cortés. The open access areas allow commercial fishing. The “core zones” are the central areas of other Marine Parks in the area, including those near Loreto, north of Cabo Pulmo. The CPNP is the Cabo Pulmo National Marine Park, where no fishing is allowed. Clearly, since the CPNP was established, the number and weight of fish inside the park boundaries really have increased rapidly.The total amount (biomass) of fish increased by a staggering 460% over 10 years.

The major reason for the success of the CPNP has been the strength of local residents in undertaking conservation initiatives, and their cooperative monitoring and enforcement of park regulations, sharing surveillance, fauna protection and ocean cleanliness efforts.

The Cabo Pulmo National Marine Park is perhaps the world’s best example of how local initiatives can lead to genuine (and hopefully permanent) environmental protection. The researchers describe it as “the most robust marine park in the world” and say that “The most striking result of the paper… is that fish communities at a depleted site can recover up to a level comparable to remote, pristine sites that have never been fished by humans.”

Here’s hoping that the residents of other parts of Mexico’s coastline threatened by fishing or tourism developments take similar actions and manage to achieve equally positive results for their areas.

Citation:

Aburto-Oropeza O, Erisman B, Galland GR, Mascareñas-Osorio I, Sala E, et al. (2011) Large Recovery of Fish Biomass in a No-Take Marine Reserve. Public Library of Science (PLoS) ONE 6(8): e23601. doi:10.1371/journal.pone.0023601

Further reading:

For an exceptionally informative series of papers (in Spanish) on all aspects of tourism and sustainability in Cabo Pulmo, see Tourism and sustainability in Cabo Pulmo, published in 2008 (large pdf file).

Another valuable resource (also in Spanish) is Greenpeace Spain’s position paper entitled Cabo Cortés, destruyendo el paraíso (“Cabo Cortés: destroying paradise”) (pdf file)

Aviation history as Mexico’s Aeroméxico uses biofuel for transatlantic passenger flight

 Mexico's geography in the Press  Comments Off on Aviation history as Mexico’s Aeroméxico uses biofuel for transatlantic passenger flight
Aug 132011
 

Aeroméxico, Mexico’s major international airline, made aviation history in July. Aeroméxico flight AM1, from Mexico City to Madrid, was the first ever commercial transatlantic passenger flight using bio-fuel. The Boeing 777 flew on a mixture of biofuel and regular jet fuel. Earlier this year, another Mexican airline, Interjet, began using renewable jatropha-based biofuel for flights between Mexico City and Tuxtla Gutierrez in the southern state of Chiapas. Jatropha is a genus of plants, mainly shrubs, that grow wild in several parts of Mexico, including Chiapas. Plantations of jatropha require four or five years of cultivation before the plant is sufficiently mature for commercial harvesting.

Jatropha-based biofuel is marketed as “green jet fuel” and is currently significantly more expensive than regular jet fuel. However, the price of biofuel is expected to fall rapidly as more of it is produced. The “life-time” emissions from using jatropha (including its growing period, processing and combustion) are estimated to be at least 60% less than using conventional jet fuel.

Sources of biodiesel.

Sources of biodiesel. Credit: Bayer CropScience

Mexico’s aviation sector will need 40 million liters of biofuel a year by 2015 in order to meet the national target of 1% of all airline fuel coming from renewable sources. The aviation industry’s long-term target is to halve its 2005 carbon footprint by 2050.

Despite Mexico’s recent adoption of jatropha-based biofuel, there is considerable controversy about the plant’s real value as a sustainable source of renewable energy. See, for example, the critique “Hailed as a miracle biofuel, jatropha falls short of hype” on Yale Environment 360, a publication of the Yale School of Forestry & Environmental Studies.