RR

Sep 202012
 

Mexico is rapidly becoming a world leader in vehicle production, which includes cars, commercial vehicles such as large trucks, pick-ups and SUVs (sports utility vehicles). Back in 1995, Mexico produced fewer than a million vehicles and ranked 12th globally. By 2011 it was making 2.68 million, placing it 8th in the world (see table). During the 16 year period, Mexico surpassed France, Canada, the U.K., Russia, Italy and Spain. China and India moved ahead of Mexico during the period.

Mexico’s impressive 1995 to 2011 growth of 185% was third among top vehicle producers, but trailed way behind the amazing growth of China at 1170% and India at 515%. Others experiencing significant growth include Brazil up 109%, Russia up 101%, South Korea up 84% and Germany up 35%. Except for Spain, which edged up less than 1%, all the other other major vehicle producers experienced significant declines in the number of vehicles produced: USA (- 28%), Japan (-18%), U.K. (-17%), France (-15%) and Canada (-12%). The data clearly indicate that vehicle production is shifting rather quickly from the major producers of past decades to a number of emerging economies with lower labor costs. Germany appears to be the only exception to this shift. In North America, production has shifted from the USA and Canada to Mexico, largely as a result of NAFTA.

2011 Production Statistics (Source: International Organization of Motor Vehicle Manufacturers)

Country Cars Commercial vehicles
Total Change from 2010
(millions of vehicles)
China 14.5 3.9 18.4 0.8%
USA 3.0 5.7 8.7 11.5%
Japan 7.2 1.2 8.4 –12.8%
Germany 5.9 0.4 6.3 6.9%
South Korea 4.2 0.4 4.7 9.0%
India 3.0 0.9 3.9 10.4%
Brazil 2.5 0.9 3.4 0.7%
MEXICO 1.7 1.0 2.7 14.4%
Spain 1.8 0.5 2.4 –1.4%
France 1.9 0.4 2.3 2.9%
Canada 1.0 1.1 2.1 3.2%
Russia 1.7 0.2 2.0 41.7%
TOTAL 59.9 20.2 80.1 3.1%


Mexico vehicle production grew by over 14% from 2010 to 2011, the fastest among all major producers except Russia, which advanced at a very impressive 42% (see table). Available data indicate that Mexico’s rapid growth has continued into 2012. Interestingly, the USA’s growth of 12% over its lackluster 2010 total placed it 3rd, ahead of India (10%), South Korea (9%) and Germany (7%). Surprisingly, Brazil and China grew by less than 1%, though China’s 2011 production level of over 18 million vehicles was over twice as many as its nearest rivals, the USA and Japan.

Just looking at commercial vehicles, which include pick-ups and SUVs, Mexico ranks a very impressive 5th in the world with over a million vehicles, behind only the USA, China, Japan and Canada. On this list, Germany and South Korea drop back to 11th and 12th behind Thailand, India, Brazil, Turkey and Spain.

Source of data:

Related posts:

Mexican attitudes on the drug war, violence and crime

 Mexico's geography in the Press  Comments Off on Mexican attitudes on the drug war, violence and crime
Jul 162012
 

Mexican drug cartels and related violence have received enormous attention. For an overview, see Mexico’s drug cartels and their shifting areas of operation, a 2012 update. All Mexicans are aware of the issue and millions have been affected directly. What are their current views and attitudes? A face-to-face survey in April 2012 by the Pew Research Center of 1,200 Mexicans in Mexico sheds light on this issue.

Most Mexicans (80%) support President Calderon’s decision to use the military to fight drug traffickers. On the other hand, less than half (47%) think the campaign against drug traffickers is “making progress”. Fully 30% feel the government is losing ground. While they support use of the military, 74% indicate that human rights violations by the military and the police are a “very big problem”.

Mexicans are not sure which political party is better for dealing with Mexico’s drug problems. Just over a quarter (28%) think President Calderon’s National Action Party (PAN) (28%) would do a better job compared to 25% for the Institutional Revolutionary Party (PRI) and only 13% for the Party of the Democratic Revolution (PRD). Fully 23% said that none of the three major parties is capable of resolving the issue. A possible reason for this is that only 14% blame mostly Mexico for the problem, compared to 22% who mostly blame the USA and 61% who blame both countries.

In general, Mexicans want the USA to help solve the drug problem. Fully 75% favor the USA training Mexican police and military personnel and 61% also approve of the USA providing money and weapons to the country’s police and military. On the other hand only a third favor deploying USA troops within Mexico, while 59% oppose this.

Mexicans feel that their country is facing some serious problems. Three-quarters of Mexicans think cartel-related violence (75%) and human rights violations by police and military (74%) are “very big problems”. The related issues of crime (73%), corruption (69%) and illegal drugs (68%) were also identified as “very big problems” by most survey respondents. Apparently, Mexicans do not feel very safe. More than half (56%) said they were afraid to walk alone at night within a kilometer of their home, 61% for women and 51% for men. Unfortunately, Mexicans are not very optimistic that the country’s drug violence problems will go away any time soon. On the bright side, 51% of the surveyed Mexicans felt their economy would improve in the next year compared to only 16% who thought it would worsen.

Related posts:
Jul 122012
 

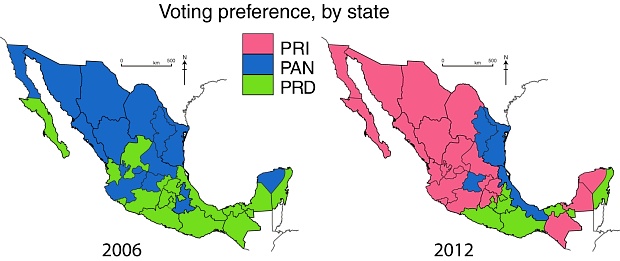
An earlier post discussed the north-south divide apparent in the 2006 presidential election. That year Felipe Calderón of PAN got the most votes in 14 of 17 northern states (blue on the map), while in 13 of 15 southern states Andrés López Obrador of PRD (green) got the most votes. Roberto Madrazo of PRI (pink) did not get the most votes in a single state.

Voting patterns in presidential elections, 2006 and 2012

Voting patterns in presidential elections, 2006 and 2012. All rights reserved.

The voting pattern changed considerably in the 2012 presidential election, but a north-south pattern still emerged. What was somewhat similar in both elections is that López Obrador of PRD retained much of his strength in southern Mexico. In both elections, PRD got most votes in seven southern states: Federal District, Morelos, Tlaxcala, Guerrero, Oaxaca, Tabasco and Quintana Roo. In 2012 PRD won in one other state, Puebla, which favored PAN in the 2006 election. Six southern states switched from PRD to PRI:  Michoacán, México, Hidalgo, Veracruz, Chiapas and Campeche. Puebla switched from PAN to PRD, while Yucatán went from PAN to PRI.

In the north, the pattern changed completely with the PRI replacing PAN as the highest presidential vote-getter. A total of 11 northern states switched from PAN to PRI: Baja California, Sonora, Chihuahua, Coahuila, Sinaloa, Durango, Aguascalientes, San Luis Potosí, Jalisco, Colima and Querétaro. In 10 of these states PAN came second while PRD took second place in Baja California. In 2012 PAN got most votes in only three states–Nuevo León, Tamaulipas and Guanajuato–compared to 16 in 2006.

PRD appears to have lost much of its relatively weak following in northern Mexico. The three northern states PRD won in 2006 all switched to PRI: Baja California Sur, Nayarit and Zacatecas. In 2012, PRD could only manage second place finishes in three states: Baja California, Nayarit and Zacatecas.

While the north-south pattern is still somewhat apparent, the main pattern of the 2012 presidential election is a strong victory for PRI candidate Enrique Pena Nieto. PRI was victorious in 22 of 32 states and came in second in the other ten.

However, PRI fell just short of controlling Mexico’s Congress so it will need support from some other parties to pass needed legislation and reforms. Together with minority coalition partner PVEM (Mexico’s Green Party), PRI won 240 of the 500 seats in the Chamber of Deputies and 62 of the 128 seats in the Senate. On the other hand, PRI has recently indicated support for many reforms similar to those previously proposed by PAN. This implies that needed reforms may have a decent chance of passing.

Further reading, with state by state analysis:

Related posts:

Have Mexicans given up on the dream of moving to the USA?

 Updates to Geo-Mexico  Comments Off on Have Mexicans given up on the dream of moving to the USA?
Jul 092012
 

A recent post noted that net migration from Mexico to the USA has dropped to essentially zero. Does this mean that Mexicans no longer have any interest in moving to the USA? The answer to this question is complicated. Obviously, many Mexicans living in Mexico would like to join their family members in the USA if it were legally possible. Others might feel that their career ambitions or the aspirations of their children might be better served by living in the USA. On the other hand, many Mexicans in the USA might feel that their lives would be better if they lived in Mexico.

A face-to-face survey in April 2012 by the Pew Research Center of 1,200 Mexicans in Mexico sheds light on this issue. According to the survey, 56% had a favorable view of the USA, compared to 52% in 2011. Only 34% had an unfavorable view of the USA, down from 41% in 2011. The views varied significantly by age and education. Sixty percent of 18 to 29-year-olds had a positive view compared to only half of those over age 50. Fully 66% of those with a post-secondary education had a favorable view compared to less than half (48%) of those with less education.

Over half (53%) think that Mexicans who move to the USA have a better life, up sharply from 44% in 2011. This suggests that there is still considerable interest in migration. Only 14% indicated they had a worse life, down from 22% a year earlier. However, 61% said they would not move to the USA if they had the means and opportunity. On the other hand, 37% said they would move to the USA and of these 19% indicated they would move even without legal documentation. Not surprisingly, younger Mexicans and those with more education were more interested in moving to the USA.

The survey data indicate that when/if US unemployment declines and there are again ample job opportunities in the USA, many Mexicans may migrate legally or illegally to fill those jobs. Of course, employment opportunities in Mexico will be a very important factor affecting decisions about migration. While the Mexican economy has recovered from the severe recession far better than the USA, still 62% of surveyed Mexicans described the economy as “bad”, down from 75% in 2010 and 68% in 2011. But Mexicans remain optimistic, 51% say the economy will improve in the next year compared to 32% who think it will remain the same, and only 16% who believe it will be worse. The Mexicans more willing to migrate, those with higher educations and incomes, are more optimistic about Mexico’s economic future. If the gap between US and Mexican economic opportunities continues to shrink in the decades ahead, we can expect Mexicans to become less interested in moving to the USA.

Related posts:

Mexico’s position among the world’s largest economies: 1900 to 2008

 Other  Comments Off on Mexico’s position among the world’s largest economies: 1900 to 2008
Jul 072012
 

Comparing the historical sizes of national economies is extremely challenging. Fortunately, Gapminder has attempted to do this by compiling GDP data for all countries in the world for the period since 1800. (For details, see here and here.) Gapminder’s approach relies on first obtaining for each country historical population size and Gross Domestic Product per capita (GDPpc) and then multiplying these to obtain the GDP. Gapminder relies on quantitative and qualitative data from hundreds of official and unofficial documents and a number of carefully documented assumptions.

Mexico’s total GDP has grown almost 60-fold since 1900 in inflation-adjusted constant 2005 dollars based on Purchasing Power Parity, which measures total goods and services produced by an economy independent of exchange rates. Growth started rather slowly, but accelerated very rapidly at mid-century. From 1940 to 1980, Mexico’s economy almost doubled each decade, moving up from $49 billion in 1940 to $637 billion in 1980, averaging about 6.6% per year. Of course, Mexico’s population was also growing rapidly during those four decades. Growth slowed to 2.0% per year in the 1980s but jumped up to 3.4% in the 1990s. From 2000 to 2008, growth slowed to 2.1% per year, partially as a result of the severe recession in the USA. Mexico’s economy is expected to grow significantly faster in this decade.

Growth of major world economies, 1900 to 2008 (Gapminder data)

(GDP in billions of constant 2005 US dollars based on Purchasing Power Parity)

Country19001930195019802008Growth/yr, 1900-2008
Brazil10381069371,8584.9%
Canada23731485771,2113.8%
China3214972169178,8623.1%
France1672672971,0951,8752.3%
Germany2554064161,7342,7012.2%
Indianana2085732,951na
Indonesia2655562288373.3%
Italy721492109151,6142.9%
Japan771652222,1603,9853.7%
MEXICO2336946371,3343.8%
Russianana375na2,089na
South Korea712161651,1774.9%
UK2403514901,0252,0042.0%
USA5061,1562,4146,33912,9603.1%

In 1900, Mexico’s total GDP of $23.3 billion was just ahead of Canada and over twice that of Brazil. However it was behind Indonesia and less than 5% of the USA’s world leading GDP. The Mexican economy was less than one tenth that of Germany and the UK, a seventh that of France and less than a third that of Japan and Italy. The table shows GDP levels for some of the world’s largest economies from 1900 to 2008.

The Mexican GDP expanded by 1.5% per year from 1900 to 1930 despite stagnation during the Mexican Revolution of 1910 to 1920. While this growth rate was better than UK, and tied with China, it was slower than the other countries in the table which expanded rapidly at the start of the 20thcentury. Brazil spurted ahead at 4.4% per year, edging past Mexico as Latin America’s largest economy. Canada expanded by 3.9% per year and doubled Mexico’s GDP. The USA grew by 2.8% per year becoming the first trillion dollar economy by 1923. France and Germany grew at about 1.6% per year, while Japan, Indonesia and Italy expanded by about 2.5% to 2.6%.

From 1930 to 1950, Mexico grew rapidly to $94 billion at a very impressive 4.9% per year, faster than all the other countries except Brazil at 5.3% per year. The USA (up 3.8% per year) and Canada (up 3.6%) also expanded rapidly, while the UK, Italy and Japan grew much slower, in the 1.5% to 1.7% range. The other countries struggled at rates around 0.5% or less. China’s GDP declined by a mind-boggling 4.1% per year during the 20 years from $497 billion down to $216 billion, more than a third less than what it had been in 1820! China’s economy seriously contracted over a 130 year period. The Great Depression hurt most economies; however World War II allies Japan (up 5.8% per year) and Germany (up 3.9%) grew relatively rapidly during the 1930s.

The 1940s and World War II had very dramatic impacts on the major economies. During the decade, Mexico’s GDP led the field with very impressive growth at 6.7% per year, closely followed by Brazil at 6.2%, USA at 5.2% and Canada at 5.0%. Wartime production was a major stimulus to these economies. On the negative side, several countries experienced dramatic war-related loses. China was at war throughout the decade and its economy declined by an incredible 7.0% per year during the 1940s, Germany was down by 3.5%, Japan by 2.6%, South Korea by 2.7% and Indonesia by 2.5%. Compounding these annual changes demonstrates their real significance. Mexico’s GDP almost doubled from $49 billion in 1940 to $94 billion in 1950, while China’s GDP dropped more than half from $447 billion in 1940 to $216 billion in 1950. By 1950, Mexico’s GDP was nearly half that of China and Japan, 1.7 times that of Indonesia and over six times that of South Korea. These four Asian countries would grow very rapidly during the “Asian Miracle” of the second half of the 20th century.

Mexico continued its dramatic growth expanding by 6.6% per year from 1950 to 1980. This was the “Mexican Miracle” which actually started in the 1940s. By 1980, Mexico’s GDP reached $637 billion, surpassing Canada and India; it was above one tenth of the USA’s GDP for the first time in over 100 years. All other economies also grew very rapidly during this thirty year boom period. Japan led the way with 7.9% per year, followed by Brazil at 7.5% per year. China finally broke from its 130 year slump growing at 4.9% per year; in 1956 it finally regained the GDP level it had in 1820. In 1980 Mexico’s GDP was about 70% that of China compared to only 7% in 1930 and 2% in 1820.

From 1980 to 2008, Mexico’s growth slowed a bit but still managed a very respectable increase of 2.7% per year which doubled its GDP from $637 billion to $1.334 trillion. This growth rate was better than that of Japan and all other large western economies (tied with Canada). But it significantly lagged behind four large Asian economies: China (up 8.4% per year), India (up 6.0%), South Korea (up 7.3%) and Indonesia (up 4.8%). China’s GDP increased almost ten-fold from 1980 to 2008. In 1980 India’s GDP was less than that of Mexico, but by 2008 it was over twice as large. Mexico’s GDP in 2008 of $1.3 trillion puts it in 11thplace, behind Italy and just ahead of Spain, Canada and South Korea.

Reviewing the entire 108-year period from 1900 to 2008 reveals the dramatically changes that can occur. Some Asian countries, especially China, really struggled for decades early in the century and then expanded extremely rapidly in recent decades. Compared to the other countries, Mexico did extremely well increasing at an average of 3.8% per year from $23 billion in 1900 to $1.3 trillion in 2008, a 57-fold increase. Brazil and Korea did considerably better, averaging 4.9% per year for 180-fold increases. Even the slowest growth country, the UK, grew by a respectable 2.0% per year for over an eight-fold increase since 1900. All major economies did well making the 20thcentury clearly the best century by far in terms of economic growth. The total GDP of 12 countries (Brazil, Canada, China, France, Germany, Indonesia, Italy, Japan, Mexico, South Korea, UK and USA)in the table with available data grew by 2.0% per year from 1900 to 1950 compared to a very impressive 3.8% per year from 1950 to 2008. The second half of the century was much better than the first; this indicates that economic growth is accelerating and accelerating fast. Will this continue in the decades ahead?


Is Mexico the world’s 13th or 14th largest country?

 Other  Comments Off on Is Mexico the world’s 13th or 14th largest country?
Jul 022012
 

One would think that with satellite imagery there would be no question concerning the land area of countries. However, when talking about area there are some definitional issues. Are we talking about “land area” or “total area” which includes land area and inland water bodies such as lakes, reservoirs and rivers? This can be important when talking about the relative size of countries.

Without question Russia is the largest with nearly twice the area of the second place country. What are the second, third and fourth place countries? If we are talking about “land area”, excluding inland waters, then China is second (9.570 million square kilometers), the USA is third (9.162m sq km) and Canada is fourth (9.094m sq km). However, when inland waters are included to get “total area” then Canada is second (9.985m sq km), China is third (9.597m sq km) and the USA is fourth (9.526m sq km). Generally “total area” is the measure used to compare the geographic areas of countries (see table).

Total area of the world’s largest countries (millions of square kilometers)

RankCountryArea (millions of sq. km)RankCountryArea (millions of sq. km)
1Russia17.09811Congo2.345
2Canada9.98512Saudi Arabia2.150
3China9.59713Mexico1.964
4USA9.52614Indonesia1.911
5Brazil8.51515Sudan (post 2011)1.861
6Australia7.69216Libya1.759
7India3.16617Iran1.648
8Argentina2.78018Mongolia1.564
9Kazakhstan2.72519Peru1.285
10Algeria2.381

Generally we might expect a country’s geographic area rank to stay the same from year to year and even decade to decade. However, this is not the case. Prior to 1991 Mexico was considered the world’s 13th largest country. However with the dissolution of the Soviet Union in 2011, Kazakhstan became an independent country ranked 9th in total area. This pushed Mexico down to 14th.

When South Sudan split away from Sudan in mid 2011, the area of “new” Sudan was reduced by over 25%. This dropped Sudan from 10th to 15th on the list of the world’s largest countries. It also moved Mexico from 14th back up to 13th place on the list. Such political changes can have enormous impact on the size of countries. For example, prior to 1951 when Tibet was considered an independent country, the size of China was an eighth smaller than it is now. Mexico before 1846 was almost twice its current size and perhaps the fifth largest independent country behind only Russia, China, the USA and Brazil.

Another issue concerns whether Greenland (2.166m sq km)  is counted as a country. While Greenland is officially a dependency of Denmark it has been moving toward independence. In 1985 it left the European Economic Community (EEC) while Denmark remained in the EEC. Greenland has its own Parliament and Prime Minister; in June 2009 Greenland assumed self-determination with Greenlandic as its sole official language. If/when Greenland becomes officially an independent “country” it will be the world’s 12th largest, bumping Mexico back into 14th place. Until this happens, Mexico remains the world’s 13th largest country.

The changes in rank discussed above came about for political reasons. They did not involve any physical changes. With global warming and rising sea levels some countries will actually become geographically smaller. However these changes will not affect the area ranking of the 20 largest countries for at least the next hundred years.

Related posts:


Mexico’s GDP and position among the world’s largest economies, 1800 to 1900

 Other  Comments Off on Mexico’s GDP and position among the world’s largest economies, 1800 to 1900
Jun 302012
 

Comparing the historical sizes of national economies is extremely challenging. This post relies on data from Gapminder which has attempted to do this for all the countries in the world for the period since 1800. Gapminder’s approach relies on first obtaining for each country historical population size and Gross Domestic Product per capita (GDPpc; for more details, see Standard of living in Mexico since 1800: some international comparisons) and then multiplying these to obtain the GDP. To obtain historical measures of population and GDPpc, Gapminder relies on quantitative and qualitative data from hundreds of official and unofficial documents and a number of carefully documented assumptions. In some cases they admit that some of their numbers for years before 1900 are essentially well-educated “guesstimates”. [Full details are given in the pdf file “Documentation for GDP per capita by purchasing power parities“.]

Though the Gapminder data have limitations, they are about the best source for comparing the GDP growth of Mexico since 1800 with that of other large economies. The Gapminder GDPpc data are adjusted for inflation by using constant 2005 US dollars. They are also based on Purchasing Power Parity (PPP) which measures total goods and services produced by an economy independent of exchange rates.

During the 19th century Mexico’s total GDP grew at a relatively unimpressive 1.3% per year, which was only about 0.5% above population growth. In 1800, Mexico’s estimated GDP was just over $6 billion, ranking it second in the Americas. Though this was almost nine times the GDP of Canada, and 3.6 times that of Brazil, it was less than that of Nigeria and half that of the USA. China had by far the largest GDP in 1800 at about $290 billion, more than three times the GDP of second place India, over seven times that of Japan and the large European countries (France, Germany and the UK) and over 20 times that of the USA. The table below shows the estimated GDP levels from 1800 to 1900 for some of the world’s current largest economies.

Estimated total GDP of large economies, 1800 to 1900

(GDP in billions of constant 2005 US dollars based on Purchasing Power Parity)

Country1800182018701900Growth/yr, 1800-1900
Brazil1.72.47.010.31.8%
Canada0.71.19.323.13.6%
China286.9328.8279.1320.90.1%
France38.447.1113.5167.31.5%
Germany36.048.5113.2254.72.0%
India91.098.2118.8nana
Indonesia8.39.316.026.31.2%
Italy23.629.344.671.61.1%
Japan31.133.639.676.60.9%
MEXICO6.17.39.123.31.3%
Russia25.626.2nanana
UK34.945.4151.3240.12.0%
USA12.720.1261.3506.03.8%

From 1800 to 1820, just before gaining independence, the Mexican economy grew to $7.3 billion at a sluggish rate of about 0.9% per year. In contrast, Canada and the USA expanded at around 2.3% per year while Brazil’s GDP went up about 1.9% per year. Germany, France, UK and Italy grew at roughly 1.0% to 1.5% per year. The major Asian countries–China, India, Japan and Indonesia–only managed 0.4% to 0.7% per year. The Russian economy essentially stagnated during the 20 year period. China maintained the top position with over three times the GDP of India and over six times those of the large European economies.

By 1870, Mexico’s GDP had inched up over $9 billion growing rather slowly at just over 0.4% per year since 1820; this was slower than the population growth rate. While Mexico’s growth rate was better than the three biggest Asian economies, it severely lagged behind its northern neighbors which grew very rapidly based on industrialization and immigration. Canada’s economy expanded by an impressive 4.4% per year and edged past Mexico. The USA did almost as well at 4.2% per year to move into second place behind China, which declined by a surprising 0.3% per year over the fifty year period. (In China both GDPpc and population declined from 1820 to 1870.)

Brazil grew by a solid 2.1% per year and closed the gap with Mexico. The three largest European economies were also industrializing and grew by roughly 1.7% to 2.0% per year, but they were still overtaken by the USA. While Indonesia’s GDP expanded by about 1.1% per year, growth rates for Japan and India were less than 0.4% per year.

From 1870 to 1900, under the Porifiro Diaz regime, Mexico’s economy grew rapidly at about 3.2% per year up to $23.3 billion. This put Mexico just ahead of Canada which grew slightly more slowly at roughly 3.1% per year. Mexico’s estimated GDP in 1900 was just behind that of Indonesia but over twice that of Brazil which slowed to 1.3% per year. The USA sped ahead at 3.9%. In the early 1880s it became the world’s largest economy by overtaking China which grew slowly at less than 0.5% per year. In 1900 China’s estimated GDP was actually less than it had been 80 years earlier in 1820. By 1900 the USA’s estimated GDP was over $500 billion, about 22 times that of Mexico. Germany grew at an impressive 2.7% per year becoming Europe’s largest economy by moving past the UK which grew at 2.2%, about the same rate as Japan. Growth in France and Italy was significantly slower.

During the full 19th century, Mexico almost quadrupled its GDP but its overall economic performance was fair at best. Its growth rate of just over 1.3% per year was better than the Asian countries which performed poorly during the century. The USA registered a very impressive 3.8% growth per year resulting in a fortyfold GDP increase. Canada was a close second with 3.6% per year and a 34-fold increase. Germany and the UK had seven-fold increases with growth rates near 2.0%, followed by Brazil at 1.8% growth per year. France followed with growth averaging just under1.5% per year. Though these Gapminder GDP levels have some limitations, they do give a pretty good indication of relative historical economic sizes and growth rates.

Mexico’s economic performance was much better in the 20thcentury as was that of all major world countries. A future post will focus on economic growth since 1900.


Standard of living in Mexico since 1800: some international comparisons

 Other  Comments Off on Standard of living in Mexico since 1800: some international comparisons
Jun 232012
 

Comparing historical standards of living for different countries over long periods of time is extremely challenging. This post relies on data from Gapminder which has attempted to do this for all countries in the world since 1800. Their approach relies on quantitative and qualitative data from hundreds of references and a number of carefully documented assumptions. They obtained input from a very wide range of official and unofficial documents and combined these to come up with their best estimates. In some cases they admit that some of their numbers for years before 1950 are essentially well-educated “guesstimates”. [For more details, see “Documentation for GDP per capita by purchasing power parities” (pdf file).]

Though the Gapminder data have some limitations, they are about the best source for comparing standards of living in Mexico since 1800 with a number of other middle income countries. The measure of standard of living used in this post is the Gapminder indicator of Gross Domestic Product per capita (GDPpc) at constant 2005 US dollars based on Purchasing Power Parity (PPP) which measures total goods and services produced by an economy independent of exchange rates.

The data indicate that Mexico’s GDPpc has grown over eleven-fold since 1800 from over $1,000 to almost $12,000. This increase sounds very impressive but actually represents an average annual increase of under 1.2% per year. The eleven-fold increase demonstrates the power of compounding. The growth has not been constant. During the 19thcentury Mexico’s GDPpc actually decreased slightly up until 1870, but then expanded relatively rapidly under the Porfirio Diaz regime, almost doubling between 1870 and 1900. For the century as a whole it increased an average of about 0.5% per year. The rate of increase more than doubled during the first half of the 20th century to 1.2%. It doubled again to 2.5% during the second half of the 20th century, which included the so-called “Mexican Miracle”, which started in the 1940s. After 2000, as a result of the very severe recession in the USA, Mexico’s growth slowed to 0.6% per year for the period 2000-2011. Growth is expected to increase significantly during the present decade.

Income growth in Mexico since 1800 (Gapminder data) 

(Incomes values are at constant 2005 US dollars based on Purchasing Power Parity)

Country18001900195020002011Growth/yr, 1800-2011
Argentina8724,0116,32310,77114,5951.3%
Brazil5095981,9047,81910,1921.4%
Chile7022,3063,61210,10613,6111.4%
China9868024272,7847,9311.0%
Cuba1,124na4,9585,8249,4691.0%
India5635855881,6072,9720.8%
Indonesia5146046662,6273,9991.0%
Iran7501,3472,8168,26011,6661.3%
South Korea59667070815,69225,2561.8%
MEXICO1,0541,7223,07410,35911,7541.2%
Peru6979963,2895,7058,4201.2%
Russia824nana7,79214,3181.4%
South Africa759na4,7667,3349,2841.2%

The table compares the 1800 to 2011 GDPpc of Mexico with 12 other middle and low income countries. In 1800, Mexico was ahead of all other countries in the table except Cuba. By 1900, Argentina had moved past and its GDPpc was more than double that of Mexico. Argentina’s GDPpc growth rate for the 19thcentury was over three times that of Mexico. Chile also moved ahead of Mexico. On the other hand, Brazil grew very slowly at only about 0.2% per year during the century; it actually declined between 1870 and 2000. By 1900, its GDPpc was about equal to that of India and a third that of Mexico.

In 1800, China’s GDPpc trailed Mexico by only about 6.5%; but declined by about 0.2% per year during the 19thcentury when China’s economy seriously stagnated as a result of opium wars and numerous internal rebellions which took from 20 to 40 million lives. By 1900, China’s GDPpc was less than half that of Mexico. India, South Korea and Indonesia also grew very slowly during the century. Their GDPpcs went from about half that of Mexico to about a third. There was no Asian economic miracle during the 19th century.

By 1950, Mexico trailed Argentina, Chile, Peru, Cuba and South Africa. From 1900 to 1950, the GDPpc of Mexico grew by a respectable 1.2% per year; however Peru and Brazil grew twice as fast. At the other end, the Asian countries did rather poorly. For example, China’s GDPpc declined by an amazing 1.2% per year from 1900 to 1950, when the country suffered from competing warlords, a protracted civil war, and Japanese invasion. By 1950, China’s GDPpc was less than half of what it had been in 1800 and also was behind India and less than a seventh that of Mexico. From 1900 to 1950, India’s GDPpc grew by only 0.01% per year while Indonesia and South Korea did only marginally better. The mid 20thcentury wars were very damaging to the Asian economies.

By 2000, Mexico had almost caught up with Argentina and had surpassed Chile, Peru, Cuba and South Africa. While Mexico’s growth from 1950 to 2000 of about 2.5% per year was very impressive, Brazil grew even faster at 2.9% per year. South Korea’s GDPpc surged ahead by an amazing 6.4% per year during the second half of the 20th century; it increased over twenty-fold from about $700 to over $15,000. China also grew at a very impressive 3.8% per year posting over a six fold increase. These two countries recovered briskly after their numerous wars and kept moving ahead at a rapid clip.

During the years between 2000 and 2011, Mexico had the worst performance of the countries in the table, growing at only 1.6% per year. China grew over eight times faster than Mexico; India and Russia grew almost five times faster. The growth rates of the other Latin American countries in the table – Argentina, Brazil, Chile, Cuba and Peru – were over twice that of Mexico. However, the Mexican economy is closely tied to the USA where GDPpc grew less than half as fast as Mexico. As mentioned previously, Mexico is expected to grow briskly during the rest of this decade.

It is interesting to look over the full 211 year period from 1800 to 2011. Interestingly throughout the whole period the GDPpc of Iran slightly trailed that of Mexico. The gap between these two countries closed a bit during the 211 year period. As a result of its rapid surge in recent decades, South Korea grew the fastest at 1.8% per year; it moved from one of the poorest in 1800 to the richest in the table. Other solid growth rates were posted by Argentina, Brazil, Chile, Iran and Russia. The slowest growth occurred in India, at only 0.8% per year, followed by Indonesia and China at slightly less than 1.0% per year. However, these Asian countries are now growing considerably faster than the other countries in the table. Looking at income growth over the last two hundred years puts the current situation in perspective. It is interesting to speculate on what the next two hundred years will bring, something we will return to in future posts.

Related posts:
Jun 042012
 

A previous post—How “complex” is the Mexican economy?—discussed The Atlas of Economic Complexity and noted that Mexico’s Economic Complexity Index (ECI) of 1.145 ranked it 20th among 128 countries. ECI indicates a wide range of complex knowledge capabilities related to productive enterprises. Mexico has a very high ECI given its income level; all other countries in the top 20 have significantly higher incomes than Mexico.

According to the Atlas, during the rest of the decade Mexico’s GDP should grow relatively rapidly to catch up with its ECI. Analyses in the Atlas indicate that during the last few decades countries with higher than expected ECIs compared to their income levels experience more rapid economic growth. While this relationship is empirically true, it should be noted that it does not explicitly include other factors thought to be important to economic growth (see Section 4 of the Atlas). Some of these other factors are governance and institutional quality, corruption, political stability, measures of human capital and competitiveness indicators. The Atlas implies that these other factors contribute to and thus are indirectly part of the Economic Complexity Index.

The analysis in the Atlas predicts that Mexico’s annual growth in real per capita GDP will be 3.5% from 2009 to 2020, ranking it 10th in the world in growth rate (see table). (The growth rates for some other countries are given in footnote 1 below.)  Mexico’s annual growth in real per capita GDP is impressive given that its growth was only 0.8% per year for 1999 to 2009, the same as that for the USA. Growth in these two countries was slowed significantly during this period as a result of the very severe recession, the worst since the great depression. This rather slow growth is surprising given that Mexico’s ECI increased from 1998 to 2008 was ranked 30th worldwide. Though the Mexican economy suffered significantly during this period, it continued to develop new productive capabilities and become more complex. This added complexity is expected to generate accelerated economic growth in the current decade.

RankCountry% growth in GDP/person, 1999-2009Expected % growth in GDP/person, 2009-2020, Income/person, 2009Expected income/person, 2020
1China9.64.33,7445,962
2India5.64.31,1921,886
3Thailand3.14.03,8936,023
4Belarus7.94.05,0757,806
5Moldova4.84.01,5162,321
6Zimbabwe449.03.8 - 6.2676?
7Ukraine5.23.72,4683,694
8Bosnia-Herzegovina4.13.64,5256,669
9Panama3.93.67,15510,529
10MEXICO0.83.58,14311,894

The low growth rate of 0.8% per year for 1999 to 2009 represents “real” per capita growth corrected for inflation and population growth. In nominal terms, Mexico’s total GDP growth from 1998 to 2008 was 1.8% per year. It is expected to grow 4.8% per year for 2009 to 2020, which ranks its 22nd in the world, behind numerous poor African countries with rapidly growing populations. Of large or populous world countries, the only ones ranked ahead of Mexico are India (ranked 8th), the Philippines (12th), Egypt (14th), Pakistan (18th) and China (20th).

In summary, the Atlas of Economic Complexity predicts that the Mexican economy will grow very rapidly during the rest of this decade and beyond. Let’s hope that this prediction becomes a reality.

Footnote 1:

For comparison: Indonesia ranked 21st at 3.3%, Pakistan 27th at 3.1%, Guatemala 35th at 3.0%, South Africa 41st at 2.9%, Turkey 43rd at 2.8%, Brazil 48th at 2.7%, Argentina 54th at 2.6%, Russia 59th at 2.6%, USA 91st at 2.0%, Canada 104th at 1.7% and Nigeria 118th at 1.1%.

Source:

Ricardo Hausmann, Cesar Hidalgo, et. al. “The Atlas of Economic Complexity“, The Observatory of Economic Complexity (Harvard HKS/CDI – MIT Media Lab). Retrieved 19 May 2012.

How does Mexico’s electoral process compare to other countries?

 Other  Comments Off on How does Mexico’s electoral process compare to other countries?
May 232012
 

On 1 July 2012 Mexicans go to the polls to elect a new six year president, a new senate and chamber of deputies. At the same time, voters in some states–Jalisco, Nuevo León, Guanajuato, Querétaro, Sonora, San Luis Potosí, Morelos, Federal District, Campeche and Colima– will cast their ballots in elections for state and local officials.

How free and fair are Mexican elections compared to those in other countries?

Before addressing this question, it is useful to acknowledge that elections in Mexico have improved dramatically in the past two decades, largely as a result of progressive reforms including the establishment of a strong and independent National Elections Commission (Instituto Federal Electoral, IFE). Prior to the late 1990’s one party, PRI (Partido Revolucionario Insititucional, Institutional Revolutionary Party) dominated most elections at the national, state and local level. Starting in 2000, when an opposition party, PAN (PAN or Partido Acción Nacional, National Action Party), won the presidency, elections in Mexico have been quite competitive. In 2006 a third party, PRD (Partido de la Revolución Democrática, Party of the Democratic Revolution), lost the presidency to PAN by less than 0.6% (35.89% to 35.31%). Since 1994 the winner of the presidency has not garnered 50% of the votes, leading some to argue that Mexico should conduct runoffs between the two highest vote-getters.

CountryScoreCountryScoreCountryScore
Uruguay10.00Peru9.17Turkey7.92
Canada9.58MEXICO8.75Indonesia6.92
Chile9.58Argentina8.75Venezuela5.67
India9.58Israel8.75Nigeria5.67
Brazil9.58South Africa8.75Russia3.92
USA9.17Guatemala7.92China0.00
Colombia9.17

The Economist Intelligence Unit (EIU) annually develops a “democracy index” which includes a factor titled “electoral process and pluralism”. Scores on this factor are based on 12 questions concerning the conduct of free, fair and transparent elections open to all groups and all voters as well as the orderly transfer of power to those winning elections. Based on the EIU scores for 2011, countries with the perfect score of ten were Uruguay, Norway, Iceland, Denmark, Finland, Luxembourg, Australia and New Zealand. Mexico is tied with Argentina, Israel and South Africa, trails Chile, Brazil, Colombia and Peru but is much closer to the top than the bottom (see table). Mexico is a point and a quarter below a perfect ten and almost a point ahead of Guatemala, three ahead of Venezuela and almost five ahead of Russia. China is last with a score of zero along with Saudi Arabia, Ethiopia, North Korea, and other authoritarian regimes.

It will be interesting to see how the EIU scores Mexico after the 2012 elections.

 Related posts:


How does democracy in Mexico compare to other countries?

 Other  Comments Off on How does democracy in Mexico compare to other countries?
May 192012
 

This is a very important year for Mexico’s democracy. On 1 July 2012 Mexicans will go to the polls to elect a new president, who will hold office for six years, a new Senate and new Chamber of Deputies as well as numerous state and local officials. How does Mexico’s democracy compare with that of other countries?

“Democracy” is a slippery concept; it is not at all easy to define and is very difficult to measure. In the abstract “democracy” is a form of government in which ultimate power is vested in the people or their freely elected representatives. In common usage, democracy implies active civil participation in free and fair elections, effective and efficient governance, basic human and minority rights as well as freedom of religion, expression and organization. Obviously these concepts are not easily measured.

The most widely used measures for international comparisons are provided by Freedom House which relies on experts to rate countries on “Political Rights” and “Civil Liberties” (Freedom in the World 2012). Assessing “political rights” is based on free and fair elections, effective political pluralism and participation as well as government properly functioning in the interest of the electorate. Measuring “civil liberties” investigates freedom of speech, press, assembly and religion, a fair and just legal system, personal autonomy and individual rights, as well as active participation of nongovernmental and labor organizations. The Freedom House process results in measures from one (the highest) to seven (the lowest).

The Economist Intelligence Unit (EIU) has also developed a “Democracy Index” based on experts’ ratings and public opinion surveys on five components – electoral process and pluralism, civil liberties, the functioning of government, political participation and political culture. The EIU process gives each county a score from a high of ten to a low of one  on overall democracy as well as the five components.

CountryFreedom House
Political Rights
1 - 7
Freedom House
Civil Liberties
1 - 7
Economist Index
Democracy Index
10 - 1
Canada119.08
USA118.11
Chile117.54
South Africa227.79
Brazil227.12
Argentina226.84
India237.30
Indonesia236.53
MEXICO336.93
Colombia346.63
Guatemala345.88
Venezuela555.08
Russia653.92
China763.14

Mexican democracy is somewhere in the middle when compared to other countries. The table compares democracy in Mexico with that in selected other countries based on the measures used by Freedom House and the EIU. Mexico was designated as a “flawed democracy” [see note 1] by the EIU in 2011, along with 52 other countries including France, Chile, Brazil, Argentina, Indonesia and Ghana. Mexico’s score of 6.93 out of ten ranked it 50th of 167 countries, one ahead of Argentina and a few places behind Brazil. It has made some relative progress since 2008 when it ranked 55th of 167.

In 2012 Freedom House placed Mexico in the highest level of the “partly free” category. In 2010 Mexico was at the bottom of the “free” category; it dropped out of this category because its “political rights” score went 2 to 3, with 1 being the highest. Mexico had maintained a score of 2 from 2000 to 2010, but went to 3 in 2011. Apparently the experts must have noticed deterioration in the electoral process, political pluralism and participation or the functioning of government. The downgrading was probably related in some way to Mexico’s Drug Wars.

In 2010 Freedom House placed Mexico among 35 “Countries at the Crossroads” that are on the way to becoming consolidated democracies, but still have several challenges to overcome. Among these are the legacy of authoritarian rule, a culture which tolerates corruption and impunity, the persistence of private and public monopolies, lack of political accountability and transparency, and perhaps most importantly the growing influence and violence of drug cartels. These all skew the political playing field and undercut democratic progress, the political morale of the electorate, and openness of the media. On the positive side, active participation in recent elections has led to peaceful transitions of power. Civil society is gaining strength. New institutions such as the Federal Electoral Institute and the Federal Institute for Access to Information are making a difference. Significant improvements to the overall political situation will require concentrated efforts over an extended period of time.

It is interesting that according to Freedom House democracy in Mexico has deteriorated since 2008, while the Economist (EIU) perceived an improvement. This difference indicates how difficult and subjective assessments of democracy can be. For example in the table below “partly free” Mexico scores higher on the EIU’s democracy index than either Argentina and Indonesia which are classified as “free” by Freedom House.

Given the very important election being held in Mexico this year, a future post will investigate how Mexico’s electoral processes compare with those in other countries.

Note:

[1] “Flawed democracies”:  “These countries … have free and fair elections and even if there are problems (such as infringements on media freedom), basic civil liberties will be respected. However, there are significant weaknesses in other aspects of democracy, including problems in governance, an underdeveloped political culture and low levels of political participation.” Economist Intelligence Unit, “Democracy index 2011: Democracy under stress”, p 31. Democracy Index 2011.

 Related posts:


How serious is corruption in Mexico?

 Other  Comments Off on How serious is corruption in Mexico?
May 122012
 

Recent allegations of bribery related to Wal-Mart de México beg two questions:

  • How serious is corruption in Mexico?
  • How does corruption in Mexico compare to that of other countries?

Fortunately for us, these questions have been comprehensively investigated by Transparency International (TI), a global civil society organization dedicated to reducing corruption. TI defines corruption as “abuse of entrusted power for private gain”.

Its recent study, “Corruption Perceptions Index 2011” focuses on “perceptions” because corruption is a hidden activity that is difficult to measure. The Corruption Perceptions Index (CPI) draws on a wide array of surveys and polls of international experts, business opinion surveys and country residents. It is based on 17 data sources from 13 different institutions. The focus is on bribery, kickbacks and embezzlement involving politicians, public officials and civil servants. Anti-corruption efforts are also considered.

Given the difficulties associated with measuring and interpreting corruption, the CPI has received considerable criticism. (For example, see this Wikipedia entry on  Corruption Perceptions Index). Despite this criticism, the CPI provides a viable approach to comparing corruption in various countries.

According to this index, perceived corruption in Mexico has become considerably worse in the past few years. In terms of freedom from corruption, Mexico’s 2011 score of 3.0 ranks it below the middle, in rank #100 out of 182 countries, tied with 11 other countries including Argentina and Indonesia. It is interesting to note that some individual Asian, African, European and Latin American countries are considerably ahead of Mexico (see table), but others are considerably behind.

CountryRankCountryRankCountryRank
New Zealand1South Africa64Argentina100=
Canada10Italy69=Indonesia100=
UK16Ghana69=Egypt112
Chile22Brazil73Guatemala120
USA24China75Nigeria143=
South Korea43Colombia80Russia143=
Saudi Arabia57India95Venezuela172
Turkey61MEXICO100=Somalia182

Within Latin America, Mexico is far better than Venezuela, Haiti and Paraguay. However, it is way behind Chile, Uruguay, Costa Rica and Brazil. As a regional leader, Mexico should do much better in terms of corruption.

Back in 2008, Mexico’s score of 3.6 placed it significantly above the middle. It was then ahead of Brazil, India, China, Saudi Arabia and Turkey; now it trails these five countries. Why Mexico’s score has dropped significantly since 2008 is not exactly clear, but is probably related to the escalation of the drug wars.

Mexico has signed several multilateral anti-corruption agreements, and recently passed a stiff anti-corruption law. However, legal instruments alone will not reduce corruption in Mexico, according to Emilio Godoy in his article Tangled Web of Corruption Debilitates Mexico (IPS, 10 May 2012). What is needed is aggressive government action as well as dramatic cultural changes among public and private sector officials. This will not be easy, given the existing long-established systems based on patronage, nepotism, cronyism and organized crime.

If Mexico is going to continue attracting foreign investment and experience economic and social growth in the years ahead, it will have to do much better with respect to its level of corruption.

May 102012
 

Linked to Mother’s Day [10 May in Mexico], Save the Children just published their 13th annual report on the“State of the World’s Mothers”.

The report investigates childhood malnutrition and relates it to the well-being of mothers. The focus is on the first 1,000 days from the time of conception to the child’s second birthday. Proper nutrition and health care during these 1,000 days are critically important to brain development and the welfare of the child throughout its lifetime.

Mother and child in a Mexican market

Mother and child in a Mexican market. Photo: Tony Burton.

For decades, development experts have recognized that health, education and economic opportunity of mothers are crucially important to the quality of life of their children. Mothers’ level of education is often the most important factor.

The impacts last for numerous generations. Not only do the children of more educated mothers do better, but their grandchildren and great grandchildren also do better. On the other hand, malnourishment during the first 1,000 days is linked to low education and economic opportunity for the child. It can result in daughters getting pregnant earlier and having less healthy children. This vicious circle can continue for generations.

How does Mexico stack up with other major countries around the world? The results for Mexico are a bit mixed. From 1990 to 2010 Mexico recorded an impressive decrease in malnutrition of 3.1% per year. (The measure of malnutrition used in this comparison was children too short for their age, “stunting”). Mexico has cut malnutrition almost in half (47%) since 1990. This decrease ranks it 11th among the 165 countries analyzed. Much of this progress is associated with Mexico’s Oportunidades Program. The ten countries that did better than Mexico include China (6.3%), Brazil (5.5%), and Vietnam (4.3%). Fifteen countries suffered increases in malnutrition during the 20 year period, including Somalia (6.3%/year), Afghanistan (1.6%/year) and Yemen (1.0%/year).

On the other hand, the study points out that, given its level of Gross Domestic Product (GDP) per capita, Mexico’s level of malnutrition is higher than it should be. Other under-performers include the USA, Singapore, India, Indonesia, Guatemala, Peru, South Africa and Venezuela. These countries tend to have very inequitable distributions of income. Surprisingly, Brazil, with one of the worst levels of income inequality, was among the group of countries with lower malnutrition than expected given their GDP per capita. Other over-performers include Chile, Ukraine, China and Vietnam. Obviously, in all countries malnutrition is much worse among the poor.

The study divides the 165 countries into the three Tiers used by the United Nations. The Tiers are labeled I-“more developed”, II – “less developed” and III – “least developed”. Tier I is limited to Japan and European countries. Mexico is one of 80 countries in Tier II (“less developed” countries).

The UN has a “Women’s Health Index” for Tier II, comprised of lifetime risk of maternal death, percent of women using modern contraception, percent of births attended skilled attendant, and female life expectancy at birth. Within this group, Mexico ranks 19th in “Mother’s (Health) Index” compared to Cuba (ranked 1st), Argentina (4th), Brazil (12th), China (14th), South Africa (33rd), Turkey (47th), Iran (50th), Philippines (52nd), Indonesia (59th), Saudi Arabia (63rd), Egypt (65th), Guatemala (68th), India (76th), Pakistan 78th) and Nigeria (80th).

The differences between ranks appear to overstate the real differences. For example, the scores on the individual variables for Mexico (19th) and Argentina (4th) are relatively close. The chance of maternal birth-related death is one in 500 for Mexico versus 600 in Argentina. In Mexico 95% of births are attended by a trained worker compared to 98% in Argentina. Two thirds (67%) of Mexican women use modern contraception methods compared to 64% in Argentina. Life expectancy for women is 80 years in both countries.

The UN “Children’s Health Index” for Tier II is comprised of under age five mortality rate, percent of children under 5 moderately or severely underweight for age, gross primary enrollment ratio, gross secondary enrollment ratio and percent of population with access to safe drinking water.

Mexico ranks 18th among Tier II countries in terms of “Children’s (Health) Index” compared to Cyprus (1st), South Korea (2nd), Brazil (7th), Argentina (8th), Turkey (10th), Egypt (21st), Iran (26th), China (34th), South Africa (56th), Guatemala (63rd), Philippines (64th), Indonesia (70th), Pakistan (76th), India (77th) and Nigeria (82th). Here again, the differences between ranks appear to overstate the real differences.

While Mexico has made impressive progress concerning mother’s and baby’s health, it still lags behind Argentina and Brazil not to mention virtually all European countries. The biggest concern is rural areas of Mexico, especially southern Mexico, which seriously trail urban Mexico in terms women’s and child’s health. For example, infant mortality rates are highest in Chiapas, Oaxaca and Guerrero, followed by Veracruz, Hidalgo and Puebla. On the bright side, rural areas are making great progress thanks to programs like Oportunidades.

Happy Mother’s Day!


The growth and expansion of Wal-Mart in Mexico

 Mexico's geography in the Press, Updates to Geo-Mexico  Comments Off on The growth and expansion of Wal-Mart in Mexico
May 052012
 

Much recent attention in the USA and Mexico has focused on the allegations of bribery related to Wal-Mart de México.  Interestingly, the company has a rather long history in Mexico. It started in 1958 when Jerónimo Arango and his brothers Placido and Manual started a company called Cifra and opened a deep discount store in Mexico City named Aurrera Bolivar. It was inspired by the E.J. Korvette discount store in New York City. The store was an immediate success, helped by sponsorship of the popular TV show, La Pregunta de los $64,000 pesos (“The $64,000 Pesos Question”).

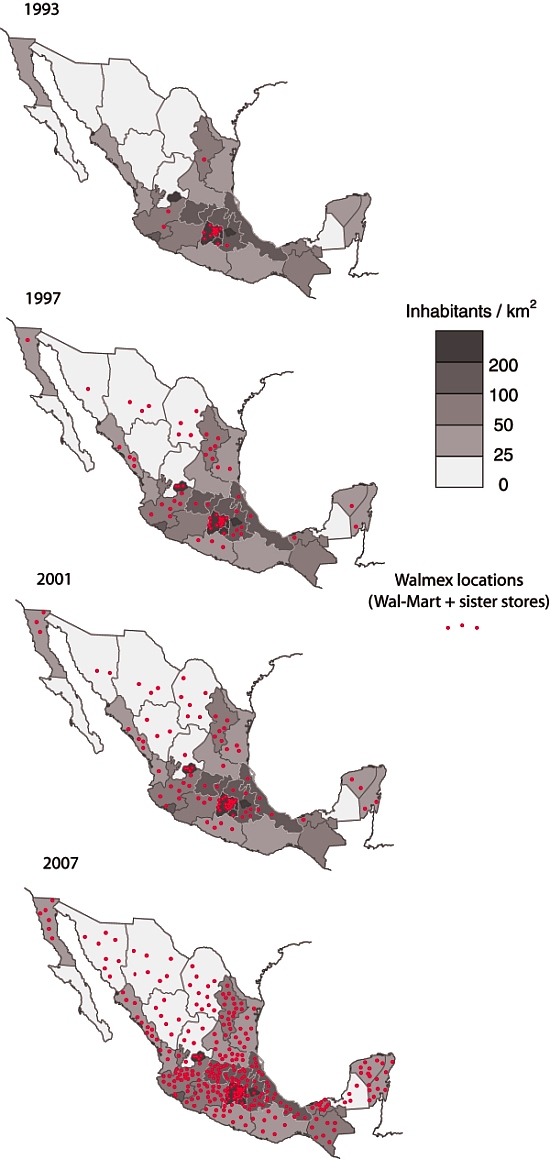
Wal-Mart's expansion across Mexico, 1993-2007

Wal-Mart's expansion across Mexico, 1993-2007. Click map to enlarge

By 1965 Cifra had eight Aurrera stores in the Mexico City area as well as a Superama grocery store and VIPS restaurant. Cifra and Jewel-Osco of Chicago formed a joint venture and by 1970 they opened the first Bodega Aurrera discount warehouse stores and Suburbia department stores. Their first hypermarket, Gran Bazar, followed in 1976. Shares in the company were sold to the public in 1977.   By serving low-income customers, the company managed to survive the financial crisis of 1982.  In fact during the 1980s it increased sales by an average 20% per year reaching US$550 million by 1989.

Rapid growth continued in the 1990s. By 1992 there were 38 Almacenes Aurrera supermarkets, 29 Bodega Aurreras, 34 Superamas, 29 Suburbias (department stores), 59 VIPS, as well as 15 El Portón restaurants. Almost all of these were located in the densely populated Mexico City and surrounding State of Mexico. Phenomenal growth continued in 1992 with 23 new units added. Cifra B shares increased forty-fold in just five years from the start of 1988 through the end of 1992. At that time, Cifra had a sophisticated, state-of-the-art data system for inventory control and monitoring customer preferences.

In 1991 Cifra formed a joint venture with the US firm Wal-Mart (founded in 1962, four years after Cifra). Unlike Cifra, whose early growth was based on an enormous urban area, Wal-Mart USA’s incredible early growth concentrated on rural areas. Initially the joint venture focused on trade and the members’ only Club Aurrera, which was soon renamed Sam’s Club. The first map shows the distribution of Wal-Mart stores in 1993. Expansion of new outlets throughout Mexico was only slightly slowed by the 1994 financial crisis.

By 1995, there were 22 Sam’s Clubs, and 11 Wal-Marts, 35 Almacenes Aurrera, 58 Bodegas Aurrera, 36 Superamas, 33 Suburbias, as well as 114 VIPS restaurants. One of the new Wal-Mart Supercenters was the largest in the world. The signing of NAFTA in 1994 strengthened the joint venture. In 1997 Wal-Mart USA acquired majority interest in Cifra creating Wal-Mart de Mexico or Walmex. The company, which previously had been heavily concentrated in Metro Mexico City, was soon aggressively opening new units in cities throughout the country (see maps).

Recent news reports allege that this aggressive growth may have been facilitated by payments of bribes to expedite construction permits. As of March 2012, Walmex was operating no fewer than 2,106 retail units throughout Mexico. They include 127 Sam’s Clubs, 213 Walmart Supercenters, 94 Suburbias, 385 Bodega Aurreras, 88 Superamas, 358 VIPS and El Portón restaurants, and over 840 Bodega Aurrera Expresses and other small outlets.

Wal-Mart de México is the country’s largest retailer, with sales of over US$24 billion, and largest private-sector employer, with 209,000 employees. These figures make Walmex the dominant player in its sector, well ahead of its Mexican supermarket rivals: Soriana ($8 billion); Comercial Mexicana (Mega, $4.5 billion) and Chedraui ($4.4 billion).

The 2007 map shows how Wal-Mart has now expanded into some areas where the population density is relatively low. The early expansion of Wal-Mart was into areas with high population density, where a single, well-placed store could easily be accessed by a lot of people, and therefore have the potential to be highly profitable. Even with the 2007 distribution, however, there is still a marked north-south divide in access to Wal-Mart, which reflects income disparities in Mexico.

In 2009/10 Walmex acquired Walmart Centroamérica and is now named Wal-Mart de México y Centroamérica, adding 622 retail outlets in Guatemala, El Salvador, Honduras, Nicaragua and Costa Rica, to bring the total number of units it operates (including Mexico) to 2, 728 retail outlets (with sales of about $29 billion) compared to Wal-Mart USA’s 4,468 outlets (with 2011 sales of $447 billion).

Source for maps:  

The maps have been redrawn, based on maps in “Supplier Responses to Wal-Mart’s Invasion of Mexico”  by Leonardo Iacovone, Beata Smarzynska Javorcik, Wolfgang Keller, James R. Tybout. Working Paper 17204  of the National Bureau of Economic Research, Cambridge, MA, USA.

Related posts


Mexico City has largely escaped drug violence

 Other  Comments Off on Mexico City has largely escaped drug violence
Mar 082012
 

Previous posts have analyzed drug war death rates in Mexican states, cities over 500,000, the most violent municipalities and areas of particular interest to expatriates. This post focuses on Mexico City or D.F. (Distrito Federal). We focus on D.F. because the rate of drug war deaths is exceptionally low there, less than one eighth the national average.

In all of 2010 there were 191 drug war deaths in D.F. [note 1] compared to 122 in the first nine months of 2011. [note 2] While this might sound like a large number of deaths, we must remember that there are almost nine million people in D.F.  The 2011 drug war death rate per 100,000/yr in D.F. was 1.8 compared to a national rate 15.3 and a rate of 134 in Acapulco. [note 3] The rate for D.F. declined 15% from the 2010 rate while the rates for all of Mexico and Acapulco increased by 13% and 187% respectively. Today, people seeking better security are moving into D.F. from other cities in the country.

Why are the rates in D.F. so low? In previous decades D.F. was thought to be one of the most violent places in the country, but this is no longer the case. The total murder rate for D.F. is half the national rate [note 4] and less than a third that of Washington, DC. [note 5] A major reason is that D.F. has a more competent, better organized, better paid and less corrupt police force than any of the other cities. The fact that the national government is in D.F. also helps as do more effective youth programs. That D.F. has higher overall income levels is also a factor. Some even speculate that major cartel bosses have family in D.F. and have an unspoken agreement to avoid violence in the capital [note 6].

The drug war death rates are quite low in all parts of the city. The wealthy delegation of Cuajimalpa in western D.F. had zero deaths in 2011 compared to 11 a year earlier. In 2010 it had the city’s highest rate of 5.9, but this was still less than half the national average. Relatively sparsely populated Milpa Alta in the southeast also had zero deaths in 2011. Cuauhtemoc and Venustiano Carranza, two central delegations, had the highest rates in 2011, but they both less than a third the national average.

The 13 suburban municipalities adjacent to D.F. in the State of Mexico experienced 331 drug war deaths in 2011, almost three times the number in D.F. These suburbs with a total population of just over six million had a combined drug war death rate of 7.3, four times as high as D.F. While the death rate in these municipalities increased 42% over the 2010 level, it was still less than half the national average. Based on the data presented above, it is not surprising that people worried about drug violence would rather live in or near D.F. than in most other cities, especially those in northern and western Mexico.

Notes:
  1. “Mexican drugs war murders data mapped”, The Guardian, posted by Johanna Tuckman, Jan 14, 2011. http://www.guardian.co.uk/news/datablog/2011/jan/14/mexico-drug-war-murders-map. For data see: http://www.google.com/fusiontables/DataSource?dsrcid=393962.
  2. “Van mas de 47 mil muertos por nacroviolencia: PGR”, El Universal, 12 January 2012, http://www.eluniversal.com.mx/notas/822078.html.
  3. The rates for 2011 were adjusted because data are available for only the first nine months of the year.
  4. “Is Mexico City safe from drug cartel war – or the next target,” CNN, January 17, 2012, .http://www.cnn.com/2012/01/17/world/americas/mexico-city-security/index.html
  5. “Mexico’s violence not as widespread as seems,” USAToday, 3 August 2010. http://www.usatoday.com/news/world/2010-08-03-Mexico-drug-violence_N.htm.
  6. Is Mexico City safe from drug cartel war — or the next target,” CNN, January 17, 2012, .http://www.cnn.com/2012/01/17/world/americas/mexico-city-security/index.html.

Drug war death trends in areas of Mexico of interest to foreign tourists and retirees

 Other  Comments Off on Drug war death trends in areas of Mexico of interest to foreign tourists and retirees
Mar 022012
 

Non-Mexicans are far more interested in some parts of Mexico than others. These areas of interest may be well-known tourist destinations, have thousands of expatriate residents or are located on major expatriate travel routes. Mexico’s major cities, which are also of interest to foreigners, were discussed in a previous post. This post focuses on 24 municipalities of less than 500,000 population. (These are listed alphabetically in the table linked to at the end of the post.)

Drug war death rates vary enormously among the 24 communities. Data released by the Office of the President [note 1] indicate that some of these municipalities have extremely high drug war death rates. The number of deaths in Zihuatanejo went from 16 in 2010 [note 2] to a startling 90 in the first nine months of 2011. This results in a rate of 115 deaths per 100,000 population/yr or over seven times the national average of 15.3 [note 3]. This places Zihuatanejo among the 20 most dangerous communities in Mexico (see earlier post) along with the other famous Guerrero beach resort of Acapulco.

Other dangerous municipalities listed in the table are Tepic, Nayarit at 69 (4.5 times the average); Mazatlán at 58 (3.8 times the average) and Nuevo Laredo at 50 (3.3 times the average). Thousands of expatriates live in Mazatlán while thousands drive through Tepic and Nuevo Laredo. The temporal trends in these dangerous cities vary widely. Between 2010 and 2011, the rate for Zihuatanejo went up 650% while Nuevo Laredo’s increased by 67% and Tepic edged up 14%. The rate for Mazatlán was down 20%.

The most worrisome trend is the very rapid drug violence increase in Veracruz State. From 2010 to 2011 the death rate for Xalapa went up 1,066%. In 2010 there were a total of 15 drug war deaths in Xalapa, Boca del Río and Veracruz City combined; but in the first nine months of 2011 this went up to 284. It remains to be seen if this dreadful trend will continue into 2012 and beyond.

Other cities in the table with rates significantly above the national average include Nogales with a rate of 28, down 68% from 2009. The rate for Playas de Rosarito (Baja California) was up 41% to 28, nearly double the average of 15.3. Matamoros’ rate increased 13% to 20 while Cuernavaca’s was down 49% to 19.

The death rates in towns near Lake Chapala varied markedly. The rate for Ixtlahuacán de los Membrillos dropped from 34 in 2010 to 16 in 2010, but was still above the national average and twice the rate of neighboring Chapala. The rate for nearby Jocotepec of 13 was between the other two. Though local media suggest a growing drug violence problem in these three communities, the actual number of deaths dropped from 24 in 2010 to 12 in 2011. The death rate for the three communities dropped from 34% above average in 2010 to 33% below average in 2011.

The great news is that three of communities in the table—Bahia de Banderas, Guanajuato and San Miguel de Allende—had zero drug war deaths in the first nine months of 2011, compared to 27 in 2010. Bahia de Banderas, in Nayarit just north of Puerto Vallarta, is of particular interest because it had 19 deaths in 2010. If this precipitous drop is not a statistical anomaly it represents a major anomaly because the number of deaths in the adjoining community of Puerto Vallarta almost doubled from 15 in 2010 to 28 in 2011; furthermore there were 196 deaths in nearby Tepic.

Several tourist areas had drug war death rates less than a sixth the national average. These include Ensenada, La Paz and Los Cabos on the Baja Peninsula as well as Oaxaca City. Not far behind was Playa del Carmen with a rate about one quarter of the average. These data suggest that tourists worried about drug violence and seeking a beach resort vacation might lean toward Baja California Sur or the Maya Riviera instead of Acapulco, Zihuatanejo or Mazatlán.

Notes:

[1] “Van mas de 47 mil muertos por nacroviolencia: PGR”, El Universal, 12 January 2012, http://www.eluniversal.com.mx/notas/822078.html.

[2] “Mexican drugs war murders data mapped”, Theguradian, posted by Johanna Tuckman, Jan 14, 2011. http://www.guardian.co.uk/news/datablog/2011/jan/14/mexico-drug-war-murders-map. For data see: http://www.google.com/fusiontables/DataSource?dsrcid=393962.

[3] The rates for 2011 were adjusted because data are available for only the first nine months of the year.

Which Mexican communities have the highest drug war death rates?

 Other  Comments Off on Which Mexican communities have the highest drug war death rates?
Feb 232012
 

In a previous post we noted that big Mexican cities with populations of over 500,000 have drug war death rates about 40% higher than the rest of Mexico. However the highest rates of all are in small northern municipalities which have experienced very high levels of drug violence.

Mier, Tamaulipas was the most dangerous municipality in 2011 as it was in 2010. Though the number of drug war deaths in the town of 4,768 (2010) decreased from 93 in 2010 [note 1] to 50 in the first nine months of 2011 [note 2], it still led the country with 1,398 drug war deaths per 100,000/yr [note 3]. This is 91 times the rate for all of Mexico which was 15.3 in 2011 and also over ten times as dangerous as Acapulco, the large city with the highest rate of drug violence. Actually the death rate per population for Mier is probably higher because the mayor estimates that a third of the population may have fled the violence-prone town [note 4]. Mier is only about eight kilometers (five miles) from the Texas border and roughly midway between Nuevo Laredo and Reynosa. The municipality may be a bit more peaceful now that the Mexican military has occupied the town.

Guerrero, Mier’s immediate neighbor to the northwest with a population of 4,468, ranked second with a death rate of 1,045 or roughly 68 times the average. Both Guerrero and Mier are located between two warring drug cartels, the Zetas and the Gulf Cartel. Mier’s other neighbor along the Rio Grande, Miguel Alemán, fared somewhat better. Its death rate dropped from 407 in 2010 to 114 in 2011; but its 2011 rate was still over seven times the national average. The data reveal that municipalities along the border between Nuevo Laredo and Reynosa are among the most dangerous in all of Mexico. Interestingly, the rate for Reynosa itself was only 11 or about 27% below the average.

In third place is San Fernando, also in Tamaulipas, with a death rate of 680, about 44 times the average. This community of 57,220 suffered 292 deaths in 2011. Over half of these deaths were discovered in mass graves of Central Americans who were trying to immigrate to the US, but were kidnapped and murdered by drug cartels.

Next on the list are three small municipalities in Chihuahua – Guadalupe (rate of 496), Gran Morelos (373) and Cusihuiriachi (369). The 2011 death rates in these towns were 24 to 32 times the national average. While the rate for Guadalupe declined 42% since 2010, the rates for Gran Morelos and Cusihuiriachi were up 50% and 150% respectively. As mentioned in an earlier post, the State of Chihuahua had the highest 2011 drug war death rate among Mexico’s 32 states.

Drug war death totals in small communities can change dramatically from year to year. For example, Saric, Sonora with a population of 2,703 had 30 deaths in 2010 and zero in 2011. General Bravo, Nuevo Leon had 18 deaths in 2010 and zero in 2011 while Yecora, Sonora had 18 deaths in 2010 and only one in 2011. The number in General Treviño, Nuevo León went from 21 down to only two, but it still had the 8th highest rate among Mexico’s municipalities.

On the other hand, drug war deaths in Boca del Rio, Veracruz went from 2 in 2010 to an alarming 94 in 2011. This resulted in a rate increase of 6,167% and a rate six times the average. The rate for Zihuatanejo de Azueta, Guerrero increased by 650%; that of Yurécuaro, Michoacán went up by 452% while that for Cosalá, Sinaloa was up 317%, giving it a rate 13 times the average.

Zihuatanejo de Azueta is different than many of the other communities with very high drug war death rates because it has a rather large population of 104,609 and includes the famous international resort of Ixtapa. The number of drug war deaths in the municipality went from 16 in 2010 to a very disturbing 90 in 2011, giving it a death rate of 115, almost as high as Acapulco’s rate of 134. Certainly, the high drug war death rates in Zihuatanejo and Acapulco have damaged their tourism industries.

Twenty municipalities had drug war death rate in 2011 higher than 100 per 100,000/yr or about seven times the national average (see table). Two of these are the large municipalities of Ciudad Juárez and Acapulco. The 20 communities are spread across six northern and western states: six in Chihuahua, five in Tamaulipas, three in Guerrero, two in Sinaloa and Michoacán, and one each in Sonora and Nuevo León. Before randomly traveling in areas of these states, it would be a good idea to check local media and bulletin boards for indications of recent drug violence.

Notes:

[1] “Mexican drugs war murders data mapped”, The Guardian, posted by Johanna Tuckman, Jan 14, 2011. http://www.guardian.co.uk/news/datablog/2011/jan/14/mexico-drug-war-murders-map. For data see: http://www.google.com/fusiontables/DataSource?dsrcid=393962.

[2] “Van mas de 47 mil muertos por nacroviolencia: PGR”, El Universal, 12 January 2012, http://www.eluniversal.com.mx/notas/822078.html.

[3] The rates for 2011 were adjusted because data are available for only the first nine months of the year.

[4] Christopher Sherman (AP), “Drug War: Despite army takeover, fear grips Mexican town”, Press-Telegram, Long Beach, CA, Dec 7, 2011. http://www.presstelegram.com/breakingnews/ci_19488405

Drug war deaths in Mexico’s biggest cities

 Other  Comments Off on Drug war deaths in Mexico’s biggest cities
Feb 182012
 

Drug war deaths occur in communities of all sizes, but they are a bit more likely in the biggest cities. However, there are gigantic geographic variations. For example, Acapulco, with a population of about 790,000, had 795 drug war deaths in 2011 (Jan–Sept) [note 1] while there were zero drug war deaths in Mérida, with 828,000 residents. Clearly drug cartel battles are very geographically concentrated.

Compared to the rest of the country, Mexico’s 37 largest municipalities with populations of over 500,000 experience about 40% more drug war deaths per 100,000 population than the rest of the country. These big cities account for about 36.5% of Mexico’s population and 44% of the drug war deaths in both 2010 and 2011.

In 2010, Ciudad Juárez was the drug war hotspot with 2,736 deaths for a rate of 206 per 100,000/yr compared to the national rate of 13.6 [note 2]. This dropped by a surprising 41% in 2011 to a rate of 121 [note 3]; but  Ciudad Juárez still led the nation’s death toll with 1,206 deaths. Acapulco’s 795 deaths gave it the highest rate among big cities of 134, up a frightening 186% over 2010. Other dangerous big cities with high drug war death rates include Torreón with a rate 99 (up 100%), Durango with 89 (up 244%), Chihuahua with 65 (down 20%) and Culiacán with 57 (down 17%).

Tijuana used to be a major center of drug violence, but not anymore. Between December 2006 and December 2009, it experienced 1,195 drug war deaths, behind only Ciudad Juárez with 3,699 and Culiacán with 1,303. Its death rate for that period was over four times the national average. But the number of deaths dropped from 472 in 2010 to 183 in 2011 bringing the rate down to 15.6, just above the national average of 15.3. In nearby Mexicali, the rate was only 4.1 in 2011, about a quarter of the average. The state of Baja California is no longer a key battleground in the Mexican drug war.

Drug violence deteriorated most rapidly in Veracruz City which went from 9 deaths in 2010 to 155 in 2011 resulting in a rate increase of almost 2,200%. This increased the rate to 37, nearly two and a half times the national average. Smaller cities in Veracruz State also experienced rapid increases. For example, Jalapa went up 1,066% and Bocas del Rio was up 6,167%. For the state as a whole, the rate was up over 300%. Clearly, the drug war has reached Veracruz.

Drug war violence has also increased rapidly in Monterrey where the number of deaths increased from 179 in 2010 to 399 in 2011, more than doubling its death rate. Deaths in Monterrey’s two large suburbs of Guadalupe and Apodaca also went from 91 to 220. While the rate in Monterrey was just above the national average in 2010, in 2011 it was up to 47, three times the average. Deaths in nearby Saltillo also went up rapidly, from 15 to 50, pushing its rate up by 344%.

Guadalajara also experienced an upsurge in drug violence. While its death rate went up 61% to 7.3 in 2011, this is still less than half the national average. However, the 2011 data do not include the 26 bodies dumped in the city in November 2011. Death rates were also up nearly 50% in Guadalajara’s two big suburbs of Zapopan and Tlaquepaque.

Surprisingly the Mexico City Federal District has been relatively free of drug violence. Total drug war deaths dropped from 191 to 122 pushing its 2011 rate down to only 1.8 deaths per 100,000/yr. This is only about one eighth the national rate. A future post will provide a more detailed analysis of drug violence in Mexico City.

In addition to Mérida, Tuxtla Gutierrez in Chiapas also had zero deaths in 2011. Other big cities with very low drug war death rates include Puebla (0.6), Querétaro (0.8), León (1.9), Toluca (2.1) and Villahermosa (2.5). Apparently drug cartels and their enemies have not been very active in these cities.

Notes:

[1] All the references for 2011 are for January through September based on the data released by Mexican Government

[2] “Mexican drugs war murders data mapped”, The Guardian, posted by Johanna Tuckman, Jan 14, 2011. http://www.guardian.co.uk/news/datablog/2011/jan/14/mexico-drug-war-murders-map. For data see: http://www.google.com/fusiontables/DataSource?dsrcid=393962.

[3] The rates for 2011 were adjusted because data are available for only the first nine months of the year.

Recent geographic trends in Mexico’s drug violence

 Other  Comments Off on Recent geographic trends in Mexico’s drug violence
Feb 112012
 

Drug related violent deaths during the first nine months of 2011 increased by about 13% compared to 2010.  Data released by the Office of the President  in January 2012 indicate that from January through September 2011 Mexico had a total of 12,903 drug war deaths. This is a rate of about 15.3 per 100,000 people per year [2011 rates were adjusted because data are available for only the first nine months of the year] compared to 13.6 in 2010 and 7.55 in 2009 [“Mexican drugs war murders data mapped”]. While the rate of increase declined significantly in the past two years, still drug violence is increasing rapidly.

The geographic pattern of drug violence is still mainly concentrated in northern border states and some western states. Chihuahua was still the most violent state with 2,289 deaths in 2011 (Jan-Sept) for a rate of 90 deaths per 100,000 per year.  Other states with high rates were Guerrero (61), Durango (58), Sinaloa (53), Tamaulipas (45), Nayarit (42), Nuevo León (33), and Coahuila (28). Note that four of these states are along the border and four are in western Mexico.

At the other end, Yucatán had only one death for a rate of 0.07. Other states with low rates were Tlaxcala, 0.8; Puebla, 1.22; Querétaro, 1.24; Campeche, 1.62; Chiapas, 1.73; Hidalgo, 1.75; and the Federal District (Mexico City), 1.83. It is very interesting that the drug war death rate in the capital city was one of the lowest in the country and less than one eighth the national. A future post will investigate drug war death rates in Mexico City.

Among border states, drug war death rates decreased significantly for the western states. Baja California was down 38%; Sonora down 36%, and Chihuahua down 31%. Before 2010, Baja California and Sonora had death rates over twice the national average largely because of high death totals in Tijuana and Nogales. However for 2011 the rates for Baja California and Sonora were 31% and 22% below the national average. The worst drug violence in these two northwestern states might be a thing of the past.

The eastern border states all suffered increases. Coahuila was up 99% and Nuevo Leon was up 143%. Both now have death rates over twice the national average. Tamaulipas’ already high rate of 37 in 2010 increased 22% to 45, almost three times the average. Clearly the battleground of drug cartel clashes along the border has shifting to the east.

Violence is up in some western states where it already was quite high. The rate in Guerrero increased 80% to 60 deaths per 100,000 people, four times the national average. Nayarit suffered an increase of 21% to a rate 42, almost three times the average. Smaller, but still significant, increases were registered in Colima, up 24%, and Michoacán, up 40% putting these two states above the average. On the other hand, the some of the violent non-border states experienced declines. The rate in Sinaloa declined 19%; but with a 2011 rate of 53 it is still three and half times the average. Morelos was down 18% putting it just above the average.

Drug violence increased very rapidly in some non-border states that were relatively peaceful through 2010. The drug war death rate in Zacatecas increased 361% while that in Veracruz was up 302%. While these increases are alarming, these two states still had rates below the national average in 2011. Jalisco suffered an increase of 40%, but its 2011 death rate of 11 was still less than three-fourths of the average. The State of México was up 24%, but its rate was still less than a third the average.

In conclusion, drug violence in Mexico continued to increase in 2011. The violence appears to be mostly concentrated in a wide geographic arc formed by the border states and those in western Mexico. Within this region some areas are suffering rapid increases while drug violence is declining in other places.  It is not clear how this pattern will change in the years ahead. To get a clearer picture of the current pattern, in future posts we will investigate trends in drug violence among Mexico’s 2,458 municipalities.

Rapid Improvements in housing, especially for Mexico’s poorest

 Updates to Geo-Mexico  Comments Off on Rapid Improvements in housing, especially for Mexico’s poorest
Dec 152011
 

The 2010 census provides many indicators of minimal housing quality such as sanitary drainage (indoor drains and toilets), electricity, piped water, overcrowding, and dirt floors. A previous post discussed the rapid expansion of household electricity, especially in remote areas. This post focuses on the other measures of housing quality, and considers three different scales: national, state and municipality.

The national situation

All measures of minimal housing quality improved significantly between 2000 and 2010. The proportion of Mexicans living in houses without sanitary drainage went from 9.9% in 2000 all the way down to 3.6% in 2010, a decline of almost two-thirds. Those without piped water went from 11.2% to 8.6%. It is interesting that many Mexicans that have indoor toilets do not have piped water. The reason for this is that sanitary drainage needs only pipes and gravity while piped water requires pressure-holding plumbing, and pumps driven by either electric or diesel power. Those without piped water must carry water into the house either by bucket or take delivery from a pipa (water truck).

The availability of both sanitary drainage and piped water are extremely important to health, particularly infant health. When a household has piped water, it uses far more water for bathing and mopping, as well as for cleaning food, utensils, clothing etc. This results in far less contamination and disease.

The number of Mexicans living in houses with dirt floors declined by over half, dropping from 14.8% down to 6.6%. Dirt floors are also associated with greater contamination and disease. Overcrowding, defined as more than two persons a room, is still an issue in virtually all areas of Mexico. The proportion living in homes with more than two persons a room went from 45.9% in 2000 to 36.5% in 2010. This is a significant improvement, but more than a third of Mexicans still live in overcrowded housing.

Comparisons between states

Chiapas and Oaxaca made spectacular progress in providing sanitary drainage. The proportion without sanitary drainage was cut by about three quarters. In Chiapas it went from 19.3% down to 5.1%. In Oaxaca, it dropped from 18.1% to only 4.0%. Other states with very impressive improvements include Zacatecas (19.7% to 6.7%), Hidalgo (17.2% to 6.0%), Puebla (11.9% to 3.1%), Michoacán (11.4% to 3.8%) and Veracruz (10.2% to 2.6%). The state with the highest proportion without sanitary drainage is Guerrero with 19.6% (down from 35.2% in 2000). The second highest is Yucatán at 12.6% (down from 24.0%). The lowest rates are in the Federal District (0.1%), followed by Nuevo León and Baja California (each with 0.4%).

Mexican housingProgress in providing piped water was far less impressive. The situation is worst in Guerrero where the proportion without piped water actually increased from 29.5% to 29.8%. The situation also deteriorated in Morelos (7.3% to 8.2%), Baja California Sur (6.3% to 7.1%), Quintana Roo (5.3% to 6.2%) and the Federal District (1.5% to 1.8%). These states experienced the expansion of low quality informal housing without piped water.

Progress in reducing the proportion living with dirt floors was considerably better, especially in the poorest states: Oaxaca, from 41.6% 2000 down to 19.3% in 2010; Chiapas, 40.9% to 15.7%; Guerrero, 40.0% to 19.6%; Veracruz, 29.3% to 12.4%; Puebla, 24.1% to 9.9%; San Luis Potosi, 23.7% to 9.1%; and Michoacán, 19.9% to 11.0%.

Like the other housing measures, overcrowding (more than two persons a room) is worse in the poorer states. The proportion is highest in Chiapas at 53.9% (down from 65.0% in 2000). Other states with high levels are Guerrero (50.2%), Oaxaca (46.5%), Campeche (46.0%) and Puebla (44.6%). All Mexican states reduced overcrowding by about 25%. Even in wealthy states, overcrowding is significant with the Federal District registering 26.1%, Baja California 29.1% and Nuevo León 29.8%.

The situation in Mexico’s poorest municipalities

Housing is particularly bad in Mexico’s 100 poorest municipalities, which tend to be rural communities occupied by indigenous groups. On average, 21% of the 1.5 million residents of these municipalities do not have sanitary drainage, 47% lack piped water, 64% live in overcrowded housing, 33% have dirt floors and 19% lack electricity.

On a positive note, many of these municipalities have made outstanding progress since 2000. For example, several communities reduced the proportion without sanitary drainage from over 40% to less than 5%. Others increased the percentage with piped water from less than 30% to over 60%. The proportion with dirt floors in several municipalities went from over 60% to less than 20%.

Some of these poor communities now score quite high on some housing variables. For example, in 20 of the 100 municipalities, 98% have sanitary drainage; however in 10 of these 20, over half the people lack piped water. On the other hand, in five of the poorest 100 municipalities, over 90% of the people have piped water. In nine of the 100, less than 15% live with dirt floors. These data reveal that poor housing in Mexico is characterized by a variety of different deficiencies. However, one conclusion is clear: overcrowding remains a problem in all the poorest 100 municipalities. In only seven of the 100 is overcrowding less than 60%; it is over 80% in 78 of Mexico’s 100 poorest communities.

Source of data:

CONAPO, “Índice de marginación por entidad federativa y municipio, 2010” México D.F., October 2011.

Related posts:


The rapid expansion of electricity provision in Mexico

 Other  Comments Off on The rapid expansion of electricity provision in Mexico
Dec 092011
 

In the past two decades, Mexico has made very impressive progress in providing electricity to its citizens, especially those living in rural areas. The 87.5% of Mexicans that had electricity in 1990 lived mostly in cities and towns. Many of the 95.0% that had electricity in 2000 lived in rural areas. The proportion without electricity was cut way down to only 1.8% by 2010.

During the past decade, virtually all those who obtained electricity for the first time lived in rural areas. The gains in some states were very impressive. The proportion without electricity in Oaxaca went from 13% in 2000 to 5% in 2010. In San Luis Potosí and Chiapas it fell from 12% to only 4%. In Veracruz it dropped from 11% to just 3% and in Tabasco it went from 5.8% to only 1.2%.

Postage stamp commemorating the nationalization of Mexico's electricity industry

The states with the highest proportion without electricity in 2010 were Oaxaca (4.93%), Guerrero (4.38%) and Durango (4.19%). At the other end, were the Federal District (0.08%), Nuevo León (0.30%), Coahuila (0.54%) and Colima (0.59%).

Mexico may never be able to provide electricity to 100% of its citizens, since there are too many people living in very remote areas. In about 8% of municipalities (199 of 2456), more than 10% of the people lack electricity. Of these 199 municipalities, 81 are in Oaxaca, which has 570 municipalities, far more than any other state. Many of the other poorly serviced municipalities are in the relatively poor southern states of Guerrero (15), Veracruz (12), Chiapas (9), Puebla (7) and Michoacán (7).

A surprisingly number of these 199 municipalities are in two northern states: Chihuahua with 16 and Durango with 9. In fact, in 14 Chihuahua municipalities, over 25% of the population lack electricity and in 5 of these over 50% do not have electricity. In Durango the situation is only slightly better: in four municipalities over 25% lack electricity and in one of these 66% do not have electricity. These are among the worst-serviced communities in all of Mexico. In the whole country there are only 9 municipalities where over half the residents do not have electricity and 6 of these 9 are in Chihuahua or Durango. These very poorly-serviced areas are sparsely populated municipalities near the Copper Canyon, occupied mostly by the Tarahumara indigenous group.

Though there are sizable pockets of Mexicans that do have electricity, it is very impressive that, as of 2010, over 98% had access to power.

Source for data:

 CONAPO,Índice de marginación por entidad federativa y municipio. 2010” México D.F., October 2011.

 Related posts:

The important but often overlooked state of Puebla

 Other  Comments Off on The important but often overlooked state of Puebla
Dec 022011
 

The interesting and important state of Puebla is often overlooked because it is overshadowed by nearby Mexico City. In fact the western state border of Puebla is within 35 kilometers of the eastern edge of the Federal District. The state of Puebla also may be overlooked because it is rather small in area, ranking only 21st among Mexico’s 32 states. On the other hand, its 2010 population of nearly 5.8 million ranks it 5th behind only Mexico State, the Mexico City Federal District, Veracruz and Jalisco.

Though small in size, Puebla is very diverse. The topography is rugged and elevations range from under 100 meters in the northeast to volcanoes  rising over 5,000 meters above sea level, both to the east (Orizaba – 5,636m) and west (Popocatepetl – 5,410m and Iztaccihuatl – 5,230m). These extremes in elevation give Puebla a very wide range of climates and ecosystems, from semi-tropical rainforests and grasslands to highland forests and alpine ice packs.

Almost inevitably, given its high population density (168.5 inhabitants/square kilometer), many of these ecosystems have been degraded. Several of the most attractive natural areas are now protected. They include the Izta-Popo Zoquiapán, La Malinche and Pico de Orizaba National Parks as well as the very large Tehuacán-Cuicatlán Biosphere Reserve, which has over 100 different mammal species, 16 of which exist nowhere else on the planet.

Puebla also has significant social and ethnic diversity. There are numerous wealthy people and upscale areas in Puebla City, which has the eighth highest 2005 Human Development Index (HDI) score among major Mexican cities, behind only Mexico City, Chihuahua City, Monterrey, Querétaro City, Cancún, Torreón and Cuernavaca. Most people are surprised it comes out ahead of Guadalajara and Zapopan.

On the other hand, the state as a whole is rather poor. Based on its relatively poor levels of infant mortality, literacy, school enrollment, and income levels, the state ranks 28th of 32 states in terms of 2008 Human Development Index. Puebla is tied with Michoacán and ahead of only Chiapas, Guerrero and Oaxaca[1]. It also ranks 28th in illiteracy which is over 10% (2010); however 96% of the 6 to 11-year-olds now attend school, and illiteracy for those between the ages of 15 and 25 is less than 3%. While 98% of homes now have electricity, over half of Puebla’s workers make less than $115 pesos ($8.20US) a day. Approximately two/thirds of the state’s population live below the Mexican poverty line. The state’s high level of poverty is partially due to its indigenous population of almost one million and the fact that almost 30% of its inhabitants live in rural areas, some of them quite remote.

The city of Puebla is the heart of a Metropolitan Area which extends across state lines to the city of Tlaxcala. Metropolitan Puebla-Tlaxcala is the country’s 4th largest urban area with a population over 3.1 million, but is overshadowed by Mexico City, the eastern edge of which is less than 30 minutes by expressway. In fact, some urban specialists suggest that these two major metropolitan areas may merge in the future. On the other hand, the mighty Popocatepetl and Iztaccihuatl volcanoes, both over 5,000 meters in height, lie directly between the two cities. The high speed expressway skirts around the north side of the volcanoes.

The city of Puebla has long had strategic significance. The city was initially established during the colonial period owing to its strategic location between Mexico City and Veracruz, the dominant port for shipments to and from Spain. Puebla was the country’s second largest city for more than three centuries up until the mid 19th century. The Mexico City-Puebla railway was completed in 1869, but the main line to Veracruz bypassed the city, which diminished its comparative advantage, and resulted in it dropping to fourth place, overtaken by Guadalajara and Monterrey.

The state’s historical importance is evidenced by numerous important military confrontations, including the massacre of Cholula (1519), Santa Ana’s siege of Puebla City (1845), American General Winfield Scott’s occupation (1845-48), the “Cinco de Mayo” battle of Puebla against the French (1862), the French victory in the Second Battle of Puebla (1863), and occupation by the Zapatistas during the Mexican Revolution. The state is the birthplace of four Mexican Presidents: Ignacio Comonfort (1855–1858), Juan N. Méndez (1876–1877), Manuel Ávila Camacho (1940–1946) and Gustavo Díaz Ordaz (1964–1970).

Despite the state’s relative poverty, industrial development has been significant and Puebla has become one of Mexico’s most industrialized states. Since colonial times Puebla has been an important center for the textile and ceramic industries. Much of Mexico’s famous talavera pottery is made in Puebla. Talavera came to Puebla from Talavera, Spain, which in turn had acquired it from Arab traders who originally brought it from China.

Since the mid 20th century Puebla has become a very important modern industrial area. The most important manufacturing activities are metals, chemicals, electronics, textiles and particularly motor vehicles. The Volkswagen plant in Puebla is one of the largest outside Germany. In July 2003 it produced the very last of the over 21 million old “Beetles” built by VW. The plant now produces New Beetles, Jettas and Boras that are exported worldwide. The motor vehicle assembly industry is supported by scores of automobile parts factories in the state.

Related articles:

The rapid expansion of literacy and education in Mexico

 Updates to Geo-Mexico  Comments Off on The rapid expansion of literacy and education in Mexico
Nov 282011
 

Data from Mexico’s 2010 census indicate that considerable progress has been made in the recent past. Literacy of those over age 15 has increased from 87.6% in 1990 to 90.5% in 2000 and 93.1% in 2010. This is to be expected since literacy varies with age. As the older people, many of whom are illiterate, die off, they are replaced by younger, more literate, Mexicans. For example, in 2010, 34% of those over age 75 were illiterate, compared to under 2% for those aged 15 to 29.

Literacy is highest in the Federal District (97.9%) and lowest in Chiapas (82.2%), Guerrero (83.3%) and Oaxaca (83.7%). In future decades, illiteracy will continue to decline significantly, especially in the poorer southern states. However, with life expectancy increasing and older people living longer, illiteracy will not decline as fast as it might.

Preschool, primary schools (primaria) and junior high schools (secundaria)

educationAbout half of Mexican children aged 3 to 5 attended preschool in 2010. Basic education begins with primary schools (primaria) with grades 1 to 6 for children generally between the ages of 6 and about 12. Junior high schools (secundaria) cover grades 7 to 9 and focus on 12 to 15-year-olds. In Mexico primaria and secundaria are compulsory; however, in the past, many children dropped out for a wide variety of reasons (the need to work and support the family being a major one). Mexico’s telescundaria system brings junior high school lessons to students in remote areas via satellite.

In 2010, an impressive 95% of those aged from 6 to 14 attended school, compared to 91% in 2000 and 86% in 1990. The majority of the 5% not attending school in 2010 did attend school previously and had acquired basic literacy. The rather poor state of Hidalgo had the highest attendance rate in 2010 with 96.4% (tied with Tlaxcala and the Federal District). The lowest levels were in Chiapas (90.8%), Michoacán (92.4%) and Guerrero (93.1%).

The rather small difference between the highest and lowest rates suggests that most Mexicans throughout the country have relatively equal access to basic education. Even in the poorest 125 of Mexico’s 2442 municipalities 88% of 6 to 14-year-olds were in school, according to the 2010 census.

High or senior high schools (preparatoria)

Senior high school education (prepatratoria) offers grades 10 to 12 and is not compulsory. Students generally are aged between 15 and 18. Some of these schools focus on preparing students for university while others focus on vocational training. In some rural areas, students must travel considerable distances to the nearest senior high school, and some have to live away from home during term time.

Teaching hours and the quality of education

Unfortunately, school attendance is not a reliable indicator of the number of teaching hours. Students receive only 2.8 hours of real instruction per day according to a new study by Mexicanos Primero, a citizens’ group focused on improving the quality of education. The study indicates that Mexican students get 562 hours of instruction per year, compared to 710 hours in the USA, 875 in France, 1172 in Finland and 1195 in South Korea. Mexicanos Primero complains that too much real instruction time is lost due to preparation for parades and festivals, teacher absenteeism and school closures.

There are also issues concerning the quality of education. According a recent Organisation of Economic Cooperation and Development (OECD) Mexico is doing a poor job of educating its youth. Only 1% of Mexican 15-year-olds have the knowledge and skills needed for full participation in modern society, compared to 30% in Hong Kong and 26% in South Korea.

Higher education has made impressive gains. In 2010 over 40% of those aged 15 to 24 were attending school compared to 33% in 2000 and 30% in 1990.

temporary classroom

Temporary classroom while a new school is being built. (Jungapeo, Michoacán, mid-1980s). Photo: Tony Burton.

Years of schooling

The “average years of schooling” figure has increased about one year a decade, from 6.5 years in 1990 to 7.5 in 2000 and 8.6 in 2010. The Federal District is the most educated with an average of 10.5 years of schooling, compared to 6.7 in Chiapas and 6.9 in Oaxaca. Given historical trends, older adults have significantly fewer years of education than younger adults.

There are still some serious urban-rural differences. The best educated municipality is Benito Juárez in the Federal District with 13.9 years, compared to levels between 2.3 and 3.4 years for the ten lowest municipalities, which are all in the rural south and are predominately indigenous language speakers. In these poor indigenous rural municipalities, most of the elderly have virtually no schooling even if the majority of children are now attending school and learning Spanish.

Source:

Veracruz: one of Mexico’s most diverse states

 Other  Comments Off on Veracruz: one of Mexico’s most diverse states
Oct 242011
 

Veracruz, one of Mexico’s most important and interesting states, is a narrow strip of land stretching for 650 kilometers (over 400 miles) along the Gulf of Mexico. The topography ranges from a narrow coastal plain to very high mountains on its western border including Mt. Orizaba, Mexico’s highest peak at 5,610 meters (18,406 ft.).

The relief helps to funnel migrating birds into a narrow band across the state:

Veracruz which is one of the rainiest states has three of Mexico’s five largest rivers: the Panuco in the north and the Papaloapan and Coatzacoalcos rivers in the south. Its varied climate and ecosystems mean enormous biodiversity, including species of insects, birds and plants that exist nowhere else on earth. These species are protected in 31 protected areas including three national parks. Previous posts describe the fabulously beautiful Las Tuxtlas Biosphere Reserve and the mysterious Laguna Encantada.

With over 7.6 million residents, Veracruz trails only the State of Mexico and the Federal District in population. While the state is over one-third rural, it has several major metropolitan areas. The state capital is Xalapa (809,000). Other major cities include the industrial twin cities of Coatzacoalcos (234,000) and Minatitlán (356,000) in the extreme south, and the port city of Veracruz (703,000) in the center. The north of the state is served by the port city of Tampico (803,000) on the north bank of the Panuco River in the neighboring state of Tamaulipas.

One of the most interesting towns is Yanga, which was established around 1570 by escaped slaves lead by Gaspar Yanga. The town, the first African-ruled settlement in the New World, successfully resisted efforts by the colonial government to recapture it and its residents. Today, Gaspar Yanga is considered a national hero. It is interesting to note that Negroid features are apparent on the ancient 3,500 year old Olmec carved stone heads found in southern Veracruz. The state is home to numerous indigenous groups including the Nahuas, Huastecos, Otomis, Totonacs.

Map of Veracruz state, Mexico; all rights reserved.

Map of Veracruz state, Mexico; all rights reserved. Click to enlarge.

There are two UNESCO-designated World Heritage sites in Veracruz: the Pre-Hispanic city of El Tajin and the Historic Monuments of the Zone of Tlacotalpan.

Veracruz is one of Mexico’s poorer states. Mostly as a result of its very large rural, agricultural and indigenous populations, Veracruz ranks in the bottom third in most socioeconomic indicators such as production/person, percent living below the poverty level, human development index, literacy, infant mortality, life expectancy and marginalization. On the other hand, these indicators for the major cities are above the national averages.

Veracruz is second in total agricultural production behind only Jalisco. It produces more than half of the country’s sugar cane and oranges and also leads in mangoes and other citrus fruits. It is also a major producer of coffee, beef, pork, dairy, chicken, corn, beans, bananas, tobacco, coconuts, vegetables and vanilla.

Petroleum is extremely important. Most of the oil production is in northern Veracruz while the southern cities of Coatzacoalcos and Minatitlán are noted for their chemical and petrochemical industries.

Veracruz is also famous historically and culturally. Cortés and his men landed in Veracruz on their way to conquering and subduing all of Mexico. Veracruz city was the most important port for many centuries when it served as Mexico’s main link to the rest of the world. The state capital was eventually moved to Xalapa, which has a flourishing cultural life and an anthropology museum second only to the National Anthropology Museum in Mexico City. The annual Carnival staged in Veracruz is one of the most spectacular in all of Mexico. The Danza de los Voladores (Dance of the Flyers) in Papantla is a major tourist attraction for Mexicans and foreigners alike. Veracruz also has its own distinctive music and cuisine, enhancing its regional identity.

Driving in Mexico: is it safe relative to other countries?

 Books and resources  Comments Off on Driving in Mexico: is it safe relative to other countries?
Jul 282011
 

About 24,000 people were killed last year in traffic accidents in Mexico according to Ángel Martínez, Director of the Mexican Traffic Safety Research Center (Spanish acronym CESVI) . In the USA, the number was about 33,000 in 2010. Does this mean that is safer to drive in Mexico than the USA?

The simple answer is “no” because the USA has three times as many people, about ten times as many registered vehicles, and probably drives over ten times as many vehicle-miles as Mexico. Comparing traffic deaths among countries is relatively complicated because the data are often lacking or not comparable.

A large 2009 World Health Organization (WHO) study indicates that traffic deaths are related to numerous factors. Obviously, the number, age, condition and mix of motor vehicles are very important. Two-wheeled motor vehicles can be more dangerous than automobiles, buses or trucks. Furthermore, road quality, traffic infrastructure, laws, and enforcement are major factors. Many countries do not require use of seat belts, helmets or child seats. The training, skill level and behavior of drivers, as well as pedestrians, are also important. Other factors are alcohol use by drivers and pedestrians, as well as the quality and efficiency of emergency medical teams and health care systems.

50-vehicle pile-up in fog, Saltillo, January 2011

50-vehicle pile-up in fog, Saltillo, January 2011

According to the WHO study, Mexico ranked 12th in the world in total traffic fatalities. China ranked first with 221,000 deaths per year, followed by India, Nigeria, Pakistan, Indonesia, Russia, Brazil, USA, Egypt, Ethiopia, Iran and then Mexico. Total deaths are related to population, number of vehicles and pedestrians, poor traffic control and emergency medical systems, as well as crowded roads shared by everything from trucks, buses, cars and motor bikes to livestock and pedestrians.

Mexico has about 21 traffic deaths per year per 100,000 population. This is a fairer way to compare countries. On this statistic, Mexico does slightly worse than Brazil (18), China (17), India (17), Indonesia (16), and Thailand (20). Though Mexico is slightly better than Peru (22), Venezuela (22), Russia (25), and Pakistan (25), considerable improvement is needed. President Calderón has set as a goal of reducing traffic deaths by 50% by 2020. Mexico is significantly behind some of the other Western Hemisphere countries such as Canada (9), USA (11), Argentina (14), Colombia (17) and even Guatemala (15).

The major countries with the safest traffic are Japan (5), UK (5), Germany (6), and France (8). The least safe countries are mostly in Africa and include Egypt (42), Ethiopia (35), Kenya (34), Nigeria (32), the Congo (32) and South Africa (33).

Wear your seat belt and drive safely!

Jul 182011
 

With so much media attention focused on drug violence in Mexico, many potential tourists and tour operators are canceling planned trips to Mexico. Are such decisions rational? The analysis below indicates that travel to Mexico is considerably safer than risking vehicle traffic in the USA.

The US State Department has issued numerous travel advisories concerning visits to Mexico. As we discussed in a previous post —Which parts of Mexico are currently subject to US travel advisories?— the advisories focus on specific areas of Mexico. Unfortunately, many potential tourists overlook the geographic specificity and get the impression that all parts of Mexico are dangerous. Previous posts clearly indicate that levels of drug war violence vary enormously from place to place in Mexico.

This post investigates the chances of being a fatal victim of drug violence in various places in Mexico and compares these with the chances of being a fatal victim of a traffic accident in the USA. The US Department of Commerce estimates that about 19 million US citizens visit Mexico each year. According to MSNBC, in 2010 at least 106 Americans were killed in Mexico as a result of drug violence. Dividing the 19 million visits by the 106 deaths suggests that the chance of a visitor being killed on a trip to Mexico in 2010 was about 1 in 179,000. These are good odds, much better than the annual chance of being killed in a US traffic accident which is about 9,000 to 1. In other words, the chances of dying in a US traffic accident are roughly 20 times greater than being killed as a consequence of drug violence while visiting  Mexico. (As an aside, the annual chances of being killed in a Mexican traffic accident are about 1 in 4,800.)

Chance of a visitor being killed in drug violence in MexicoRelative danger of death in a road accident in the USA
MEXICO (whole country)1 in 179,00020 times greater
Ciudad Juárez1 in 11,4001.3 times greater
State of Chihuahua1 in 18,5002.1 times greater
Culiacán1 in 25,0002.8 times greater
Mazatlán1 in 47,0005.2 times greater
Tijuana1 in 52,0005.7 times greater
Monterrey1 in 210,00023 times greater
Puerto Vallarta1 in 288,00032 times greater
Chapala1 in 299,00033 times greater
Cancún1 in 360,00040 times greater
State of Jalisco1 in 378,00042 times greater
Oaxaca City1 in 427,00048 times greater
Guadalajara1 in 569,00063 times greater
Mexico City1 in 750,00083 times greater
State of Yucatán1 in 4,151,000460 times greater
Puebla City1 in 6,572,000730 times greater

Some areas of Mexico experience much more drug violence than others. For example drug violence deaths in Ciudad Juárez are 16 times greater than the Mexico national average. Consequently, the chance of an American visitor getting killed in drug violence in Ciudad Juárez is about 11,400 to one, still safer than risking traffic in the USA. The table shows the risks for a range of Mexican locations and compares them to the risks of US traffic. In the city of Puebla the risk is one in 6.6 million compared to one in 750,000 for Mexico City, one in 570,000 for Guadalajara, one in 360,000 for Cancún, about one in 300,000 for Chapala and Puerto Vallarta, and about one in 50,000 for Tijuana and Mazatlán.

These results indicate that the chance of a visitor being killed by drug violence in Mexico is extremely unlikely, far less likely than the risk of being killed in a US traffic accident. For example, a visit to Chapala is 33 times safer than risking US traffic for a year, while Mexico City is 83 times safer. Though this analysis focuses on the travel of US tourists to Mexico, the results are equally relevant for visitors from other countries.

Jul 112011
 

Many Chicano activists refer to Mexicans as “La Raza”, literally “the race”. “Dia de la Raza” is celebrated on Columbus Day (October 12) as the day the Mexican indigenous population started their resistance against the European invasion.

Racial classification in colonial times

Racial classification in colonial times (Click to enlarge)

The term “La Raza” derives from a 1948 book “La Raza Cósmica.” The author Jose Vasconcelos’ thesis is that Mexicans (who he defines as a combination of indigenous and European bloodlines) are a new superior race. In developing his thesis, Vasconcelos draws upon many concepts including Marxism; he felt Europeans were too materialistic and capitalistic. He suggested that Mexicans have evolved (à la Darwin) into a new race that would be a world leader in the years ahead. The Government of Mexico tacitly agreed with this approach which engendered national pride. It was also consistent with the government’s post Mexican Revolution view that all ethnic groups should be combined into a common Mexican national identity.

According to the 2010 census, about 15% consider themselves indigenous, though about 58% of these do not speak any indigenous language. Assuming the “white” and “other” categories are still about 10% and 2% respectively, this suggests that today about 73% are mestizos. Almost all people in Mexico refer to themselves simply as “Mexicans”, not as indigenous Mexicans or mestizos or whites.

Vasconcelos’ “Raza Cósmica” and most Mexicans overlook the historical fact that Mexicans have an important African heritage. Between 100,000 to 200,000 African slaves were brought into Mexico during the 16th through 18th centuries, nearly a quarter the number brought to the USA. In 1646 there were 35,000 African slaves in Mexico, more than 2.5 times the white population [see Blacks outnumbered Spaniards in Mexico until after 1810]. These slaves represented about 12% of the total population, roughly equal to the percentage of slaves in the USA before 1860.

Mexico’s second president, Vicente Guerrero, whose mother was partially Black, abolished slavery in 1829. Thousands of Blacks moved into Mexico from the USA before it abolished slavery in 1865. However, today there are very very few black faces in Mexico. One can spend weeks in Mexico’s major cities without seeing a Black Mexican. If one pays close attention, they can identify people of African heritage in a few selected communities in Veracruz and along the Costa Chica in Guerrero and Oaxaca [Bobby Vaughn’s homepage: Afro-Mexicans of Costa Chica ].

What happened to all the Blacks in Mexico?  [Blacks in Mexico] In a word they assimilated by having offspring with other racial groups. In colonial times, the Catholic Church went to great lengths to categorize intermixed races for marital and baptism purposes:

The terminology for racial mixes

Complex terminology for racial mixes

Before too long, nobody could keep all the combinations straight! Eventually, everyone of mixed race was considered a mestizo. The African portion was purposely or accidentally dropped.

Modern research, based on DNA, indicates that Mexican mestizos are genetically about one-eighth African [mtDNA Affinities of the Peoples of North-Central Mexico]. While Brazil is often identified as the world’s foremost melting pot, the evidence suggests that in Mexico the races have melted more than in any other country.

While there are very few black faces in Mexico, there is a great deal of African heritage represented in art, music, dance, food, and even in fishing and agricultural practices. Did you know that the popular Mexican song “La Bamba” recorded by Richie Valens, Los Lobos and others can be traced back to the Bamba district of Angola? As part of the 500th anniversary of Columbus’ famous voyage, the Government of Mexico finally acknowledged officially that Africa was Mexico’s “Third Root”.

How did Mexico get to be the world’s 11th most populous country?

 Other  Comments Off on How did Mexico get to be the world’s 11th most populous country?
Jun 112011
 

Mexico is currently the world’s 11th most populous country. While it has not always held this position, Mexico has been among the world’s population leaders for the last two thousand years. Worldmapper.org provides data on the estimated population occupying the areas of current countries for various years starting in the year one, when India (62 million) and China (60 million) had more than half of world’s total population of 231 million. No other country had more than eight million. Mexico ranked 17th with an estimated two million inhabitants. According to available data eight countries have always been more populous than Mexico: China, India, Bangladesh, Russia, Pakistan, Japan and Indonesia.

The next data point is the year 1500, when Mexico ranked 13th with an estimated population of seven million. This estimate seems reasonable, though some feel that Mexico’s population might have been as large as 15 million which would have made Mexico the third most populous country on the planet behind only China and India. Between year 1 and 1500, Mexico surpassed Turkey, Spain, Egypt, Iran, and the Ukraine; but was passed by Germany.

Mexico’s total population plunged after the Spanish arrived bringing small pox, other diseases and major social disruption. By 1600, Mexico’s population was down to 2.5 million, but it was still the most populous country in the New World, according to data provided by gapminder.org. It ranked 22nd tied with Austria and behind such countries as Czechoslovakia, Poland, Sudan, and Yugoslavia.

In 1700 Mexico’s population was 4.5 million, ranking it 18th. By 1820 the USA had moved past Mexico’s population of 6.6 million to become the most populous country in the New World. Mexico maintained its 19th ranking until 1870 when Brazil surpassed Mexico’s population of 9.2 million to become the most populous country in Latin America. It is interesting that there were relatively few changes in the ranks of the top 20 countries during the 170 year period between 1700 and 1870, except for the USA which went from 40th to 4th.

Since 1870 Mexico’s population has surpassed that of nine different European countries. By 1900 Mexico had 11.7 million inhabitants moving it past Czechoslovakia and Turkey into the 18th spot. (Note that Gapminder population figures are higher than the Mexican census figures, perhaps because they attempted to correct for census under-counting; for the purposes of this analysis we use the Gapminder figures.) Mexico maintained its 18th rank until 1950 when its population of 28.5 million edged it past Spain and war torn Poland into 16th place. In 1970 its population reached 52.8 million putting Mexico in 14th place ahead of France and the Ukraine. By 1980 Mexico’s population of 68.3 million pushed it past Italy and Britain into 12th place. A decade later its population of 84.9 million moved Mexico past Germany into the 11th spot, where it has remained.

What will happen in future decades? Mexico’s position will change, but only slightly. In 2020, Mexico’s population may reach 125 million moving it past Japan into 10th place (Population forecasts for 2020 to 2050 are from the U.S. Bureau of Census). By 2030, Mexico, with a population of about 135 million, will have passed Russia, but fallen behind Ethiopia and the Philippines, putting it back in the 11th spot.

Mexico’s estimated population of 144 million in 2050 will place it 12th behind the Congo (World Population Prospects: the 2010 Revision). According to the United Nations, by 2100 Mexico’s population will decrease to 127 million moving it to the 20th spot, behind Tanzania, Uganda, Kenya, Iraq, Zambia, Niger, Malawi, and Sudan. Obviously, the accuracy of such a long term forecasts is very speculative. For example, given global climate change and possible food scarcities, some doubt if the sub-Saharan African countries can grow as rapidly during the last half of the 21st century as projected by the United Nations.

Marriage declining among Mexican couples

 Updates to Geo-Mexico  Comments Off on Marriage declining among Mexican couples
May 312011
 

Mexican couples still prefer marriage over the alternatives, but not as strongly as in the past. According to the 2010 census, 40.5% Mexicans age 12 and over were married, down from 44.5% in 2000 and 45.8% in 2009. The 11% decline since 1990 does not sound like much, but is significant when the data are investigated more deeply.

Because the data include all Mexicans over age 12, it is not surprising that 35.2% were single in 2010, compared to 37.2% in 2000 and 40.6% in 1990. The 13% drop since 1990 in the percentage for singles is mostly a result of the relative decline in the total number of teenagers, most of whom are unmarried, as a consequence of the decline in fertility over the past few decades.

The most impressive growth was for “free union” couples, those living together but not married. In terms of population, the proportion went from 7.4% in 1990 to 10.3% in 2000 and 14.4% in 2010, almost double the 1990 level. If we compare married couples with those in free union, we get an even clearer picture of the trend. In 1990, 13.9% of all couples lived in a “free union”; this figure increased to 18.8% in 2000 and 26.2% in 2010.

While roughly three of every four couples in Mexico are married, this varies significantly from state to state. It is not surprising that the least Catholic state—Chiapas— has the most couples living in “free union” – 38.8%. Chiapas also is one the most heavily indigenous states. But even in Chiapas, over six in ten couples are married. Other states with high rates of “free union” couples are Baja California (35.5%), Nayarit (34.5%), Baja California Sur (34.4%) and Quintana Roo (34.4%), a state with relatively few Catholics and a substantial indigenous population. The most Catholic state of all—Guanajuato—has the fewest “free union” couples, only 13.4%. Other states with relatively few unmarried couples are Yucatán (14.1%), Zacatecas (15.3%), Nuevo León (15.6%) and Aguascalientes (16.0%).

The census also includes three additional categories which all have increased rather rapidly since 1990. Those widowed went from 3.6% in 1990 to 4.3% in 2000 and 4.4% in 2010. This probably is a function of increasing life expectancy and people living longer on their own after their spouse dies, especially if the death resulted from an accident or violence. Separation, though still rather rare, is becoming more common, increasing from 1.2% in 1990 to 2.6% in 2000 and 3.7% in 2010. Divorce is also quite uncommon but increasing, from 0.7% in 1990 to 1.0% in 2000 and 1.5% in 2010.

Religious diversity is increasing in Mexico

 Updates to Geo-Mexico  Comments Off on Religious diversity is increasing in Mexico
May 282011
 

Mexico is still considered to be a Catholic country, but it is slowly becoming less Catholic. In the 2010 census 82.7% said they were Catholics compared to 88.0% in 2000 and 89.7% in 1990. In a recent report, Sociologist Roberto Blancarte, who specializes in research into religions, claims that for each day of the last decade, more than 1,000 Mexicans left the Catholic Church. He concludes that Catholicism is “destined to be abandoned” in Mexico.

Conversely, the percentage of the population who declared themselves non-Catholic went from 12.0% to 17.3% in 2010, almost a 50% increase.

The percentage of Protestants or Evangelicals increased to 9.7% in 2010 from 5.2% in 2000 and 4.9% in 1990. The proportion following “Other Religions” was 2.5% in 2010, 2.4% in 2000 and 1.5% in 1990. While the percentages in these latter two groups are rather low, Mexicans in non-Catholic religions tend to be far more religiously active than the majority of those who consider themselves Catholics. A total of 4.6% indicated that they had no religion in 2010, compared to 3.5% in 2000 and 3.2% in 1990.

Women tend to be more religious than men and more apt to have specified religions. About 5.5% of males indicated that they had “No Religion” compared to 3.9% for women. Women were a bit more likely to indicate they were Catholics (83.1% versus 82.3%) or Protestants or Evangelicals (10.2% versus 9.2%).

Western Mexico is still the most Catholic area of the country, though other religions are gaining converts. The state with the highest proportion of Catholics is Guanajuato with 93.8% followed closely by Zacatecas with 93.5%. Other states with over 90% Catholics are Querétaro, Jalisco, Michoacán, and Tlaxcala.

The least Catholic states are in Southern Mexico, led by Chiapas where only 57.8% are Catholic. Over 27% in Chiapas are Protestants or Evangelicals and 12% indicated that they had “No Religion.” Other states with under 65% Catholics include Campeche, Quintana Roo and Tabasco. The percentage Catholic in Oaxaca is just over 80% which seems surprisingly high given that Oaxaca is a southern state and has the largest proportion of indigenous-language speakers.

Related posts:

The geography of Mexico’s religions is discussed in chapter 11 of Geo-Mexico: the geography and dynamics of modern Mexico. Ask your library to purchase a copy today!