RR

The pattern of severe poverty within Mexico

 Updates to Geo-Mexico  Comments Off on The pattern of severe poverty within Mexico
Jul 142014
 

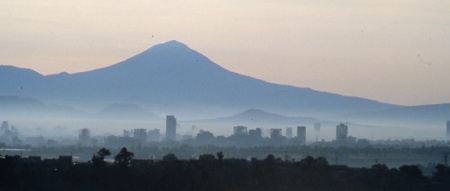
As presented in a previous post, 2.8% of Mexicans (3.3 million) live in severe poverty based on a June 2014 Multidimensional Poverty Index (MPI) developed by the Oxford (University) Poverty & Human Development Initiative (OPHI)[1]. The previous post explained the MPI measure of poverty and discussed how Mexico compared to the 108 countries in the study. This post looks into the details of MPI poverty within Mexico. Poverty in Mexico is mostly a rural problem. According to the study, roughly 8.5% of rural residents are severely poor (2.3 million) compared to only 1.1% of people in urban areas (1.0 million).

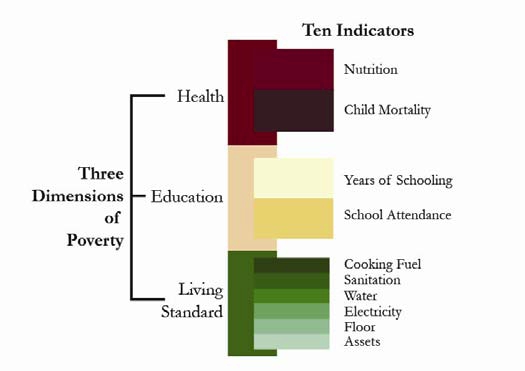
As indicated in the previous post, the MPI is based on ten separate indicators; two for education, two for health and six for standard of living. In all cases, people in urban areas scored better on all the indicators than those in rural areas. In rural areas several key MPI indicators contribute the most to poverty: insufficient schooling (19.3%), malnutrition (14.1%), children not attending school (12.9%), use of an unhealthy cooking fuel (12.9%) and unacceptable sanitation (11.7%) [2].

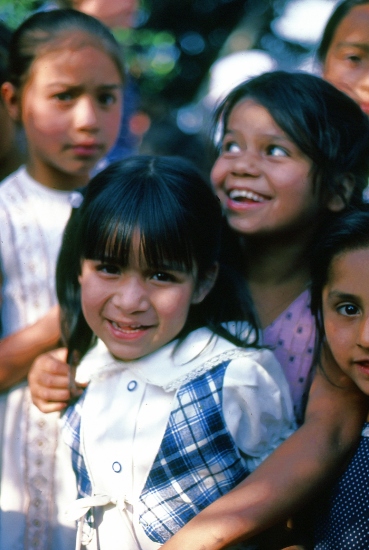
As expected the poorer more rural southern states had the highest MPI poverty levels. Oaxaca had the most living in poverty (11.1%) followed by Guerrero (10.6%) and Chiapas (8.3). Poverty was also high in San Luis Potosí (6.7%), Puebla (5.3%), Veracruz (4.6%), Campeche (4.2%), and Hidalgo (3.4%). These states all have significant indigenous populations. Though the study did not access severe poverty among indigenous groups, available information suggests that those groups suffer by far the highest levels of severe poverty. States with lowest MPI levels are Nuevo León (0.2%), Federal District (0.4%), Baja California (0.4%), Baja California Sur (0.4%), Durango (0.7%), Morelos (1.0%), Colima (1.0%), and Aguascalientes (1.0%); all states with relatively few indigenous inhabitants.

References:

[1] Oxford Poverty and Human Development Initiative (OPHI), “Global MPI Data Tables for 2014”, Oxford University, June 2014.

[2] Oxford Poverty and Human Development Initiative (OPHI), “OPHI Country Briefing 2014: Mexico,”

Related posts:


Multidimensional Poverty in Mexico: How severe is poverty in Mexico?

 Updates to Geo-Mexico  Comments Off on Multidimensional Poverty in Mexico: How severe is poverty in Mexico?
Jul 072014
 

How severe is poverty in Mexico? How does it compare to poverty in other countries? A new study released in June 2014 suggests that 2.8% of Mexicans live in severe poverty based on a Multidimensional Poverty Index (MPI) developed by the Oxford (University) Poverty & Human Development Initiative (OPHI) [1]. For all 108 countries in the study (representing roughly 78% of the world’s population), 32% live in severe poverty; thus the percentage for Mexico appears rather small in comparison to most places. This post is an update of previous Geo-Mexico posts on this topic:

The MPI in the study discussed here is based on a complicated methodology which relies on three different sets of household survey data. Its approach looks at poverty characteristics of household. This is superior to most other poverty measures that look at incomes in comparison to some type of poverty line, which varies widely from country to country. A household may have adequate income, but if that money is spent frivolously on alcohol, drugs, gambling, entertainment, etc., the children in the household might still be living in severe poverty.

Multi-dimensional Poverty Index

Multi-dimensional Poverty Index. (From Alkire & Santos, 2010)

The MPI uses ten indicators (see graphic) representing three equally weighted dimensions of poverty or deprivation within a household: Education, Health and Standard of Living [2]. Education looks at whether any member of the household has at least five years of schooling and if all school –aged children are attending school. Health focuses on whether a child in the family has died and if any adult or child in the household is malnourished. Standard of Living has six indicators for each household: electricity, safe drinking water, proper sanitation, adequate house flooring (not dirt, sand or dung), clean cooking fuel (not wood, charcoal or dung), and ownership of more than one of the following – radio, TV, telephone, bike, motorbike, refrigerator or ownership of a car or truck. Obviously these indicators reveal far more details about poverty than simple income measures. A complicated formula is used to combine these indicators to identify households in severe poverty. A more detailed description of the methodology is provided in this previous post.

As noted above, according to MPI, 2.8% of Mexicans or 3.3 million people are severely poor [3] compared to 32% or 1.6 billion in the 108 countries analyzed which include most of the countries of Latin American, Africa, Asia and Eastern Europe. Of the 108 countries, 29 have smaller percentages living in severe poverty than Mexico. These include Belarus (0.0%), Russia (1.3%), Ecuador (2.2%) and Brazil (2.7%). It is interesting that Ecuador and Brazil have lower MDI levels of poverty than Mexico because both have lower per capita incomes than Mexico and far more income inequality. For example, 0.7% of Mexicans live on under $1.25 a day and 4.5% live on under $2.00 a day, compared to 4.4% and 13.6% for Ecuador and 3.8% and 9.9% for Brazil. Apparently, in Ecuador and Brazil either survival necessities are cheaper or they spend their incomes more wisely or public safety nets are more effective. This suggests that Mexicans could do a better job of combating severe poverty.

Countries with slightly worse MPI levels than Mexico are Argentina (3.0%), the Czech Republic (3.1%), Hungary (4.6%), Dominican Republic (4.6%), Colombia (5.4%), Egypt (6.0%) and Turkey (6.6%). That the Czech Republic and Hungary are below Mexico is a bit of a surprise. Further down on the list are China (12.5%), South Africa (13.4%), Peru (19.9%), Indonesia (20.8%), and Guatemala (25.9%). The countries with the severest MPI levels include Pakistan (49.4%), India (53.7%), Nigeria (54.1%), the Democratic Republic of the Congo (73.2%), Ethiopia (88.6%), and lastly Niger (92.4%).

According to the study the country with the most people living in severe poverty is India (612 million) followed by China (162m), Bangladesh (83m), Nigeria (82m), Pakistan (81m), Ethiopia (66m), Indonesia (48m), the Democratic Republic of the Congo (44m). Compared to these countries, the 3.3 million in Mexico seems like a rather small number.

Though severe poverty in Mexico is far less than in most other countries, it is still a very serious problem which needs to be addressed. As might be expected, within Mexico severe poverty is worst in rural areas and southern states; we will look more closely at this in a subsequent post.

References:

[1] Oxford Poverty and Human Development Initiative (OPHI), “Global MPI Data Tables for 2014”, Oxford University, June 2014.

[2] Sabine Alkire and Maria Emma Santos, “Acute Multidimensional Poverty: A new Index for Developing Countries”, Oxford Poverty & Human Development Initiative (OPHI), July 2010, Paper No. 38, .

[3] According to the Mexican Government’s Poverty Line, 52% of Mexicans live in poverty. Obviously this is a very different poverty measure than the MPI.

Related posts:

Study finds indigenous Mexicans far more diverse than previously thought

 Other  Comments Off on Study finds indigenous Mexicans far more diverse than previously thought
Jun 262014
 

A recently released study [1] indicates that genetic diversity among indigenous Mexicans is far greater than previously thought. Ethnic Seri living in isolated parts of Sonora are as genetically different from isolated Lacandon living near the Guatemala border as Europeans are from Chinese. These differences must have existed for thousands of years before Europeans arrived in the New World. The differences are also reflected in mestizos living in geographically separated parts of Mexico.

Source: A. MORENO-ESTRADA ET AL., SCIENCE (2014)

Source: Moreno-Estrada et al. Science (2014)

The study in the June 13 issue of Science was conducted by researchers from the University of California, San Francisco and Stanford. They studied the genomic data from 511 native Mexicans from 20 of Mexico’s 65 indigenous groups scattered throughout Mexico (see map) from the Seri (SER) and Tarahumara (TAR) in the northwest, to the Purépecha (PUR) in the west, Trique (TRQ) and Zapotec (ZAP)in the south as well as three subgroups of Maya (MYA) on the Yucatán Peninsula [2]. They also analyzed similar data from 500 mestizos from ten Mexican states as well as some from Guadalajara and Los Angeles.

The findings have great implications for the study of diseases in these populations [3]. For example a lung capacity test can indicate a disease in one indigenous group while the same test results would be normal in a different indigenous group.

References:

[1] Moreno-Estrada et al. “The genetics of Mexico recapitulates Native American substructure and affects biomedical traits”, Science 13 June 2014; Vol 344 no.6189, p. 1301.

[2] Lizzie Wade. “People from Mexico show stunning amount of genetic diversity”, ScienceMag.org, June 12, 2014.

[3] Karen Weintaub,”Mexico’s Natives didn’t mix much, new study shows”, National Geographic, June 12, 2014.

Related posts:

Remittances to Mexico from USA decline slightly in 2013

 Updates to Geo-Mexico  Comments Off on Remittances to Mexico from USA decline slightly in 2013
Nov 232013
 

Using recent World Bank data, the Pew Research Center conducted an in-depth analysis of remittances sent from the USA to Latin American countries.

Remittances to Mexico peaked at over $30 billion in 2006, but as a result of the Great Recession, have declined by roughly 29% to an estimated $22 billion in 2013. (The analysis is based on constant 2013 US dollars).

Figure 1 of Pew Report

Figure 1 of Pew Report. Shaded area is period of recession.

On the other hand, remittances to all other Latin American countries reached almost $31 billion in 2008, declined slightly but were up to almost $32 billion in 2013 (see graph).

Note that the data are for remittances sent through formal channels such as banks and formal money transfer businesses. The average cost of sending these formal remittances is significant, an estimated 7.3% in late 2013. If all informal remittances were included, the remittances to Mexico would be an estimated 50% higher, or over $30 billion.

The study focuses particular attention on Mexico because it receives more than 40% of all remittances from the USA to Latin America. Mexico ranks 4th worldwide in total remittances, behind India ($71 billion), China ($60 billion) and the Philippines ($26 billion). These three other countries get remittances from many countries throughout the developed world while 98% of Mexico’s remittances come from the USA. The remaining 2% come mostly from Spain and Canada. No other country in Latin America receives more than 90% of their remittances from the USA. Spain is a bigger source of remittances than the USA for Argentina, Bolivia, Paraguay and Uruguay. This is a bit surprising given the horrible current economic situation in Spain. Many Spaniards are now migrating to Mexico in search of work.

The USA is by far the largest source of all worldwide remittances with $123 billion, followed by Saudi Arabia $28 billion and Canada $24 billion. However, on a per capita basis or percentage of GDP basis, Saudi Arabia, Canada and many other countries send significantly more in remittances than the USA.

The main reason why remittances to Mexico declined after 2006 is that the Great Recession very seriously hurt the construction industry, a main source of jobs for Mexican immigrants. Related to this, the overall loss of jobs in the USA meant that many immigrants returned to Mexico. In recent years it appears that more have returned to Mexico than have migrated to the USA. Thus the number of Mexican-born residents in the USA is declining very slightly for the first time since the Great Depression in the 1930s.

While remittances are extremely important to specific Mexican households, particularly rural households in western Mexico, remittances are not as important to the overall Mexican economy as they are to some other countries. Remittances account for about 2% of the overall Mexican GDP compared to 17% in El Salvador, 16% in Honduras and 10% in both Guatemala and Nicaragua.

The average amount of remittances sent by Mexican immigrants is rather low compared to immigrants from other countries. On average immigrants from Mexico over age 18 sent $2,115 in remittances per year, compared to $5,558 for immigrants from Guatemala, $5,231 for Honduras, $3,076 for Dominican Republic and $2,939 for El Salvador. We do not know if immigrants from these other countries had higher paying jobs than those from Mexico.

Source:

D’Vera Cohn, Ana Gonzalez-Barrera and Danielle Cuddington, “Remittances to Latin America Recover – but Not to Mexico”, Pew Research Center, November 15, 2013.

For more detail about remittances in Mexico, see:


Nov 022013
 

Innovation is an important ingredient of economic growth, especially growth in the decades ahead. While most people know what innovation is, it is not an easy concept to measure. Fortunately three different groups have attempted to measure it and compare countries on their “innovativeness”. All three rely on such measures as research and development, number of patents, number of researchers per person, manufacturing, and the percentage of college graduates with science and engineering degrees. However, the number and character of the specific individual variables they use are quite different. As a result their international rankings can be very different. The three approaches are briefly discussed below.

1. Bloomberg’s “Global Innovation Quotient” is based on R&D intensity (20%); manufacturing capability (10%); researcher concentration (20%); productivity (20%); High-tech density (20%); patent activity (5%) and tertiary (education) efficiency (5%).  [For more details, see Global Innovation Index (pdf)]

Bloomberg’s “Global Innovation Quotient”, for 96 countries, ranked Mexico ranked in 2012 as 46th, just behind Chile (41st) and Argentina (43rd), but ahead of Brazil (57th) and Venezuela (62nd). Other notable countries ranked as follows: Finland (1st), Singapore (2nd), USA (7th), Switzerland (8th), Canada (19th), Russia (22nd), Israel (29th) and China (32nd) and Indonesia (64th).

2. In 2009, a “Global Innovation Index” was produced by The Boston Consulting Group (BCG), the National Association of Manufacturers (NAM), and The Manufacturing Institute (MI). In March 2009, the Global Innovation Index ranked Mexico 57th. For comparison, it had Chile at 37th, Argentina at 92nd, Brazil at 72nd, and Venezuela at 108th.

These rankings are significantly higher than the Bloomberg rankings above because this index included more countries which pushed the Latin American countries lower down on the ranking list. But there are other important differences in how innovativeness was measured in the two studies. Compare the following rankings with the ones in paragraph above: Finland (7th), Singapore (1st), Switzerland (3rd), USA (8th), Canada (14th), Russia (49th), (Israel 16th), China (27th) and Indonesia (71st).

3. The third index, confusingly also called the “Global Innovation Index”, is published jointly by Cornell University, INSEAD (The Business School of the World) and the World Intellectual Property Organization (WIPO).

global-innovation-index-2013This very complicated index is based on six pillars (Institutions, human and capital research, infrastructure, market sophistication, business sophistication, knowledge and technological outputs and creative outputs.), each with sub-pillars, and a total of 84 indicators. Of the 134 countries analyzed in 2012, Mexico ranked 79th, way behind Chile (39th) also lagging behind Brazil (58th) and Argentina (70th), but way ahead of Venezuela (118th). This complex index’s rankings are different from but generally align with the two other indices: Finland (4th), Singapore (3rd), USA (10th), Switzerland (1st), Canada (12th), Russia (51st), Israel (17th) China (34th) and Indonesia (100th).

Conclusion

These three indices appear to tell us that Mexico is relatively weak when it comes to innovativeness. Mexico, along with Brazil and India, appears to lag behind other major emerging economies such as China, Russia, South Africa and Thailand. This is a bit surprising considering that Mexico is a world leader in the export of smart phones, flat panel TVs, automobiles and appliances. Apparently these exports are manufactured in Mexico but the innovations that go into their designs mostly come from elsewhere.

Though Mexico is graduating thousands of engineers and science majors, these are either not yet innovating or are finding employment in other countries. If Mexico is to compete in future world trade, it would do well to take steps now to improve its innovativeness.

Related posts:

Survey in March 2013 identifies crime as Mexico’s biggest public concern

 Mexico's geography in the Press  Comments Off on Survey in March 2013 identifies crime as Mexico’s biggest public concern
Oct 262013
 

The Pew Research Global Attitudes Project (released 24 October 2013) provides results of face to face interviews with a national sample of 1,000 adult Mexicans. The report revealed opinions concerning a wide variety of issues including the country’s direction, most important concerns, law and order, drug war, national institutions and attitudes toward the USA. Mexicans are generally dissatisfied with their country. In March 2013, 69% of Mexicans said they were dissatisfied, up from 63% in 2012, but down from 79% in 2010. The survey suggests that crime is a major cause for dissatisfaction.

The biggest concern identified in the survey is crime which 81% said was a very big problem, up from 73% in 2012. Several other crime-related issues topped the very big problem list: cartel-related violence (71%), illegal drugs (70%), human rights violations by the military and police (70%) and corrupt political leaders (69%). The concern for crime causes real fear. The survey noted that 63% say they are afraid to walk alone at night within one kilometer of their home, up 7% from 2012 and 13% from 2007. Women were only slightly more concerned about their safety than men (65% versus 60%). Those in urban areas were significantly more worried about safety than those in rural areas (70% versus 43%). On the other hand, the fact that over four in ten in rural areas were worried is both surprising and startling.

Unfortunately, we do not have a complete regional breakdown of the survey respondents. We speculate that crime is perceived as a bigger problem in high crime areas such as the north. Attitudes toward bribery appear to support this view. While 32% said they had to pay a bribe to a government official in the past year; the percentages ranged from 51% in the north to 18% in the Mexico City Region.

Over two-thirds (68%) felt that government should focus on maintaining law and order rather than protecting human rights (18%). Only 11% said that both were equally important. It is interesting that respondents from all three major political parties gave almost equal high priority to law and order: Party of the Democratic Revolution (PDR) – 66%; National Action Party (PAN) – 69% and Institutional Revolutionary Party (PRI) – 70%.

The drug war continues to be a problem; only 37% think the government is making progress, compared to 47% in 2012. Fully 29% said the government is losing ground in the drug war and 30% think it is about the same as it has been in the past. Over half (56%) blame both Mexico and the USA for drug violence. Only 20% blame just the USA, while 17% blame just Mexico. The vast majority (85%) want the Mexican army to fight drug cartels and over half (55%) would like the US government to provide weapons and training to fight the drug war. Only 34% would like to have US troops in Mexico fighting the cartels.

Given that the drug war is not going well and the military is implicated in many human rights violations, it is surprising that 72% of survey respondents feel that the military has a good influence on Mexico. This was higher than any other institution. About 68% felt the national government has a good influence. Other institutions got lower scores: the media – 66%, President Peña Nieto – 57%, Congress – 45%, court system – 44%, and police – 42%.

Aside from crime and related issues, Mexicans identified several other major problems. About five in eight (63%) considered poor quality schools a very big problem, way up from 49% in 2012. This increase was probably related to the arrest of the teachers’ union president and focus on the dire need for education reform. Other very big problems were pollution (60%), terrorism (59%) and people leaving Mexico for jobs (53%). This last item is a bit surprising since in recent years (since the Great Recession) relatively few Mexicans have left in search of jobs.

The percentage viewing the USA favorably has changed considerably in recent years. In early 2010, before passage of Arizona’s restrictive immigration law, 66% viewed the USA favorably. After passage of the law, this dropped to 44%, compared to an unfavorable view of 48%, up from 27% before the law. Clearly passage of that law had a very big impact on Mexicans. However the favorable ratings increased to 52% in 2011, 56% in 2012 and 66% in 2013. Meanwhile the unfavorable ratings dropped to 41% in 2011, 34% in 2012 and 30% in 2013.

Only 17% said they had traveled to the USA, but 21% indicated their families received money from relatives north of the border. About 47% indicated that moving to the USA leads to a better life, while 18% say it leads to a worse life. However, 44% say having citizens living in the USA is bad for Mexico, an equal number say it is good for Mexico. Apparently, the view is that it is good for individuals to move to the USA, but such moves may not necessarily be good for Mexico as a whole. Consistent with this, 35% said they would move to the USA if they had the means and opportunity, 20% would migrate without authorization while 15% would only migrate if they had authorization.

It will be interesting to see how these opinions change when the 2014 survey is conducted.

Related posts:

San Miguel de Allende: the “world’s best city”?

 Mexico's geography in the Press  Comments Off on San Miguel de Allende: the “world’s best city”?
Oct 212013
 

San Miguel de Allende has been selected as the “World’s Best City”, in the  Condé Nast Traveler‘s 26th annual Readers’ Choice Awards, announced 16 October 2013. (See also, The world’s best city is… by Frances Cha, CNN)

While being declared “the world’s best city” is an honor for San Miguel, and will no doubt increase tourism, it should be noted that it is merely a popularity contest among people visiting a website. Visitors to the website are given a list of candidates in each category and asked to rate them as excellent, very good, good, fair and poor. Within each category, voters rate individual criteria. For example, for resorts, visitors assess food/dining, location, overall design, rooms, and service. The percentage of excellent and very good ratings is used to compile the “best” lists.

smdcover

San Miguel de Allende (one of Mexico’s 31 UNESCO World Heritage sites) is noted for its well preserved colonial center, as well as for its atmosphere, culture, artist community and shopping opportunities. It beat out Budapest and Florence which tied for second. Salzburg placed 4th while last year’s winner, Charleston, South Carolina, was tied for 5th with San Sebastian, Spain. Other North American cities in the top 25 were Quebec City (10th), Vancouver, BC (13th) and Victoria, BC with Santa Fe, NM which tied for 17th. Four of the top 25 cities were in Italy: Florence (2nd), Rome (8th),  Sienna (9th) and Venice (24th).

The top five cities in Mexico, according to the Readers of Condé Nast Traveler, were:

  1. San Miguel de Allende
  2. San Cristobal de las Casas
  3. Guanajuato
  4. Morelia and Puebla – tied

However, the only Mexican cities on the questionnaire were: Acapulco, Cancún, Ciudad Juárez, Cuernavaca, Guadalajara, Guanajuato, Mérida, Mexico City, Monterrey, Morelia, Oaxaca, Puebla, Puerto Vallarta, San Cristobal de las Casas, San Miguel de Allende, Tijuana, Veracruz and Zacatecas. Each of these cities was rated with respect to cultural/sites, friendliness, atmosphere/ambiance, restaurants, lodging, and shopping. Obviously, many other Mexican cities, such as Mazatlán, are far from happy at being excluded from the list of candidate cities.

Other Condé Nast Traveler reader’s selections for Mexico included “top 15 hotels in Mexico”, “top 10 resorts in the Pacific Riviera, Mexico”, “top 10 resorts in Baja, Mexico”, and “top 30 resorts in Cancun and the Yucatan, Mexico”.

Clearly, hotels and resorts that are not included in the Condé Nast candidate list for this popularity contest miss out on a great deal of free publicity.

Related posts:

Mexico battered by massive storms from both east and west (September 2013)

 Mexico's geography in the Press  Comments Off on Mexico battered by massive storms from both east and west (September 2013)
Oct 192013
 

For the first time since 1958 Mexico was bashed virtually simultaneously by two very destructive storms: Ingrid in the east and Manuel in the west. Before discussing their destructive impact, we will describe the tracks of the two storms (photos below) and chart their chronology.

Track of Hurricane Ingrid

Track of Hurricane Ingrid

On September 10, weak weather disturbances were observed in the Caribbean east of the Yucatan Peninsula and in the Pacific south of Chiapas. The disturbance in the Caribbean gained some strength before hitting land which weakened it. It survived its crossing of the peninsula and re-emerged in warm waters of the southern Gulf of Mexico where it quickly gained strength. By the afternoon of September 12th it was upgraded to an official tropical depression.

Track of Hurricane Manuel

Track of Hurricane Manuel

Meanwhile the disturbance in Pacific moved slowly westward and by the morning of 13th was upgraded to a tropical depression. At about noon of the 13th both storms were upgraded to become named tropical storms (Ingrid and Manuel respectively) meaning they had winds of over 40 mph. In other words, the birth of “Ingrid” and “Manuel” were almost simultaneous (light green spots on the tracking maps). After earlier moving westward, both storms started to move north and slightly east picking up moisture, strength and wind speed over the warm ocean water.

Ingrid continued to move north gaining strength and by the next afternoon, the 14th, it was upgraded to a Category I hurricane with winds of 75mph. It started to move west and winds increased to 85mph on the morning of the 15th. Meanwhile Manuel also started to move west again skirting the coast of Guerrero and Michoacán. Early on the 15th Manuel’s winds reached 70mph. Though wind speeds did not quite reach hurricane level at that time and the eye of Manuel never made landfall, it brought enormous amounts of rain to coastal communities. For example, on September 14th Chilpancingo, Guerrero’s capital, got 393mm (15.5”) of rain while Acapulco got 140mm (5.5”) (Wunderground.com). This, added to considerable rain on preceding and following days, led to horrific flooding.

Satellite image of Hurricane Ingrid and Hurricane Manuel, September 2013

Satellite image of Hurricane Ingrid and Hurricane Manuel, 15 September 2013

On September 15th Hurricane Ingrid with winds of 75-85mph drifted toward Taumalipas in northeast Mexico. Meanwhile. Tropical Storm Manuel with winds about 60mph made landfall near Manzanillo, Colima. Once over land, the storm quickly lost power; by that evening winds were down to 35mph and Manuel was downgraded to tropical depression, but heavy rainfall continued. The next morning on the 16th Manuel’s winds were down to 30mph and it was further downgraded to a “remnant” of a tropical storm. But later that day, the remnant of Manuel move back to the Pacific Ocean near Puerto Vallarta and began to regain its strength.

That same morning September 16th Ingrid, which had weaken to a tropical storm with winds of 65mph made landfall just east of Ciudad Victoria, Tamaulipas. By the next morning, the 17th, Ingrid’s winds were down to 25mph and it was downgraded to a “remnant” though heavy rainfall continued.

Later on the 17th, Manuel regained its status as a tropical depression (winds of 35mph). The next morning, the 18th, it regained tropical storm status and by that afternoon it became Hurricane Manuel with winds of 75mph. Early on the 19th it made landfall west of Culiacan, Sinaloa. Moving east over land Manuel quickly lost power and was down to a remnant by the morning of the 20th. However, the remnant of Manuel continued far north and east joining the remnant of Ingrid and bringing torrential rains and flooding to central Texas, including Austin.

While storms are classified by their wind speeds from tropical depressions to tropical storms and then to hurricanes with intensities one up to five; this classification does not capture the extent of damage that can be caused. The amount of rain combined with the terrain can be far more damaging than the wind speeds. Furthermore the storm surge associated with a storm’s low pressure and high tides can be far more devastating than the winds as we saw with Hurricane Rita in New Orleans and Hurricane Sandy in New York.

In the case of Manuel, the amount of rainfall was far more destructive than the winds. The rains of Manuel as a “tropical storm” off the coast of Guerrero did far more damage than Hurricane Manuel did later in the State of Sinaloa or Ingrid did in eastern Mexico. Manual caused a total of about 84 reported deaths. At least 72 people were reported dead in Guerrero and another 68 were reported missing in the town of La Pintada that was partially buried under a massive mudslide. In Acapulco about 18 died. Floods closed the exit highways and the airport, temporarily stranding 40,000 tourists. These photos from the Guardian and USAToday show the extent of flooding in Guerrero, especially around Acapulco.

In contrast fewer than a dozen people reportedly died in Sinaloa which was later directly hit by Hurricane Manual. While Ingrid had considerably stronger winds than Manuel, its death toll of only about 23 was spread across several states from Puebla just east of Mexico City up to Tamualipas on the Texas border. More than half the total, 12 died in Altotonga, Veracruz, when a mudslide smashed into a bus. Of course, deaths are not the only, nor the best, measure of a storm’s destructive impact. Other commonly used measures are the financial cost of the damage and the number of people who evacuated or become homeless. No matter what measure is used, hurricanes are one of the most destructive natural hazards.

Related posts:

Where do most Hispanics in the USA live?

 Other  Comments Off on Where do most Hispanics in the USA live?
Sep 232013
 

A recent study by Pew Research analyzes the geographical distribution of the over 53 million Hispanics who currently live in the USA. The “Hispanic” or “Latino” population is composed of many different segments. It includes families that have lived in the USA for numerous generations as well as recent immigrants from many countries. Mexicans are by far the largest Hispanic origin group. There are 34.7 million Mexicans in the USA accounting for 64% of all Hispanics. A future post will look at the geographic distribution of Mexicans in the USA. Several previous posts, including “Recent trends for Mexicans living in the USA”, have investigated the socio-economic characteristics of Mexicans living in the USA.

Though Hispanics are spreading throughout the country, they still tend to be concentrated in the west, particularly states that border Mexico [see map]. Almost half (46%) of Hispanics live in California (14.4 million) or Texas (9.8). Other states with relatively large Hispanic populations include Florida (3.5m), Illinois (2.1m) and Arizona (1.9m). Almost 47% of New Mexico’s population is Hispanic compared to 38% in both California and Texas.

Map of Hispanic population in USAFully 44% of Hispanics live in only 10 metropolitan areas. Almost half (46%) of the Greater Los Angeles population is Hispanic. The Los Angeles–Long Beach metro area has 5.8 million Hispanics and the neighboring Riverside–San Bernadino metro area has another 2.1 million, giving Greater Los Angeles 7.9 million Hispanics, 15% of the USA total. The New York–Northeastern New Jersey metropolitan area is next with 4.3 million Hispanics. Other metro areas with large Hispanic populations include Houston (2.1m), Chicago (2.0m), Dallas (1.8m), Miami (1.6m), San Francisco–San Jose (1.6), Phoenix (1.2m), San Antonio (1.1m) and San Diego (1.0m).

Over 80% of the Greater Los Angeles Hispanic population is Mexican. Mexicans also dominate the Hispanic populations in Houston (78%), Chicago (79%), Dallas (85%) as well as most other metro areas in the USA. In metro New York, Puerto Ricans are most numerous among Hispanics (28%) followed by Dominicans (21%) and Mexicans (12%). Puerto Ricans are also most numerous in Orlando (51%), Tampa–St Petersburg (34%), Philadelphia (56%), Boston (29%) and Hartford (69%). Cubans dominate the Hispanic population in Miami (55%), Fort Lauderdale (21%) and West Palm Beach (21%). In metro Washington DC, Salvadorians are most numerous among Hispanics (32%).

Roughly one third (36%) of all Hispanics in the USA are foreign-born; the rest were all born in the USA. Miami has the highest proportion of foreign-born Hispanics with 66%. No other metro area with over a million Hispanics has more than 43% foreign-born. On the other hand, only 17% of Hispanics in the San Antonio area are foreign-born with 83% born in the USA.

Source of data:

Related posts:

The impact of immigrants on U.S. public budgets

 Updates to Geo-Mexico  Comments Off on The impact of immigrants on U.S. public budgets
Sep 052013
 

As the US Congress debates new immigration reform legislation there is considerable confusion concerning the fiscal impact of immigrants. One side argues that immigrants pay relatively little in taxes and absorb costly benefits in terms of public health, education, welfare, etc. Others note that immigrants often pay significant amounts in taxes and get little back in terms of benefits. Obviously, it depends on the immigrant and perhaps on their legal status.

OECD-migrationIn June 2013, the OECD published “International Migration Outlook,” a study on the budgetary impacts of immigrants to OECD countries. (OECD countries Mexico and 29 other mostly rich and mainly European countries). The study compares native-born with foreign-born residents, some of whom may have already become citizens. The study suggests that immigrants may have a slightly positive impact on fiscal budgets. The average for all OECD countries was 0.3% of GDP; the comparable figure for the USA was 0.03%.

Immigrants tend to have lower incomes, pay a bit less in taxes, but receive less in benefits. They tend to be younger and thus receive less in public health benefits. If they have children, they receive considerable education benefits. Obviously these are gross generalizations as some immigrants are highly paid executives and scientists, who pay significant taxes, while others may work as domestics or laborers, paying far less in taxes. Given that many public costs, including defense and debt service, are very hard to allocate to migrants versus native-born, the study suggests that immigration appears to be neither a drain nor a gain on fiscal budgets.

A big issue in the USA is the specific impact of Mexican immigrants on the fiscal budget, particularly the impacts of undocumented immigrants. Many legal immigrants from Mexico are family members joining their relatives. They may or may not be employed and thus may not pay income taxes. On the other hand, virtually all illegal immigrants seek employment. Furthermore, many obtain formal sector jobs by using fake Social Security cards or “Individual Tax Identification Numbers.” Their employers deduct federal and state income tax from their paychecks and forward these funds to government tax agencies.

Undocumented immigrants rarely file tax returns and thus very rarely receive the tax refunds to which they might otherwise be entitled. All immigrants pay considerable amounts in gasoline and sales taxes as well as property taxes, either directly or indirectly as part of their rent. Given that most illegal immigrants are rather young, relatively healthy and without children, they may have only a small impact on public education and health expenses. Their children are often born in the US, are US citizens, and should not be considered immigrants. It appears that undocumented immigrants might be paying more into the public coffers than they receive in benefits. A closer look at the data may provide some answers.

A 2007 study by the US Congressional Budget Office (CBO) entitled “The Impact of Unauthorized Immigrants on the Budgets of State and Local Governments” directly addressed this issue. The study notes that at the Federal level roughly 50% of illegal immigrants pay income or payroll taxes, which include Medicare taxes. But they generally are excluded from such Federal benefits as Social Security pensions, Medicare and Medicaid (other than emergency services), Food Stamps, and Assistance to Needy Families. The data suggest that in general illegal immigrants usually pay more in federal taxes than they receive in benefits. On the other hand, a number of court cases mandate that state and local governments cannot withhold from illegal immigrants certain services such as education, selected health care, or law enforcement. Many illegal immigrant children do not speak English; therefore their education may be more costly.

In assessing the fiscal impact on state and local government budget, the CBO analyzed 29 reports published since 1990. The study noted that undertaking such an analysis is very challenging and involves many big assumptions. Still the CBO analysis concluded that the relatively small amount spent by state and local governments on services for illegal immigrants is not fully offset by the even smaller amount of tax revenues collected from them including federal revenues they may receive for this purpose.

In conclusion, available research suggests that the impact of immigrants on public budgets is not very clear. With respect to all immigrants, there appears to a slight positive fiscal impact according to a recent OECD study. The older CBO analysis indicates that undocumented immigrants appear to have a positive impact of the federal budget, but a negative fiscal impact for state and local governments. Of course, the impact varies enormously among migrants depending on their incomes, tax brackets, consumption patterns and needs.

Related posts:

Mexico’s position among the most populous countries to 2100

 Updates to Geo-Mexico  Comments Off on Mexico’s position among the most populous countries to 2100
Aug 122013
 

How does Mexico compare with the world’s most populous countries? Available information suggests that in 1500, before the Spaniards arrived, the population of the area that is now Mexico was roughly 15 to 20 million (McCaa 1997). At that time Mexico may have been the third most populous country behind only China and India. However, by 1600 the population had crashed to about 1.6 million, one of the most dramatic population collapses in human history. Mexico did not regain its pre-Columbian population level until about 1900. But the population declined by about 6% during the Mexican Revolution, 1910-1920.

Children in Zitácuaro, Michoacán. Photo: Tony Burton. All rights reserved.

Photo: Tony Burton. All rights reserved.

A recently published UN study, World Population Prospects, The 2012 Revision, enables us to compare Mexico’s population with that of other countries for 1950, 2013, 2050 and 2100. Slow but steady growth brought Mexico’s population up to 28 million by 1950, ranking Mexico 16th just ahead of Spain and right behind the Ukraine. Very rapid growth peaking in the 1970s increased Mexico’s population to about 120 million by 2013. [The UN report quotes Mexico’s 2013 population as 122 million, whereas Mexico’s CONAPO (National Population Commission) estimates the current population is 118.4 million, the difference perhaps due to differing assumptions about international migration.]

This ranked Mexico 11th in the world just behind Japan, but ahead of the Philippines. [The 15 most populous countries in 2013 are China (1,386m), India (1,252m), USA (320m), Indonesia (250m), Brazil (200m), Pakistan (182m), Nigeria (174m), Russia (143m), Japan (127m), Mexico (122m), Philippines (98m), Ethiopia 94m), Vietnam (92m) and Germany (83m)]

By 2020, Mexico will pass Japan to become 10th, the highest it will ever rank except for during the pre-Columbian era.

The UN study forecasts that the Mexican population will grow to 156 million by 2050. This is considerably higher that the Mexico’s National Population Commission (CONAPO) forecast, which uses higher rates of out-migration. In 2050 Mexico will be back in 11th place, having jumped ahead of Russia, but having been passed by Ethiopia and the Philippines. According to the UN study by 2050 India will have passed China, and Nigeria will have replaced the USA as the 3rd most populous.

By 2100 Mexico’s population will be down to 140 million, putting it in 16th place behind Nigeria and five other very rapidly growing African countries: Tanzania, Congo, Uganda, Niger and Kenya. Interestingly, between 2050 and 2100 all of the 31 largest countries are expected to lose population except the USA, the Philippines, and 12 African countries. The world’s total population will have essentially leveled off by 2100 at about 10.9 billion with African countries continuing to grow while European and Asian countries experience population declines. Of course many unexpected demographic changes may occur between now and 2100.

According to the study, Mexico’s life expectancy at birth will be 90.0 years in 2100, above the USA’s level of 88.8 years, but behind Canada at 91.2 years. Mexico’s total fertility rate is forecast by the UN at 1.99 children per women in 2100 which is considerably higher than rates forecast by Mexico’s CONAPO and other demographers.

Reference:

Robert McCaa, Robert. 1997. “The Peopling of Mexico from Origins to Revolution”, preliminary draft for Richard Steckel & Michael Haines (eds.), The Population History of North America, Cambridge University Press, 1997.

Related posts:

Aug 052013
 

A recent study published by the Clean Air Institute analyzed air pollution in 22 Latin American cities:

  • Air Quality in Latin America: An Overview (May 2013; pdf file)

Six Mexican cities were included in the study: Mexico City, Guadalajara, Monterrey, Puebla, Ciudad Juárez and León. However, only limited data were available for Puebla, Cd. Juárez and León. One of the main conclusions of the study is that Mexico has about the worst urban air pollution in Latin America. It is believed to be responsible for about 15,000 deaths in Mexico each year.

The focus was on the following air pollutants:

  1. Particulate matter is divided into two measures; particles less 2.5 microns in diameter (PM2.5) and those less than 10 microns (PM10). PM2.5 pollution is extremely harmful because it penetrates deep into lungs causing inflammation and worsening heart and lung diseases. This can be fatal.
  2. Ozone is formed in the air when oxides of nitrogen and volatile organic compounds mix with intense sunlight. The very intense sunlight in Mexican cities makes them particularly prone to ozone pollution.
  3. Nitrogen dioxide (NO2) is caused by high temperature combustion of fossil fuels in vehicles, factories and power plants. It can aggravate lung diseases as well as contribute to ozone and fine particle pollution.
  4. Sulfur dioxide (SO2), which also comes from burning fossil fuels, contributes to heart and respiratory disease. Unfortunately, not all of the 22 cities had data on all four pollutants. Consequently comparisons among cities are a bit limited.

According to the study, Mexican cities had some of the worst urban particulate pollution in Latin America, significantly above WHO standards. Of the 16 cities with data, Monterrey had by far the worst PM10 pollution with 85.9 micrograms per cubic meter (ug/m3); considerably worse than the perennially dusty Lima with 62.2 ug/m3. Guadalajara came second with 70.1 ug/m3, Mexico City was 6th with 57.0 ug/m3, and León placed 11th with 39.0 ug/m3, even worse than Sao Paulo at 36.5 ug/m3. Though not in the study, Mexicali has worse PM10 pollution than Monterrey. Also Monterrey’s PM10 levels are much better than many major world cities including Cairo, Delhi, Kolkata, Beijing, Chengdu, Bangalore, Shanghai, Dacca, Jakarta, and Karachi.

Mexico City air quality in 1980 (Photo: Tony Burton)

Mexico City air quality in 1980 (Photo: Tony Burton)

Mexico did a bit better with respect to the more serious PM2.5. Of the 11 cities with data, Bogota was worst with 35.1 ug/m3 followed by Lima at 31.5ug/m3 and San Salvador and Montevideo at 28.0 ug/m3. The two Mexican cities with data, Mexico City (26.2 ug/m3) and Monterrey (25.9 ug/m3) were 6th and 8th.

Mexican cities also have some of the highest levels of ozone pollution. Of the ten cities with data, five of the six worst were Mexican cities. Guadalajara had the highest ozone pollution with 69.3 25.9 ug/m3 followed closely by León 68.9 at ug/m3. Mexico City was 4th (59.4 ug/m3); Monterrey was 5th (55.2 ug/m3); and Cd. Juárez came 6th (46.3 ug/m3), just ahead of Quito (44.1). Much better ozone levels were recorded by Sao Paulo (36.0 ug/m3), Santiago (28.8 ug/m3) and Bogota (21.1 ug/m3).

Cities in Mexico also had high levels of nitrogen dioxide. The highest levels were in Montevideo (70.0 ug/m3), but Guadalajara (57.2ug/m3), Mexico City (54.2 ug/m3) and León (45.5 ug/m3) placed 2nd, 3rd and 4th worst among the 14 cities with data. Monterrey was much better with the third lowest nitrogen oxide level (29.0 ug/m3), trailing only Lima (12.8 ug/m3) and Quito (23.3 ug/m3).

Mexican cities were also among the worst in terms of sulfur dioxide pollution. Of the 13 cities with data, León had by far the highest level with (23.4 ug/m3), followed by Medellin (16.0 ug/m3). Mexico City was 3rd worst (15.3 ug/m3); Monterrey was 4th (13.1 ug/m3); and Guadalajara was 6th (8.6 ug/m3).

In summary, the study indicates that Mexico has about the worst urban air pollution in Latin America. Fortunately, Mexico City, which used to be considered one of the most polluted cities in the world, has significantly improved its air quality in the last few decades. (see Rhoda and Burton, Geo-Mexico: The geography and dynamics of modern Mexico, p 177)

On the other hand, other major cities in Mexico have not had the same experience. The data in this study appear to suggest that among Mexico’s three biggest cities, Guadalajara has the worst air pollution followed by Mexico City and then Monterrey. (This study found insufficient data for comparisons with Puebla, Cd. Juárez and León.)

Other posts on urban air pollution:

May 172013
 

Each year the United National Development Program (UNDP) publishes Human Development Index (HDI) scores and ranks for all countries with available data. The 2013 report, which is based on 2012 data, was just published. (Summary HDI 2013 Report: Rise of the South: Human Progress in a Diverse World)

The index takes account of three key development indicators:

  • Life expectancy at birth,
  • Literacy and school enrollment,
  • Gross National Income (GNI) per person (on a Purchasing Power Parity basis, which uses the total amount of goods and services produced in an economy, independent of exchange rates).

The HDI theoretically varies from 1.0 for the highest and 0.0 for the lowest. In the 2013 report, Norway is highest with a score of 0.955 while Congo and Niger are tied at rank 186 for lowest with scores of 0.304.

hdi-report-2013The latest report identifies Mexico along with 17 other countries that have made outstanding progress since 1990. This group of 18 includes none of the traditional industrialized countries. Those at the top of the progress list include South Korea, Chile, Mexico and Malaysia followed by such major countries as Brazil, Turkey, Thailand, China, Indonesia, India and Bangladesh. The HDI scores of all the world’s countries have improved significantly in the last 30 years; but the scores of non-western countries have increased spectacularly over this period.

While HDI scores receive considerable attention, the UNDP’s Inequality-Adjusted HDI or IHDI is a better overall measure because it is far less skewed by the extremely wealthy whose very high incomes push up the GNI per person values but do not adequately represent the development of the society as a whole. For example, the USA ranks third in HDI with a score of 0.937, due in part to the extreme wealth of its highest 1%. On the IHDI scale, the USA scores only 0.821 and ranks 16th.

Mexico’s HDI score is 0.775, but its IHDI score is of 0.593 is much lower because of the great inequality between the rich and poor in Mexico. In terms of IHDI, Mexico ranks 55th. This places Mexico well behind Chile (41st, 0.664), Argentina (43rd, 0.653) and Russia. (2012 data are not available for Russia, but 2011 data places it well ahead of Mexico.) On the other hand, Mexico’s IHDI score is ahead of Peru (62nd, 0.561), Turkey (63rd, 0.560), China (67th, 0.543), Brazil (70th, 0.531), Indonesia (79th, 0.514) and Egypt (0.503). Major countries that seriously trail this group include: India (91st, 0.392), Bangladesh (95th, 0.374), Pakistan (98th, 0.356), Kenya (102nd, 0.344), Nigeria (119th, 0.276) and Ethiopia (121st, 0.269).

The main conclusion is that the overall quality of life continues to improve rapidly in Mexico as well as in many other so-called developing countries. Current trends suggest these improvements will continue in the years ahead. The Congo, ranked 134, is last with a score of 0.172. IHDI scores are not available for many countries because they lack appropriate income distribution data.

Related posts:

Several major Mexican companies among the “Global Challengers”

 Updates to Geo-Mexico  Comments Off on Several major Mexican companies among the “Global Challengers”
Apr 192013
 

The Boston Consulting Group (BCG) periodically identifies 100 companies from rapidly developing economies as “global challengers.” (Bcgperspectives, “Introducing the 2013 BCG Global Challengers“).

BCG has identified 100 companies for this list in 2006, 2008, 2009, 2011 and 2013. They focus on companies in developing Asia (excluding Japan, South Korea, Taiwan, Hong Kong and Singapore), Eastern Europe, the Commonwealth of Independent States, the Middle East, Latin America, and Africa. Companies considered for the list must have annual revenues of at least $1 billion, overseas revenues at least 10% of total revenues or $500 million, and be focused on building a truly global footprint.

The biggest emerging economies have dominated. In 2006 the list included 44 Chinese companies, 21 Indian companies and 12 from Brazil. Russia was next with seven followed by Mexico with six. The dominance of the big three declined from 77 in 2006 to 63 in 2013. One reason for this is that some of the countries on the list “graduated” from the challengers list to become full global competitors.

In 2013, China led with 30 companies, followed by India with 20 and Brazil with 13. Mexico was 4th with seven companies, followed by Russia with six, South Africa with five, Thailand with four and Turkey with three. Countries with two companies on the list are Chile, Malaysia, and Saudi Arabia. Those with one company on the list are Argentina, Colombia, Egypt, Qatar and United Arab Emirates.

The seven Mexican companies in the group are Alfa, American Movil, FEMSA, Gruma, Grupo Bimbo, Mabe, and Mexichem. One Mexican company, Cemex, has “graduated” from the “challengers” list. It is the world’s largest building materials supplier and 3rd largest cement maker. Cemex now operates in 50 countries on six continents and is the leading cement seller in the USA. Revenues in 2012 were $15 billion.

ALFA is the world’s leading manufacturer of high-tech aluminum engine heads and blocks through its subsidiary Nemak. Its other major subsidiaries are Alpek (petrochemicals), Sigma Alimntos (foods) and Alestra (electronics and telecommunications). Revenues in 2012 were $15 billion.

América Móvil. operates Telmex and Telcel, the world’s fourth largest cell phone operator with 160,000 employees and over 250 million subscribers mostly in Latin America and the USA. Its revenues in 2012 were $59 billion. It is a candidate to graduate from this “challengers” group in the near future.

Gruma is the world’s largest producer of corn flour and tortillas. It has subsidiaries in the USA, China, UK, and Latin America. Revenues in 2012 were $5 billion.

FEMSA, based in Monterrey, is the world’s largest bottler of Coca-Cola. FEMSA also operates OXXO, the largest convenience store chain in Latin America. Revenues in 2012 were $18 billion.

Grupo Bimbo is the world’s largest bread maker and the biggest bread seller in the USA. Among its 100 brands are Arnold’s, Entenmann’s, Thomas’s English Muffins, and Sara Lee fresh baked products. Bimbo is the world’s 4th largest food company behind only Nestle, Kraft, and Unilever. Revenues in 2012 were $13 billion.

Mabe. is a leader in the production of large household appliances such as stoves, refrigerators, washers, dryers, etc. These are sold in 70 countries under the General Electric and Mabe brand names. It controls 70% of the market in Latin America. Revenues in 2012 were $4 billion.

Mexichem is a chemical company that operates throughout the Americas as well as in Europe and Asia. It exports to more than 50 countries, has over 10,000 employees, and earns over $4 billion annually.

Related posts

Implementing President Enrique Peña Nieto’s “Pact for Mexico”: a lesson in Mexican Civics

 Other  Comments Off on Implementing President Enrique Peña Nieto’s “Pact for Mexico”: a lesson in Mexican Civics
Apr 132013
 

In an earlier post, we described President Enrique Peña Nieto’s very ambitious “Pact for Mexico”. Very briefly, the Pact addresses 95 important issues in five broad categories: reducing violence, combating poverty, boosting economic growth, reforming education, and fostering social responsibility.

Achieving these reforms will require passage of new legislation by a majority in both houses and signed into law by the President. Many of the reforms will require passage of Constitutional amendments which require two-thirds majority in each house as well as approval by at least half of the states.

Passing the reforms will be a real challenge because the President’s party, PRI (Partido Revolucionario Institucional, Institutional Revolutionary Party), holds only 41.4% of the seats in the Chamber of Deputies (207 of 500) and 40.6% of the seats in the Senate (52 of 128). If they join forces with their natural ally PVEM (Partido Verde Ecologísta de México, Green Party), they still fall short of a majority: 48.2% in the Chamber and 47.7% in the Senate. While some important leaders of PAN (Partido Acción Nacional, National Action Party) and PRD (Partido de la Revolución Democrática, Party of the Democratic Revolution), Mexico’s two other major parties, have “signed” on to the Pact and are serving on the Pact Implementation Committee, many PAN and PRD members have not formally supported it.

If PRI gets complete support from the PRD and the other two leftist parties PT (Partido del Trabajo, Labor Party) and MC (Movimiento Ciudadano (Citizens’ Movement, formerly known as Convergencia or Convergence) they can pass reform legislation. But they still would be unable to pass Constitutional amendments because while they would have a two-thirds majority (68.4%) in the Chamber they would not in the Senate (62.5%). Furthermore, to get all legislators from these leftist parties to agree, they might have to make the reforms so radical that they might lose some support from some PRI and PVEM legislators.

If all PRI and PAN legislators agreed, they would have a 70.3% majority in the Senate, but would still have only 64.2% in the Chamber, less than the two-thirds majority needed to pass Constitutional amendments.

In conclusion, the only way the major “Pact for Mexico” reforms which require Constitutional amendments can be implemented is through serious bargaining and coalitions. One possible successful coalition would be PRI, PAN and PVEM; it would have 71.0% in the Chamber and 77.3% in the Senate. Such a group would probably have to opt for a more neo-liberal approach to gain PAN votes. Another, more radical coalition would be PRI, PRD, PT, CV and PVEM, which would have 75.2% in the Chamber and 69.5% in the Senate. In any case, to get reforms passed, the legislation might have to be so watered down that it would not significantly change the status quo. On the other hand, there appears to be such a groundswell of support for the “Pact for Mexico” that the existing parties may feel great pressure to move forward with meaningful reforms. Only time will tell.

Mexico seen as the “Flavor of the Month” among Latin American Economies

 Mexico's geography in the Press  Comments Off on Mexico seen as the “Flavor of the Month” among Latin American Economies
Apr 062013
 

In a presentation entitled “Mexico’s Outlook” in Ajijic, Jalisco, Mexico, on 20 March 2013, noted Mexican political economist Leo Zuckermann explained how many economists see Mexico as the “flavor of the month” among Latin American economies.  Brazil previously was the star of Latin America as evidenced by the 14-20 November 2009 cover of  The Economist. However, Brazil’s performance slowed considerably in 2012; its GDP grew by only 1.0% and the dollar value of its stock market actually declined by 0.5% in 2012. (The Economist, 19 January 2013, p 93)

Economist covers

Mexico is the new star according to The Economist 14-page Special Report on Mexico in its 24-30 November 2012 edition. Mexico’s GDP grew by 4.0% in 2012, faster than the US, Canada and all European economies, though it did trail China (7.7%), India (5.4%), Indonesia (6.3%) and Thailand (5.8%). In dollar terms its stock market shot up an impressive 33.6% in 2012, tied with Germany and faster than all other sizable countries, except Turkey (75.8%), Thailand (45.9%) and Egypt (43.9%). (The Economist, 19 January 2013, pp 92, 93).

Mexico is expected to grow by 3.5% in 2013. However, it should be noted that after appearing on The Economist cover in November 2009, Brazil’s GDP declined steadily from over 8% to only 1%. We hope that Mexico can avoid this Economist cover jinx.

Mexico’s recent growth and positive outlook is largely dependent on continued expansion of exports, particularly the sale of automobiles and electronics to the USA. In 2013, Mexico is expected to surpass Japan as the leading exporter of light vehicles into the USA.

Though Mexican industrial export numbers are impressive, many of the components of these exports are initially imported. For example, the foreign content of Mexico’s electronic exports is 61%, compared to about 40% for China, 45% for Korea and only 11% for the USA.

Much of Mexico’s export capacity results from foreign direct investment in Mexico. However, such investment declined from nearly $30 billion a year in 2007 and 2008 to only $12.7 billion in 2012 (The Economist, 19 January 2013, pp 92, 93). This could limit export growth in future years. Furthermore Mexican direct investment abroad in 2012 was $25.5 billion almost twice the amount foreigners invested in Mexico. Prior to 2012 foreigners invested far more in Mexico than vice versa. This trend suggests that many Mexican investors see better opportunities abroad than in Mexico. Such investments are one reason for the rapid foreign expansion of some major Mexican multinational corporations such as Cemex, América Móvil, FEMSA and Bimbo. Another factor suggested by these numbers is that both foreign and Mexican investors do not see many attractive opportunities for domestic industries selling to the Mexican market. If Mexico is indeed now the “flavor of the month,” it remains to be seen if Mexico can retain its current popularity.

Related posts:

How does corruption in Mexico compare to Brazil, China, India and Russia?

 Other  Comments Off on How does corruption in Mexico compare to Brazil, China, India and Russia?
Mar 282013
 

Corruption is a serious concern in Mexico and these other four major emerging economies. Corruption is rather subjective and not an easy concept to measure. This post looks into corruption in Mexico, Brazil, China, India and Russia, as reported by Transparency International (TI) in its Perceived Corruption Index 2012 and the World Justice Project (WJP) Rule of Law Report for 2012-2013.

Transparency International’s “Index of Perceived Corruption” is based on a wide array of surveys, polls of international experts and interviews with knowledgeable residents. In TI’s analysis of 2007 results, Mexico, Brazil, China and India were all tied at 72nd out of 179 countries. Russia was far behind at 143rd However, by 2012, Mexico had slipped to 105th; India had dropped to 94th, China to 80th, while Brazil improved a bit to 69th. (See also Tim Padgett’s “Tale of Two Corruptos: Brazil and Mexico on Different Transparency Paths”.) Russia moved up a bit, but still was 133rd. Mexico’s fall in the rankings might have been associated with the explosion of drug cartel violence between 2007 and 2012.

The World Justice Project (WJP)’s 2012-2013 Report “Absence of Corruption” ranked Brazil and China at 38th of 97 countries; Russia was ranked 70th, Mexico 74th and India 81st. These WJP rankings do not correlate very well with those of Transparency International (IT). For example, Russia appears far more corrupt in the TI rankings, while India looks more corrupt on the WJP rankings.

The WJP looks into four separate corruption sub-factors. These are listed below with the ranks of the five countries:

1. Government officials in the executive branch do not use public office for private gain.

  • Brazil (40th of 97), Mexico (49th), China (49th), Russia (56th) India (89th)

2. Government officials in the judicial branch do not use public office for private gain.

  • Brazil (33rd), India (52nd), Russia (67th), China (70th), Mexico (84th)

3. Government officials in the police and the military do not use public office for private gain.

  • China (36th), Brazil (37th), Russia (67th), Mexico (84th), India (86th)

4. Government officials in the legislative branch do not use public office for private gain.

  • China (30th), Mexico (51th), Brazil (75th), Russia (77th), India (81st)

The results suggest that Mexico’s main corruption problems are not with the executive and legislative branches, perhaps because the Mexican constitution limits elected officials to only one term. The main problems are with the judicial and police/military branches. Mexico’s judicial reform program which is currently being implemented, should reduce judicial and police corruption. Also police and penal code reforms advocated by President Peña Nieto’s “Pact for Mexico” should help. Mexico’s future corruption ranks according to both TI and WJP could be a bit better because the “Pact for Mexico” identifies corruption as a priority. Only time will tell.

President Enrique Peña Nieto’s “Pact for Mexico”

 Other  Comments Off on President Enrique Peña Nieto’s “Pact for Mexico”
Mar 182013
 

President Enrique Peña Nieto has proposed a 34-page “Pact for Mexico” which addresses 95 important issues in five broad categories:

  • reducing violence
  • combating poverty
  • boosting economic growth
  • reforming education
  • fostering social responsibility

Though there are few details, the Pact specifically calls for:

  • Universal Social Security, Unemployment Insurance and Health Care Systems
  • Providing every public school student with a computer
  • Opening petroleum exploration to foreign investment
  • Creating a single national penal code, abolishing all the state penal codes.

Obviously, many of his objectives are very ambitious. For example, opening petroleum exploration to foreign investment could increase future production significantly but violates national sovereignty in the eyes of many Mexicans. Replacing all state penal codes with a national code could be messy; for example, abortion is legal in Mexico City but a crime in most other states. Several previous presidents have tried and failed to unify the criminal codes.

While most Mexicans enthusiastically support the reform package, many argue that, almost by definition, any 95-point plan lacks real focus and priority. Others say it will be nearly impossible to implement. On the other hand, as governor of the State of Mexico, Peña Nieto established a record of making ambitious promises and implementing them. For example, he was one of the first three governors to implement former President Calderón’s new legal reform program. In addition, he has already obtained the formal agreement of Mexico’s two other major parties, PRD and PAN, both of which have three members on the 14 member “Pact for Mexico” implementation team.

Investors seem impressed. When the Pact was announced, the Mexican stock market (Bolsa Mexicana de Valores, BMV) went up 1.2%, while markets in New York declined. Furthermore, Peña Nieto’s Party, PRI, has a strong plurality in both the Mexican Senate and Chamber of Deputies. He already has pushed through a Constitutional amendment on education reform and arrested the leader of the powerful teacher’s union on embezzlement charges.

We will have to wait and see how well Peña Nieto does with his very ambitious “Pact for Mexico”. If he achieves only a third of his objectives, he may replace Benito Juárez as Mexico’s “best president ever”. If he fails, Mexico will have to wait for future administrations to address the serious issues that face the country.

Related posts:

Does Mexico have an “Open Government”?

 Other  Comments Off on Does Mexico have an “Open Government”?
Mar 122013
 

The World Justice Project (WJP) 2012-2013 Report recently assessed 97 countries on eight Rule of Law factors. The “Open Government” factor involves engagement, access, participation, and collaboration between the government and its citizens. It includes accountability, freedom of information, and ability to petition the government.

The WJP ranked Mexico 32nd of 97 countries in terms of “Open Government”. Brazil ranked one better at 31st, while India (48th), China (69th) and Russia (70th) trailed significantly. For comparison, Sweden was ranked 1st, Canada 6th, USA 13th, Ghana 30th, Italy 47th, Guatemala 58th. Four African countries occupied the very bottom places: Ethiopia, Cameroon, Sierra Leone and Zimbabwe (94th to 97th , respectively).

In assessing open governments, the WJP uses four subfactors (with Mexico’s rank among the 97 countries in parentheses):

  1. The laws are publicized and accessible (48th)
  2. The laws are stable (26th)
  3. Right to petition the government and public participation (53rd)
  4. Official information is available on request (39th)

These scores suggest that Mexico is pretty much in the middle of the 97 countries assessed. It would do well to focus attention on better publicizing laws and encouraging public participation.

A previous post focused on the WJP analysis of Mexico’s “Criminal Justice System”. Future posts will investigate other “Rule of Law” dimensions of the WJP study.

Reforms badly needed for Mexico’s criminal justice system

 Other  Comments Off on Reforms badly needed for Mexico’s criminal justice system
Mar 052013
 

The World Justice Project (WJP) 2012-2013 Report recently assessed 97 countries in terms of Rule of Law, which the WJP defines as “the underlying framework and rights that make prosperous and fair societies possible… where laws protect fundamental rights, and where justice is accessible for all”. Its definition includes four universal principles:

  1. The government and its officials and agents are accountable under the law.
  2. The laws are clear, publicized, stable and fair, and protect fundamental rights, including the security of persons and property.
  3. The process by which the laws are enacted, administered and enforced is accessible, fair and efficient.
  4. Justice is delivered by competent, ethical and independent representatives and neutrals, who are sufficient in number, have adequate resources, and reflect the makeup of the communities they serve.

The WJP looks at eight “rule of law” factors: limited government powers, absence of corruption, order and security, fundamental rights, open government, regulatory enforcement, civil justice and criminal justice. Rather than attempt to combine all these factors into one rule of law index, the WJP looks at each factor separately. National scores on each factor are developed by surveying 1000 respondents in each country, as well as collecting questionnaires from in-country experts. This post looks at criminal justice; future posts will look at other rule of law factors.

Mexico scored particularly poorly with respect to “Criminal Justice” which the WJP defines as “a key aspect of the rule of law, as it constitutes the natural mechanism to redress grievances and bring action against individuals for offenses against society. An effective criminal justice system is capable of investigating and adjudicating criminal offences effectively, impartially, and without improper influence, while ensuring that the rights of suspects and victims are protected.”

According to the WJP report, Mexico’s criminal justice system ranks a very low 89st of 97 countries. It was 13th of 16 Latin American countries, and 29th of 30 middle income countries. These very low ranks are startling, given Mexico’s relatively high marks on most development indicators. Mexico even ranked below such economically poor countries as Pakistan (80th), Guatemala (84th), Egypt (56th), Ethiopia (49th), Senegal (54th) and Tanzania (47th) as well as behind Brazil (52nd), Russia (75th), India (64th) and China (39th). By way of comparison, Denmark ranked 1st, Canada 13th , Botswana 18th, and the USA 27th.

In assessing criminal justice, the WJP uses seven subfactors (with Mexico’s rank among the 97 countries):

  • criminal investigation system is effective (77th of 97),
  • criminal adjudication system is timely and effective (84th),
  • correctional system is effective in reducing criminal behavior (85th),
  • criminal justice system is impartial (89th),
  • criminal justice system is free of corruption (87th),
  • criminal justice system is free of improper government influence (57th),
  • due process of law and rights of the accused (78th).

Mexico ranked behind Brazil, China, India and Russia on all seven of these subfactors with only a couple of exceptions. China ranked 97th (dead last) and Russia ranked 80th in “criminal justice system is free of improper government influence.” Also Russia ranked behind Mexico at 84th in “due process of law and rights of the accused.”

These really poor ranks indicate that virtually all aspects of the Mexican criminal justice system are in dire need of reform and improvement. Fortunately, reform is on the way. “Judicial Reform in Mexico,” (published by the Trans-Border Institute of the University of San Diego in May 2010) summarizes the four main elements of Mexico’s Judicial Reform Law, approved by Congress in 2008, as:

  1. new oral, open to the public, adversarial procedures
  2. presumption of innocence and adequate legal defense for all accused
  3. modification of police and investigatory procedures
  4. tougher measures for combating organized crime

The reforms are scheduled for implementation by 2016, but may take a bit longer.

Some states, like Chihuahua, State of México, Morelos, Oaxaca, Nuevo León and Zacatecas, have already started implementing reforms, but some other states are lagging well behind. Full implementation of all the much needed judicial reforms will take many years, perhaps decades. On the bright side, at least reforms are in the process of being implemented.

Mexico’s population: now over 117 million and expected to peak at about 138 million

 Updates to Geo-Mexico  Comments Off on Mexico’s population: now over 117 million and expected to peak at about 138 million
Feb 282013
 

Mexico’s population in January 2013 was 117.4 million; 57.3 million males (48.8%) and 60.1million (51.2%) females according to a December 10, 2012 report by CONAPO (Consejo Nacional de Población) in Proyecciones de la población de México 2010-2050”. By January 2014 it will grow by over a million to 118.6 million. However demographic trends indicate that population growth in Mexico is declining significantly.

The birth rate is expected to fall from 19.7 births per 1,000 population in 2010 to 14.0 in 2050. As the Mexican population ages the death rate is projected to increase from 5.6 per 1,000 in 2010 to 9.2 in 2050. Consequently the annual rate of natural population growth is expected to decline from 1.41% in 2010 to 0.48% in 2050. Extrapolating the trends from the CONAPO projection suggests that death rates will surpass birth rates sometime in the by 2070s and natural population change will become negative. Of course, we must also take emigration into account.

According to the CONAPO report net emigration from Mexico was 321,000 in 2012, though some have noted that due to the Great Recession net emigration to the USA is near zero or less [Pew Research Center’s “Net Migration from Mexico Falls to Zero – and Perhaps Less”]. CONAPO expects net emigration to peak at about 689,000 by 2020 and then gradually decline to 590,000 by 2050. Given the current low levels of emigration to the USA and the rapid growth of the Mexican economy, some feel that these levels are rather high.

As a result of trends in birth rates, death rates and emigration, Mexico’s population growth rate is declining. Annual population growth is expected to fall below a million in 2017, below 500,000 in 2032 and below 100,000 by 2049. Extrapolating the rates in the CONAPO projection, Mexico’s population growth is expected to peak in 2053 at 137.6 million and then start to gradually decline. Of course, it is very difficult to accurately project emigration figures. If emigration is a third less than projected by CONAPO, then Mexico’s population could peak at 145 million.

Related posts:


Which political party has the most state governors?

 Other, Updates to Geo-Mexico  Comments Off on Which political party has the most state governors?
Feb 162013
 

Mexican governors are elected for single six-year terms; re-election is not permitted by the Mexican Constitution. The terms of governors in different states overlap; for example, seven of the 32 governors began their term of office in 2012.

The PRI (Partido Revolucionario Institucional, Institutional Revolutionary Party) currently holds 19 of the 32 governorships spread throughout Mexico (states colored red on map), except for the northwest and extreme south. On 1 March 2013, PRI will gain another governorship when Aristoteles Sandoval of PRI replaces the current PAN Governor of Jalisco. Although PRI Presidential candidate, Enrique Peña Nieto, easily won the Mexican Presidency in 2012, of seven new governors inaugurated in 2012, only three were from PRI.

Ex-President Calderón’s PAN (Partido Acción Nacional, National Action Party) is a distant second with seven governorships (blue on map); six after 1 March 2013. Four of the PAN governorships are in the northwest.

The PRD (Partido de la Revolución Democrática, Party of the Democratic Revolution) is third with four governorships (yellow on map). Three of the PRD governors took office in 2012. PRD has held the important governorship of the Mexico City Federal District since 1988.

State governorships, 2010 and 2013

State governorships, 2010 and 2013

The Governor of Oaxaca (brown on 2013 map) is from the Movimiento Ciudadano (Citizens’ Movement, formerly known as Convergencia or Convergence), which supported López Obrador in the 2006 presidential election. The Governor of Chiapas is from the PVEM (Partido Verde Ecologísta de México; Mexico’s Green Party; green on the 2013 map).

The north-south political divide that we have referred to in some previous posts, including the equivalent map for 2010 shown above, is no longer evident in the current pattern of state governorships.

Related posts:

Why Is Mexico in the OECD?

 Other  Comments Off on Why Is Mexico in the OECD?
Jan 172013
 

The Organisation for Economic Co-operation and Development (OECD) was founded in 1961 to promote economic growth. Its current 34 members include 25 European countries along with Canada, the USA, Australia, New Zealand, Japan, South Korea, Mexico, Chile and Israel. Mexico joined the group in 1994. Four new members were admitted in 2010: Chile, Slovenia, Estonia and Israel. Russia is not yet a member but is moving toward that goal. The current Secretary General of the OECD is Mexico’s  José Ángel Gurría Treviño, first appointed in 2006; his current term in this position extends to 2016.

oecd_logo

OECD member countries are among the most highly developed and wealthiest countries on the planet. Though OECD members represent only 18% of the world’s population, they account for 55% of global Gross Domestic Product (GDP), measured on a Purchasing Power Parity (PPP) basis. Among OECD members, Mexico has the lowest per capita GDP, slightly behind Chile and Turkey. In terms of the UN Human Development Index (HDI) Mexico trails all the others except Turkey. How did Mexico become a member of this very elite set of countries?

There are three main criteria for OECD membership:

  1. Democracy and respect for human rights
  2. Open market economy
  3. GDP per capita (PPP) at least as high as the poorest OECD member

When Mexico became a member in 1994, it was a democracy albeit a one party democracy. It was very clearly an open market economy and its per capita GDP was slightly higher than Turkey’s. Consequently, it met the criteria and was admitted by other OECD members. (See Elżbieta Czarny et al., The Gravity Model and the Classification of Countriesin Argumenta Oeconomica, 2 (25) 2010.)

What are the benefits of OECD membership?

As a member, Mexico fully participates in OECD discussions concerning economic, social and environmental situations, issues, experiences, policies, and best practices. OECD collects and analyzes a very wide range of data which enables Mexico to monitor its position and progress on numerous important dimensions. OECD also has numerous world class experts and committees that can assist countries on specific issues and policies.

Certainly being a member of this elite group provides Mexico with an amount of international prestige. On the other hand, most development analyses and comparative OECD reports show Mexico near the bottom on most measures and rankings.

Related posts:

Globalization: Mexico exports almost all motor vehicles it produces, but imports new cars

 Updates to Geo-Mexico  Comments Off on Globalization: Mexico exports almost all motor vehicles it produces, but imports new cars
Jan 082013
 

Which company exports the most motor vehicles in Mexico? In term of units exported, Ford was the leader with 449,925 units. Ford exported over 97% of the vehicles it made in Mexico in 2011. Though Ford sold many new cars in Mexico, virtually all were imports, mainly from the USA or Canada. GM was a relatively close second with 443,237 vehicles exported, 81% of the total produced.

VW was next with 439,925 units exported, 84% of their total. Nissan was fourth with 411,660 vehicles exported which was a significantly lower percentage (68%) of its total production. Nissan sells about a third of its Mexican produced vehicles in Mexico, by far the highest percentage among auto manufacturers in Mexico.

Chrysler/Fiat exported 266,117 vehicles, 79% of their total production. Toyota was next with 49,549 vehicles exported for an amazing 99.9% of the total manufactured. Surprisingly only 47 of the almost 50,000 Toyotas made in Mexico in 2011 were sold in Mexico; all of the rest were exported to the USA or Canada. Virtually all of the thousands of new Toyotas sold in Mexico are imported. This is a very extreme case of globalization at work under NAFTA. Honda exported 36,429 units in 2011 for 80% of its total production.

Data are not yet available to determine which companies will lead in exports in 2012 and the percentage of total production that is exported. Overall production is expected to rise by over 20% in 2012 and perhaps even faster in future years judging by the amount auto companies are currently investing in Mexico. Obviously, production levels in 2013 and beyond will be closely tied to demand in the USA and Canada.

Related posts:

Education quality: How do Mexican students compare to those in other countries?

 Other  Comments Off on Education quality: How do Mexican students compare to those in other countries?
Jan 032013
 

Mexico’s future is largely dependent on the quality of future citizens and consequently on the quality of its current education system. The Mexican economy has done quite well in recent years because it has a productive work force that is willing to work for relatively reasonable wages. While China previously had a workforce productivity advantage over Mexico, that advantage has essentially vanished. Therefore, many companies are moving their manufacturing operations from China to Mexico.

The Programme for International Student Assessment (PISA), coordinated by the OECD, evaluates national education systems every three years by testing 15-year-olds in reading, mathematics and science. The most recent assessment in 2009 investigated students in 65 countries, including the mostly high income 34 OECD countries.  (The 2012 results will be released in December 2013).

In 2009, the following countries ranked in the top ten in all three categories (reading, mathematics and science):

  • China: Shanghai (PISA divides China into several sub-national regions)
  • South Korea
  • Finland
  • Hong Kong
  • Singapore
  • Canada
  • Japan

How do Mexican 15-year-olds stack up against students from these other countries?

Within this group, the Mexican students ranked 48th in reading with a score 425. This placed Mexico behind the USA (17th, 500), Turkey (41st, 464), Russia (43rd, 459) and Chile (44th, 449); but ahead of Colombia (52nd, 413), Brazil (53rd, 412), Indonesia (57th, 402), Argentina (58th, 398) and Peru (63rd, 370). We mention the ranking and score of the USA because there has been considerable information published recently about the mediocre quality of its education system. While Mexico’s ranking and score is way behind that of the USA and closer to the bottom of this 65 country sample, it is not really so bad. It is better than that of most other Latin American countries. On the other hand it could and should be better.

The Mexican students did not do quite as well in mathematics. They ranked 50th with a score of 419. This placed them significantly behind the USA (31st, 487) and Russia (38th, 468). Mexico was also below Turkey (43rd, 445) and just behind Chile (49th, 421). As with reading they were ahead of Argentina (55th, 388), Brazil (57th, 386), Colombia (58th, 381), Indonesia (61st, 371) and Peru (64th, 360). Only one country was below Peru, namely Kyrgyzstan (65th, 331). It is important to remember that this sample includes mostly European countries, only one African country, Tunisia; no South Asian Countries, and only two Middle Eastern countries, Israel and Dubai. Mexico would look considerably better if it were compared with all countries in the world.

Mexico did about as well in science as they did in mathematics. They ranked 50th with a score 416. This placed them far behind the USA (23rd, 502) and Russia (39th, 478) and a ways below Turkey (43rd, 454) Chile (44th, 447). As with reading they were ahead of Brazil (53rdh, 405), Colombia (54th, 402), Argentina (56th, 401), Indonesia (60st, 383) and Peru (64th, 369). The data suggest that the scores for each country on reading, mathematics and science are pretty much the same within each country. In other words, the scores on any one of these disciplines tend to be a rather good measure of the overall quality of the education system.

If Mexico is going to compete in the globalized world economy, it must continue to improve its education system. Recent efforts have accomplished a great deal, raising the average amount of schooling of its citizens to 8.6 years. Future efforts should focus as much attention on improving the quality of education.

Related posts:


Which company produces the most motor vehicles in Mexico?

 Updates to Geo-Mexico  Comments Off on Which company produces the most motor vehicles in Mexico?
Dec 292012
 

Back in 2006, General Motors (GM) was the clear leader in production with 493,841 units (just over 25% of the national total). Nissan was second with 411,236 units (21%). These were followed by Volkswagen (VW) – 339,183; Ford – 329,993 and Chrysler – 307,344. The newcomers, Toyota and Honda trailed way behind with 33,835 and 24,297 units, respectively.

By 2011 the picture had changed considerably. All the manufacturers suffered major losses in 2009 as a result of the Great Recession, but all have recovered, some better than others. Between 2006 and 2011, Nissan increased total production by 48%. In 2011, Nissan led all producers with 607,087 units for almost 24% of the national total.

Nissan easily surpassed GM which increased 2006 to 2011 by only 10% for a total of 544,202 units. VW increased by an impressive 50% to 510,041 units. Ford nearly kept pace with an increase of 40% to 462,462 units. Chrysler with merged with Fiat matched GM with an increase of only 10% up to 338,772 vehicles. Toyota upped production by a very significant 47% to 49,596 units. Honda did even better, increasing its production by a whopping 87% to 45,390 units.

Final data are not yet available to determine which companies led production in 2012. Overall production was expected to rise by over 20% in 2012 and perhaps even faster in future years judging by the amount auto companies are currently investing in Mexico. Obviously, production levels in 2013 and beyond will be closely tied to demand which is linked to overall economic growth. Judging from the investment amounts announced so far, it appears that Nissan will retain its lead in total production, with VW and Ford perhaps challenging GM for second place.

Related posts:

Mexican vehicle exports surge back after 2008-2009 recession

 Updates to Geo-Mexico  Comments Off on Mexican vehicle exports surge back after 2008-2009 recession
Dec 202012
 

The Great Recession related to US housing and banking failures in 2009 hit the Mexican vehicle industry very hard. Production in Mexico declined by 28% from 2.10 million units 2008 to 1.51 million units in 2009. This dropped Mexico to 10th in the world. However, production shot up 50% in 2010 to 2.26 million and grew to 2.56 million in 2011 (data from Mexican Automotive Industry Assn.) It is expected to hit 3.1million in 2012. This enabled Mexico to move past Spain and France into 8th place.

Virtually all of this growth has been in the export sector. In 2011, almost 84% of all vehicles made in Mexico were exported. In fact, sales of Mexican made new cars in Mexico dropped from 1.1 million in 2007 to 0.76 million in 2009. It only rebounded to 0.82 million in 2011. It is expected to increase 11% in 2012 to 1.0 million, still lower than the 2007 level.

In 2011, almost 84% of all vehicles made in Mexico were exported. This export percentage clearly suggests that these manufacturers are primarily focused on selling their Mexican made vehicles in the USA and Canada.

Production is expected to continue increasing rapidly in the years ahead as evidenced by the following recent news releases:

Source of data:

Mexican Automotive Industry Assn. “Mexico’s Automotive Production & Exports Hits Record High in November (2012)”  (pdf file)

Related posts:

Nov 012012
 

The recently published Gender Gap Report 2012 indicates that Mexico still has considerable work to do, though its gender gap is closing. The report does not reveal much about the quality of life of females in different countries, rather it focuses on the “gap” between females and males. For example, women in Japan have a relatively high quality of life, but the gap between them and Japanese men is very large. Thus Japan ranks 101st out of 135 countries.

The report ranks Mexico 84th out of 135 countries which does not sound so good. However, Mexico has been moving up in the ranks. It was 89th in 2011, 91st in 2010, 98th in 2009, 97th in 2008, and 93rd in 2007. Mexico’s gender gap score improved throughout the five year period.

Notable countries close to Mexico’s ranking, in the group ranked 80 to 90, are Italy (80), Hungary (81), Greece (82), Bangladesh (86) and Chile (87).

The top ten in the list (smallest gender gap) are the five Scandinavian countries, along with Ireland, New Zealand, the Philippines, Nicaragua and Switzerland. Canada and the USA are ranked 21st and 22nd. Among Mexico’s chief competitors, Argentina is 32nd, Russia is 59th, Brazil is 62nd, China is 69th, India is 105th and South Korea is 108th. The very bottom of the list is dominated by Islamic and many Sub-Saharan African countries.

The report indicates that Europe (including Canada and USA) ranked the highest, followed by Latin America (and the Caribbean), Sub-Saharan Africa, Asia and Pacific, and Middle East and North Africa, a rather distant last. Among 26 Latin American and Caribbean countries, Mexico ranked a relatively low 20th. Clearly, Mexico has a gender gap problem.

The Gender Gap Index is a composite index. It includes four sub-indexes, which are combined to get an overall score which is used to rank countries:

  • economic participation and opportunity
  • educational attainment
  • health and survival
  • political empowerment

In health and survival Mexico ranks a rather surprising 1st tied with 31 other countries. This means that Mexican females are unsurpassed with respect to sex ratio at birth (female/male) combined with female life expectancy (female/male). This is quite impressive. Perhaps males getting killed in drug and other violent activities helps Mexico’s score on this sub-index. Not surprisingly, China ranked 132nd and India at 134th are right near the very bottom.

On the down side, Mexico is ranked 113th in female economic participation and opportunity, though it has improved significantly. This index covers wage equality as well as proportion of female legislators, senior officials and managers, as well as professional and technical workers. Grouped near Mexico are Chile (110th), El Salvador (112th), Guatemala (114th), and South Korea (116th). Perhaps most telling is that female workers only earn 45% of what males do performing similar work. The percentages are worse in some other countries: Korea (44%), Indonesia (42%), Turkey (30%), India (27%), Pakistan (21%) and Saudi Arabia (17%). Less than a third (31%) of Mexican legislators, senior officials and managers are female, compared to 59% in Jamaica, 43% in the USA, 36% in Canada and Brazil, 23% in Argentina and only 10% in Bangladesh, Turkey and South Korea.

In the educational attainment sub-index Mexico ranks 69th. Its index score was just a fraction higher in 2007, when Mexico was ranked 49th. The report indicates that 98% of appropriately-aged females and 98% of males are enrolled in primary school. It shows that 73% of Mexican females are enrolled in secondary school compared to 70% of males. At the tertiary (college) level the percentage is 28% for both genders. These data seem very impressive, but in many other countries there are far more females enrolled than males; for example, in Uruguay the reports says that females lead male enrollments at the tertiary level by 81% to 47%. Despite Mexico’s rank of 69th, Mexico’s so-called gender gap in education does not appear to be a major concern.

Mexico’s political empowerment score improved significantly since 2011 and its rank went from 63rd to 48th apparently because the number of females in ministerial level positions went from 11% up to 21%. Relatively near Mexico are Canada ranked 38th, Australia (42nd), Colombia (51th), Pakistan 52nd),  Israel (54th), USA (55th) and China (58th). We imagine that the rankings of Canada, Australia, Pakistan and Israel were greatly helped because they have all had a female head of state in the last fifty years.

In conclusion, Mexico is making solid progress in closing its gender gap, but there is still plenty of work to be done.

Oct 062012
 

Considerable attention has been focused on Mexico’s obesity problem (see “Soft drinks, obesity, diabetes and public health in Mexico”). Obesity in adults is defined by the World Health Organization (WHO) as a Body Mass Index (BMI) greater than or equal to 30, where BMI is defined as a person’s weight in kilograms divided by the square of his height in meters (kg/m2).

Mexico’s very high adult obesity rate of 30% is increasing every year. It is related to many factors, including increased consumption of processed fat and sugary foods. The average daily calories consumed by Mexican adults increased from 3102 in 1988 to 3266 in 2007.

Rates of "overweight" and "obese" adults in Mexico

Rates of “overweight” and “obese” adults in Mexico

Addressing Mexico’s serious obesity problem will require significant effort and dramatic behavioral change, first and foremost by families, but also by schools, government, industry and civic organizations. Most agree that long term solutions for limiting or reducing obesity should focus primary on children and youth. Obviously physical exercise and diet are crucial parts of a solution. Fortunately Mexico is already making efforts to address its child obesity problem (see “Mexico takes on childhood obesity”).

Obesity is quite complicated and may involve numerous heretofore unknown factors. The data are sometimes confusing. For example, Italian adults, with an obesity rate of only 10%, consumed on average a whooping 3646 calories per day in 2007, 380 more than Mexicans, whose obesity rate is three times that of Italy. (The data in this and the next paragraph come from Table 1 of the Milken Institute’s “Waistlines of the World”, August 2012). French adults consume far more calories than Mexican adults, and more fat the US adults, but their obesity rate is much lower, at only 11%. Furthermore, the French consume 50% more alcohol than Americans and almost three times more than Mexicans and yet they are much thinner. Though adults in Norway consume more calories than Mexicans (3169 versus 3102) their obesity rate is only a third that of Mexico (10% versus 30%). Obviously calorie intake is not the only factor and may not be the most important factor.

Mexican Manuel Uribe, one of the world's most obese individuals, enjoys a snack

Mexican Manuel Uribe (1965-2014), one of the world’s most obese individuals, succeeded in lowering his weight from 560 kg (1233 lbs) to 394 kg (867 lbs).

Obesity is also related to amount of physical activity, but here again the data are confusing. New Zealand adults have a high obesity rate of 27% though they live in one of the physically most active countries, with 49% engaging in “moderate physical activity” defined as light-to moderate activity for at least 30 minutes five times per week. On the other hand, only 27% of the relatively thin Italian adults engage in “moderate physical activity”. Why are obesity rates for the more active New Zealanders so much higher than those for the less active Italians, especially since the latter consume 544 more calories per day (3646 versus 3129)? By way of comparison, only 21% of Mexican and 23% of US adults engage in “moderate physical activity”.

How does Mexico’s growing obesity problem compare that of other countries? Data compiled by the World Health Organization (used by Procon.org to compile “US and Global Obesity Levels: The Fat Chart)”) and the OECD in “Waistlines of the World provide a basis for comparing obesity rates in numerous countries (though see note [1] for reservations about using data from different years).

Country % obese Year of data
Saudi Arabia 35.6 2000
USA 33.8 2008
Egypt 30.3 2006
MEXICO 30.0 2006
Australia 26.4 2007
Canada 24.2 2008
U.K. 23.0 2009
Chile 21.9 2003
South Africa 21.6 1998
Germany 14.7 2009
Colombia 13.7 2007
France 11.2 2008
Brazil 11.1 2003
Italy 10.3 2009
China 5.7 2008
Japan 3.9 2009
South Korea 3.8 2009
Eritrea 3.3 2004
Indonesia 2.4 2001
India 1.9 2008

The data indicate that Mexico ranks 12th of 88 countries with an adult obesity rate of 30%, defined as body mass index (BMI) of over 30. While 12th of 88 does not sound so bad, the top six on the list are small island countries with obesity rates from 41% to 79% (Nauru, American Samoa, Tokelau, Tonga, Kiribati and French Polynesia). Also higher than Mexico are the relatively small countries of Panama and the United Arab Emirates. If these small countries are excluded then Mexico ranks 4th among major countries behind only Saudi Arabia, the USA and Egypt (see table).

Mexico trails several notable countries with high obesity rates between 20% and 30% such as Australia, Canada, UK, Chile and South Africa. (Given that obesity rates are increasing almost everywhere and South Africa’s data are from 1998, its current obesity rate is probably closer to 25% or more.)

The global data suggest that the obesity problem is most serious in Pacific Island nations, North America and the Middle East (including North Africa). It is also becoming a problem in several European and Latin American countries. It is less of a problem in Asia and Sub-Sahara Africa.

In conclusion, obesity is a very serious problem for Mexico today, and arguably one of the biggest problems facing humanity in the 21st century along with climate change and poverty.

Note [1]:

There are some significant differences between the WHO and OECD data sets. For example the WHO data for Mexico are from 2000 while the OECD data are from 2006. For our comparisons we use the most recent data available from the two data sets. Though obesity is an extremely important international problem, reliable data is not collected frequently in many countries. Obesity rates are based on measured height and weight, and are invariably higher than rates based on self reported height and weight. In our table, measured values are used for: the USA, Mexico, Australia, Canada, UK, Japan and South Korea; we are not sure about the rates for other countries.

Update

For an updated post on this topic, with more data, please see: Mexico the 4th most obese country in the world

Sep 292012
 

Industrial exports from Mexico are growing rapidly and diversifying. Some of this growth is coming at the expense of China and other Asian countries. For example, as Adam Thompson reported in the Financial Times, Siemens of Germany recently moved its facilities for assembling high voltage electrical equipment for power substations from China and India to Querétero, Mexico. By next year, most of the 160 parts for this equipment will also be produced in Mexico. Siemens has eight other factories in Mexico and over 6,000 employees. As a result of investments like this, Mexico now exports more manufactured products than the rest of Latin America combined.

It is well known that the USA imports a great deal of manufactured goods from China including toys, electronics, clothing, shoes, etc. But China’s market share of US imports has declined recently, from 29.3% in 2009 to 26.4% to day. On the other hand, Mexico’s market share has increased from 11.0% in 2005 to 14.2%. According to The Economist, “HSBC reckons that by 2018 Mexico will overtake Canada and China to become America’s main source of imports”.

Mexico’s location next to the giant US consumer market is a big factor (see “US firms are near-shoring jobs from China to Mexico”.

It is much faster and cheaper to ship goods from Mexico to the USA rather than from Asia. For example, it usually takes two to seven days from Mexico versus 20 to 60 days from China. Mexico’s locational advantage is particularly important for trendy time-sensitive goods and bulky items. For example, in 2009 Mexico became the world’s leading exporter of flat-screen TVs, surpassing South Korea and China. Mexico is also the leading supplier of smartphones for the US market. Furthermore, as Itizar Gomez Jimenez reports in “Beyond the Refrigerator Door: Success of the Electric Home Appliance industry in Mexico”, most of the large household appliances sold in the USA come from Mexico, including refrigerators, kitchen ranges, dishwashers, microwave ovens, washers and dryers.

Attractive wage rates in Mexico are also a consideration. A decade ago wages in Mexico were roughly four times those in China, but now they are only about 30% higher and the gap is closing (see, “Rising Chinese labor costs: good news for Mexico”). Less red tape under NAFTA also gives Mexico an advantage (see, “Can Mexico’s industry compete with China?”). Mexico is fully committed to globalization. It has free trade agreements with 44 other countries, twice as many as China and four times as many as Brazil. To date, drug war violence has not been a serious constraint to Mexico’s growing manufactured exports.

logo-made-in-mexicoMexico’s maquiladora export industries used to assemble mostly imported parts into finished products for export to the USA. Now, most of the parts are manufactured in Mexico for such industries as electronics, automobiles, appliances and airplanes. (see: “Mexico’s vibrant autoparts sector” and “The reasons why Mexico is fast becoming a key player in aerospace manufacturing). Mexico is also broadening its export market. In 2000, about 90% of Mexico’s exports went to the USA, but now it is down to 80%. Mexico is even exporting manufactured items to China such as the new Chrysler Fiat-500 micro automobile.

While Mexico manufactures products under the names of many foreign brands, it also has its own brands and OEM (original equipment manufacturer) companies that design and build products that are incorporated into foreign branded products. For example, Mexico’s Mabe designs and builds two-thirds of the gas ranges and refrigerators imported into the USA. Furthermore, most of the appliances sold under the General Electric brand in North and South America are manufactured by Mabe. LANIX, Mexico’s largest domestic electronics company, makes desktops, laptops, netbooks, tablets, LCD and LED TV and monitors and smartphones for a range of brand names.

A careful look around a typical household in the USA would reveal that many, perhaps a majority, of the durable manufactured goods would carry a “Made in Mexico” label, including automobiles, flat panel TVs, smartphones, all types of appliances, garden and small power tools, etc. etc.

Sources:

  • Adam Thomson, “Mexico: China’s unlikely challenger.The Financial Times, September 19, 2012 (registration required).
  • Itizar Gomez Jimenez, “Beyond the Refrigerator Door: Success of the Electric Home Appliance industry in Mexico” (pdf file). Cover Feature: Domestic Consume.

Related posts (specific industries):