admin

An overview of Mexico’s indigenous peoples

 Other  Comments Off on An overview of Mexico’s indigenous peoples
Apr 162010
 

How many indigenous people are there?

According to INEGI figures, about six million Mexicans over the age of five speak at least one indigenous language. Another three million Mexicans consider themselves indigenous but no longer speak any indigenous language.

How many indigenous towns or villages exist?

INEGI figures show that, in over 13,000 localities, more than 70% of the population speaks an indigenous language. Most of these localities are small rural settlements with fewer than 500 inhabitants. These settlements are often highly marginalized, with high levels of poverty.

Speaking an Indian language is associated with disadvantage

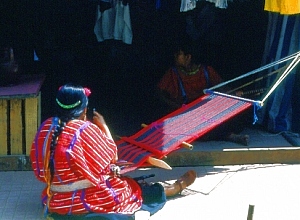
Oaxacan weaver. Photo: Tony Burton. All rights reserved

Speakers of indigenous languages fall way below the Mexican average on almost any socio-economic indicator. For instance, almost 33% of indigenous-speakers are illiterate, compared to a national rate of 9.5%. Females are particularly disadvantaged – indigenous females stay in school a full year less than their male counterparts, and for only half the time that the average non-indigenous female does. Even today, almost 5% of indigenous infants die before reaching their first birthday. A third of indigenous houses lack electricity; more than half do not have piped water.

Where do the indigenous people live?

More than 92% of the indigenous population lives in central and southern Mexico. With the notable exception of the 50,000+ Tarahumara Indians who live in the remote Copper Canyon region of Chihuahua, other indigenous groups in northern Mexico have relatively small populations.

The reason is largely historical. The major pre-Columbian civilizations in Mexico—Maya, Aztec, Zapotec, etc—developed in central or southern Mexico. The north always had fewer indigenous people. The disparity in numbers between north and south was heightened in early colonial times, as Spain expanded its territorial interests in New Spain along two major axes of economic development: the Mexico City-Veracruz corridor (the major trade route linking the capital to the port and Europe) and the Mexico City-Zacatecas corridor (the major route linking the capital to valuable agricultural and mining areas). It is no coincidence that indigenous languages and customs first died out along these corridors, as the indigenous people were forced to become assimilated into the developing dominant culture.

Indigenous peoples and languages did much better in the south. At last count, Oaxaca has over one million indigenous speakers representing more than a third of the state’s population. The state’s largest indigenous linguistic groups are the Zapotec, Mixtec, Mazatec, Chinantec, and Mixe. Oaxaca’s ethnic diversity is celebrated in the annual Guelaguetza festival, normally held in July.

Chiapas has almost as many indigenous speakers as Oaxaca. The largest indigenous groups in Chiapas are the Tzotzil, Tzeltal and Chol. One numerically-small Chiapas group is the Mam. Its recent history is an interesting study in how an indigenous group can re-invent itself in order to survive in the modern world.

The population figures quoted in this post are from INEGI’s Census and II Conteo de Población y Vivienda 2005 (INEGI, Aguascalientes).

Click here for original article on MexConnect

Chapter 10 of Geo-Mexico: the geography and dynamics of modern Mexico is devoted to Mexico’s indigenous peoples. Many other chapters of Geo-Mexico include significant discussion of the characteristics of, and development issues facing, Mexico’s many indigenous peoples.
The least cost business location

 Mexico's geography in the Press  Comments Off on The least cost business location
Apr 152010
 

This table shows the cost of doing business in 10 countries, according to the latest (2010) KPMG guide “Competitive Alternatives” which compares business costs for more than 100 cities. The study uses a compound index of business costs, which includes 26 significant cost components, as well as a variety of non-cost factors such as labor availability and skills, economic conditions and markets, innovation, infrastructure and regulatory environment. It also incorporates personal cost of living and quality of life. The baseline for the scores is the USA which is given an arbitrary score of 100.0.

CountryCost of doing business
(USA = 100)
Mexico81.8
Canada95.0
Netherlands96.5
Australia97.8
UK98.2
France98.3
Italy100.0
USA100.0
Germany102.6
Japan107.6

Mexico clearly offers the lowest cost for business of the 10 countries studied by KMPG with a business cost advantage over the USA of 18.2%.

In fact, in terms of the individual cities studied, Monterrey placed 1st as the most cost-efficient business location (18.5% less expensive than the average of the four largest USA cities—New York, Los Angeles, Chicago and Dallas-Fort Worth), while Mexico City placed 2nd (17.9% less expensive). 3rd place on the list was taken by the Canadian city of Montreal, 4th by Manchester (UK). Vancouver and Toronto occupied 5th and 6th, followed by the least expensive US location for business, Tampa.

Click here for the full report

The geographic center of Mexico

 Other  Comments Off on The geographic center of Mexico
Apr 142010
 

Where is the geographic center of Mexico? Well, believe it or not, Mexico has more than one geographic center. This is why, whenever I’ve been asked this question in the past, I’ve always deliberately fudged my reply.

Several locations lay claim to being the center, but it’s all a question of definition. Does center mean “the point where the minimum distance to the ocean in any direction is as large as possible” or does it mean “the center of mass of the country, located by complicated mathematics or by reproducing its outline on a sheet of cardboard and then balancing it on a pin”? But (I can already hear you cry), that doesn’t take into account where the mountain ranges are!  “Aren’t they heavier than the flat coastal lowlands? Don’t they affect the center of mass?”. In addition, what we’ve said so far fails to take into account the uneven distribution of population in Mexico…

So, there is definitely more than one answer to the original question, “Where’s the center of Mexico?” Let’s take a look at some of the contenders.

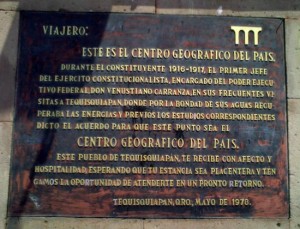
Plaque marking Tequisquiapan's claim to be the center of Mexico

The townsfolk of Tequisquiapan, a spa town in the state of Querétaro, laid early claim to the idea that their town is the center,  erecting a monument to that effect with a plaque that clearly states “this is the geographic center of Mexico”. Hmm… unfortunately, I’ve absolutely no idea why this position could count as the center!

I’ve often been told by well-educated Mexicans that the true center is actually a point in Guanajuato state, very close to (or corresponding precisely with- opinions differ) the Cerro del Cubilete, the prominent steep-sided hill that rises above the interior plains between the cities of Silao and Guanajuato. I’ve never been clear on what basis this point qualifies for the “geographic center sweepstakes”, but the hill certainly does boast a huge religious statue on its top, and is a regular destination for thousands of pilgrims.

Another alternative is offered by the government mapping and statistics organization, INEGI. Maps displayed when the option “Centro geográfico” is selected on one of its web-pages show that a point in Zacatecas is likely to be the center of mass of the country, with the precise location depending on whether only mainland points are used in the calculation, or whether islands are also included. Strictly speaking, the INEGI calculation is based on averaging the furthermost points of Mexico in the four cardinal directions, rather than on a true “center of mass” calculation or demonstration.

The true center of mass has been calculated, according to a brief text by Homero Adame Martínez in Mexico Desconocido (January 2000), to be yet another point in Zacatecas, just south of the village of Cañitas de Felipe Pescador. Most conveniently for all railroad lovers, this point is very close to where the tracks of two major railroads (from Mexico City to Saltillo and Ciudad Juarez respectively) cross.

Readers with a little time on their hands might like to construct their own cardboard cutout of Mexico to determine if the center of mass they determine corresponds with any of these versions. (If you do try this, please post your result in our comments section.) Incidentally, Mr. Adame also relates how the city of Aguascalientes once laid claim to be the center, placing a plaque (sadly no longer there) to that effect on a post in the city’s central plaza…

Well, having explored the issue of “Where’s the geographic center of Mexico?”, let’s end with a related but much simpler to answer question: “What’s on the opposite side of the globe to Mexico?” This is the point where you would eventually emerge if you were able to dig an unbelievably deep hole straight through the center (core) of the earth. If you began digging outside the National Palace in Mexico City, you’d emerge… in the middle of the Indian Ocean, relatively close to the tiny Cocos (Keeling) Islands.

Click here for the original article on MexConnect

The importance of Mexico City’s International Airport

 Excerpts from Geo-Mexico, Updates to Geo-Mexico  Comments Off on The importance of Mexico City’s International Airport
Apr 132010
 

Mexico City’s Benito Juárez international Airport handled 26.2 million passenger movements last year, making it the world’s 43rd busiest terminal, according to the Airports Council International. In terms of flights, Mexico City airport was the world’s 30th busiest, with 366,000 take-offs and landings. For freight, it was the 48th largest in the world, with 376,000 tons of cargo going through it last year. The Airports Council International is a non-profit organization which serves as the “voice of the world’s airports”.

The numbers make Mexico City airport the most important in Latin America. The on-going modernization of Terminal 1 will expand the airport’s capacity to 32 million passenger movements a year. The airport has parking spaces for 6,514 vehicles, and is served by a metro line, city bus lines, and 1,485 licensed taxis (belonging to 7 different companies). The terminal is also served by 8 mid-distance bus lines, offering regular service to the cities of Córdoba, Cuernavaca, Pachuca, Puebla, Querétaro, Tlaxcala and Toluca.

Nationwide, of the roughly 50 million air passengers each year, about half are domestic and half international. Commercial air service started in Mexico in the 1920s. The main route was Mexico City–Tuxpan–Tampico–Brownsville, Texas. By the 1930s, flights were available to Los Angeles, Cuba, Guatemala and El Salvador. Jet services to USA and European cities started in the 1960s. The routes have expanded steadily and now connect Mexico’s 29 national and 57 international airports.

Mexico City’s airport accounts for about 35% of the national total number of passenger movements, followed by Cancún (10.5%),  Guadalajara (almost 9%), Monterrey (7.4%), Tijuana (5.3%) and Puerto Vallarta (Jalisco) and San José del Cabo (Baja California Sur) each with 3.6%.

International comparisons

Mexico averages about 370 air passenger movements per year per 1000 population, compared to 2430 for the USA, 1400 for Canada, 202 for Brazil and 179 for Argentina. While air travel is growing, it remains a distant third behind automobile and bus travel.

Mexico’s transportation systems, including airports, are discussed in chapter 17 of Geo-Mexico: the geography and dynamics of modern Mexico.

Apr 122010
 

Many common garden flowers were developed from samples collected in Mexico by a German botanist financed by Britain’s Horticultural Society.

Karl Theodor Hartweg (1812-1871) came from a long line of gardeners and had gardening in his genes. Born in Karlsruhe, Germany, he worked in Paris, at the Jardin des Plantes, before moving to England to work in the U.K. Horticultural Society’s Chiswick gardens in London. Keen to travel even further afield, he was appointed an official plant hunter and sent to the Americas for the first time in 1836. What was originally intended to be a three-year project eventually became an expedition lasting seven years.

By Hartweg’s time, Europeans already knew that Mexico was a veritable botanical treasure trove, full of exciting new plants. For example, the humble dahlia, a Mexican native since elevated to the status of the nation’s official flower, had already become very prominent in Europe. Mexican cacti were also beginning to acquire popularity in Europe at this time.

The Horticultural Society saw both academic and financial potential in sponsoring Hartweg to explore remote areas of Mexico, and collect plants that might flourish in temperature climes such as north-west Europe.

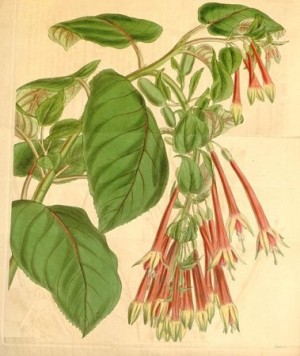
Fuchsia fulgens

Fuchsia fulgens

Hartweg proved to be an especially determined traveler, who covered a vast territory in search of new plants. He collected representative samples and seeds of hundreds and hundreds of species, many of which had not previously been scientifically named or described. Orchids from the Americas were particularly popular in Hartweg’s day. According to Merle Reinkka, the author of A History of the Orchid, Hartweg amassed “the most variable and comprehensive collection of New World Orchids made by a single individual in the first half of the [19th] century”.

Shortly after arriving in Veracruz in 1836, Hartweg met a fellow botanist, Carl Sartorius (1796-1872), of German extraction, who had acquired the nearby hacienda of El Mirador a decade earlier. Sartorius collected plants for the Berlin Botanical Gardens. His hacienda, producing sugar-cane, set in the coastal, tropical lowlands, became the mecca of nineteenth century botanists visiting Mexico.

From 1836 to 1839, Hartweg explored Mexico, criss-crossing the country from Veracruz to León, Lagos de Moreno and Aguascalientes before entering the rugged landscapes around the mining town of Bolaños in early October 1837. In his own words, reaching Bolaños had involved “travelling over a mountain path of which I never saw the like before”, one “which became daily work by the continual heavy rains.” From Bolaños, Hartweg visited Zacatecas, San Luis Potosí (in February 1838) and Guadalajara, where he did not omit to include a detailed description of tequila making. From Guadalajara, he moved on to Morelia, Angangueo [then an important mining town, now the closest town of any size to the Monarch butterfly reserves], Real del Monte, and Mexico City, from where he sent a large consignment of plant material back to England. Hartweg then headed south to Oaxaca and Chiapas en route to Guatemala, Ecuador, Peru and Jamaica. He arrived back in Europe in 1843.

Hartweg visited Mexico again in 1845-46.  After arriving in Veracruz in November 1845, he traversed the country via Mexico City (early December) to Tepic, where he arrived on New Year’s Day 1846, to wait for news of a suitable vessel arriving in the nearby port of San Blas which could take him north to California. In the event he had to wait until May, so he occupied himself in the meantime with numerous botanical explorations in the vicinity, including trips to Ceboruco Volcano. From California, he sent further boxes of specimens back to England, including numerous plants which would subsequently become much prized garden ornamentals. During this trip, he also added several new conifers to the growing list found in Mexico. It is now known that Mexico has more of the world’s 90+ species of pine (Pinus) than any other country on earth. This has led botanists to suppose that it is the original birthplace of the entire genus.

It took several years for the boxes and boxes of material sent back to England by Hartweg to be properly examined, cataloged and described. Many of the samples from his early trip were first described formally by George Bentham in Plantae Hartwegianae, which appeared as a series of publications from 1839 to 1842. Among the exciting discoveries were new species of conifers, such as Pinus hartwegii, Pinus ayacahuite, P. moctezumae, P. patula, Cupressus macrocarpa, and Sequoia sempervirens. Hartweg’s collecting prowess is remembered today in the name given to a spectacular purple-flowering orchid, Hartwegia purpurea, which is native to southern Mexico.

Numerous garden plants derive directly from plants Hartweg sent back to Europe. These included Salvia patens (a blue flowering member of the mint family) which became the ancestor of modern bedding salvias, the red-flowering Fuchsia fulgens, ancestor of a very large number of Fuchsia cultivars, and the red-flowering Zauschneria californica, commonly known as California fuchsia.

Original article on MexConnect

Cartogram of Mexico’s population distribution

 Maps  Comments Off on Cartogram of Mexico’s population distribution
Apr 112010
 

Cartograms are maps in which the sizes of areas (such as states or countries) have been distorted to reflect some numerical value applying to that area. They are a form of topological transformation. To help make the end-product recognizable, the positions of major places are kept as close to their conventional spatial arrangement as possible. Drawing such maps used to be a very time-consuming and trial-and-error process. Only in the last decade or so has it become possible to make such maps using sophisticated computer programs. The most famous cartograms produced to date have emerged from the work of a team at the University of Sheffield in the UK. Their main website includes some fascinating examples of world cartograms portraying everything from tornadoes to tractors and nurses to national savings.

The Sheffield team have also produced population cartograms for individual countries, which offer a unique visualization of population distribution.

text

Cartogram of Mexico's population. © Copyright 2009 SASI Group (University of Sheffield). Used under Creative Commons Licence.

The original cartogram on its original page (a somewhat larger image).

The cartogram offers a striking image of the dominance of Mexico’s three main cities—Mexico City, Guadalajara and Monterrey—and their surrounding areas in the nationwide distribution of population.

The home page of worldmapper.org

The 10 driest states in Mexico

 Teaching ideas  Comments Off on The 10 driest states in Mexico
Apr 102010
 

These are the ten states in Mexico with the lowest annual precipitation totals. Mexico’s six wettest states receive more than twice the precipitation of any of these dry states.

RankStateAnnual precipitation (mm)
1Baja California Sur176.2
2Baja California203.7
3Coahuila326.8
4Sonora421.6
5Chihuahua423.4
6Aguascalientes456.4
7Durango499.0
8Zacatecas517.6
9Querétaro558.2
10Nuevo León602.2

Teaching ideas:

  • Plot these states on a map of Mexico and see if there is any clear pattern to their location.
  • Does their location help to explain why these states receive less precipitation than other parts of Mexico?
  • What other factors, besides location, may help to explain why they are the driest states in Mexico?
  • What are the implications of receiving limited precipitation for economic activities?
  • To what extent does receiving limited precipitation influence a region’s development?

Mexico’s diverse climates are the subject of chapter 4 of Geo-Mexico: the geography and dynamics of modern Mexico. Water availability, rivers, aquifers, water issues and hazards are analyzed in chapters 6 and 7. Buy your copy today!

Mexico tried to prevent Americans from migrating to Texas

 Other  Comments Off on Mexico tried to prevent Americans from migrating to Texas
Apr 092010
 

In recent years, considerable attention has focused on the US government’s efforts to stem the flow of Mexicans migrating north of the border in search of jobs. But there was a time in history when the boot was, so to speak, very much on the other foot.

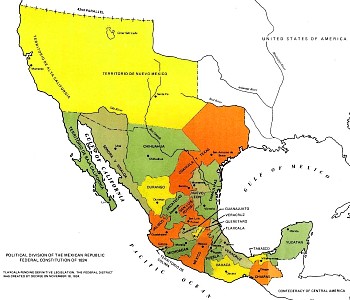
In the early 19th century, shortly after gaining her Independence from Spain (1821), Mexico’s territory extended considerably further north than it does today. It included modern-day Texas, as well as many other parts of what later became US territory.

The first British Chargé d’Affaires in Mexico was Sir Henry George Ward (1797-1860). Ward entered the diplomatic service in 1816, and first visited Mexico in 1823, as a member of a British government commission assessing the desirability of establishing trading relations following Independence. The following year, he married Emily Elizabeth Swinburne, who accompanied him on his return to Mexico in 1825 in his role as Chargé d’Affaires.

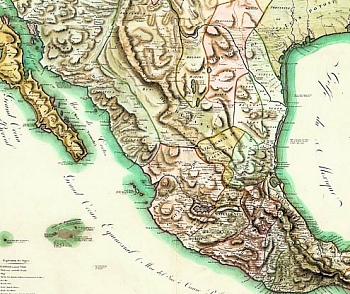
Map of Mexico, 1824

Two years later, Ward wrote a detailed description of how he saw Mexico. Mexico in 1827, which contains illustrations by his wife, was an early appraisal of the fledgling Mexican Republic, and was published on his return to the UK. Ward’s book provides numerous details of trade, mining, economic activity and topography, as well as pointing out many errors in Alexander von Humboldt’s earlier classic work Political Essay on the Kingdom of New Spain (1811).

Ward, a skilled diplomat, arrived only a few months before his American counterpart Joel Poinsett. (Poinsett, after whom the poinsettia is named, was the first US minister to Mexico). Ward was not only anti-Spanish, but also decidedly anti-American. His main goal, apparently, was to try to prevent the USA from expanding its territory at the expense of Mexico. The British diplomat believed that the incorporation of Texas into the Anglo-American states was inevitable unless the Mexican government could stem the wave of immigrants flooding southwards into the region. (How times have changed!)

The Mexican government was relatively unstable at this time, with frequent changes of leaders and some inconsistency in policies. Ward summed up the political situation that he encountered as one in which, after 13 years of civil war, the form of government had still not been determined, with great differences of opinion existing with respect to the desired degree of central authority. He found it difficult to conceive of any country less prepared than Mexico for the “transition from despotism to democracy”.

While both men were acting on behalf of their respective countries, Ward acted as a moderate balance to the interventionist politics of Poinsett. He promoted the signing of a UK-Mexico treaty of friendship, trade and migration, but the UK gradually lost influence in Mexico despite Ward’s best efforts. Meanwhile, Poinsett was trying his hardest to purchase Texas. His meddling in Mexican politics antagonized the government of Vicente Guerrero to the point where his recall was demanded in 1829.

The British Chargé d’Affaire’s greatest concern was that the USA might one day gain control over Texas ports. This would put them only three days away by boat from Tampico and Veracruz (Mexico’s main trading port) and mean that Mexico was vulnerable to invasion. Ward’s worst fears in this regard were realized later in the nineteenth century (the Mexican-American War of 1846-1848).

Original article on MexConnect.

The changing political boundaries of Mexico are described in chapter 12 of Geo-Mexico: the geography and dynamics of modern Mexico. Buy your copy today!

Mexico, Manchester United, and a new soccer stadium in Guadalajara

 Mexico's geography in the Press  Comments Off on Mexico, Manchester United, and a new soccer stadium in Guadalajara
Apr 082010
 

The British soccer (fútbol) giants Manchester United have signed their first ever player from Mexico. Javier Hernández—”El Chicharito” (the Little Pea)—is a 21-year-old striker who has already scored four goals for Mexico in just four games, and is expected to play an important part in Mexico’s World Cup bid in South Africa in the summer. So far this season playing for Guadalajara-based Club Deportivo Guadalajara (better known as Chivas) in Mexico’s Primera División, Hernández has scored 10 goals in 11 matches, an outstanding strike rate, making him joint third in the goal-scoring charts.

And the origin of his nickname “El Chicharito”? Apparently, it comes from his father who was also a Chivas and Mexico soccer player, and whose nickname was “El Chicharo” (‘The Pea). Hernández’s grandfather also played for Chivas.

The deal between Manchester United and Chivas is worth about 9 million dollars. It includes an agreement for Manchester United to play Chivas in Guadalajara in July this year in a friendly game to mark the official opening of Chivas’ new 45,000-seat stadium prior to the start of the 2010/11 season. The new stadium is on the western edge of Mexico’s second city, and was designed by French firm Studio Massaud Pouzet and built by HOK (Mexico-USA).

The geography of soccer is increasingly tied to the forces of globalization. We’ll take a more in-depth look at the geography of soccer in Mexico in future posts.

Cuisine has changed as Mexico has experienced a nutrition transition

 Excerpts from Geo-Mexico, Mexico's geography in the Press  Comments Off on Cuisine has changed as Mexico has experienced a nutrition transition
Apr 072010
 

Mexico has passed rapidly through a “nutrition transition”.

Ingredients for guacamole. Photo: Chef Daniel Wheeler. All rights reserved.

The traditional Mexican diet was based on corn and beans, supplemented by fruits and vegetables with relatively little meat and dairy products. Over a 15-year period the average Mexican ate 29% less fruits and vegetables and 6% more carbohydrates while consuming 37% more soft drinks. In fact Mexicans now enjoy the dubious distinction of being the world’s greatest consumers of soft drinks, downing 160 liters a year on average.

White bread is replacing tortillas, fast food is replacing home cooking.

This nutrition transition, together with a more sedentary lifestyle, fueled a “disease transition”, characterized by a shift from high mortality due to infectious diseases to high mortality from non-communicable chronic diseases.

To see how Mexico compares with other countries—USA, Spain, France,  Japan, Russia, Brazil, South Africa, China and India— in terms of eating habits, see this recent graphical comparison:  New York Times Business section article of April 3, 2010, entitled “Factory Food” Mexico’s per person consumption of vegetables is lower than any other country on the chart except South Africa. Mexico’s consumption of “processed, frozen, dried and chilled food, and read-to-eat meals” is lower than any country except China and India, but Mexicans make up for this with a consumption of “bakery goods” that is more than double that of any other country on the chart.

This post includes edited excerpts from chapter 28 of of Geo-Mexico: the geography and dynamics of modern Mexico. Buy your copy today!

The 10 largest states in Mexico in terms of population

 Other, Teaching ideas  Comments Off on The 10 largest states in Mexico in terms of population
Apr 062010
 

This table shows the ten states in Mexico which have the largest populations. The total population was 112,322,757 in 2010, according to the preliminary results of the 2010 census. These figures may change slightly when the final results of the census are made available.

RankStatePopulation (2010 census)
1State of México15,174,272
2Federal District8,873,017
3Veracruz7,638,378
4Jalisco7,350,355
5Puebla5,779,007
6Guanajuato5,485,971
7Chiapas4,793,406
8Nuevo León4,643,321
9Michoacán4,348,485
10Oaxaca3,801,871

Q. Find these ten states on a map of Mexico [printable map of Mexico in pdf format]. Do the states with the most people also have the largest land areas?

Apr 052010
 

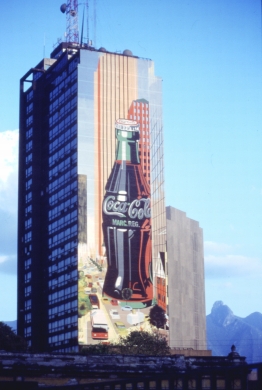
The soft drinks industry in Mexico is big business. Nationwide, there are about 250 bottling plants. Between them they produce some 300 million cases of soft drinks a year, worth about 15.5 billion dollars. The soft drinks industry may bring economic benefits to industrialists, but is is also related to public health issues. Public health experts link the rising consumption of soft drinks and processed foods in Mexico with the rapidly rising rates of obesity, especially childhood obesity, and of diabetes.

Possibly the world's largest Coca-Cola bottle, Monterrey, Mexico. Photo: Tony Burton. All rights reserved

Despite health concerns, the consumption of soft drinks in Mexico continues to rise. The per person consumption of soft drinks in Mexico has reached 160 liters a year. This means Mexico has overtaken the USA to become the world’s leading consumer of soft drinks on a per person basis, according the the Health Commission of Mexico’s Chamber of Deputies. In terms of total volume of sales, Mexico is second to the USA.

The Commission alleges that Mexico has become a “paradise” for food and drink processing firms offering products with little or no nutritive value. Alarmingly, the highest rates of increase in soft drinks consumption are in the poorer parts of the country.

A National Nutrition Survey in 1999 of 23,000 households revealed startling increases in the number of people in Mexico classified as either overweight or obese. These two categories of over-nutrition are measured by calculating the body mass index, a measure of weight adjusted for height. The percentage of women considered obese rose 160% between 1988 and 1999. In 1999 59% of women and 55% of men were either overweight or obese; by 2008 the figures were 64% and 60% respectively. Only the USA has higher rates of obesity. Even more alarmingly, the rate of childhood obesity in Mexico is also increasing rapidly. A 2002 study found that 30% of elementary school children in Mexico City and 45% of adolescents were either overweight or obese.

The increase in over-nutrition has led to rapid rises in diet-related chronic diseases such as diabetes and cardiovascular disease. The overall effects of diseases on a country’s population can be assessed by working out the disability-adjusted life years (DALY), the years of expected life lost through disease or premature death. In Mexico, the DALY lost to diseases normally thought to be more typical of the developed world such as diabetes, heart attacks and strokes is estimated to be three times greater than the DALY stemming from childhood and maternal under-nutrition.

Mexico has the highest rate of diabetes in the world, more than 11%.9 The total number of patients diagnosed with diabetes has risen seven fold since 1990. Diabetes is now the leading cause of death and costs the country more than $300 million annually, one-third of the public health care budget.

This post includes an edited excerpt from chapter 28 of of Geo-Mexico: the geography and dynamics of modern Mexico. Buy your copy today!

Apr 042010
 

Initial reports of the earthquake, which struck at at 15:40 Pacific time, are that the epicenter was about 160 kilometers south-east of Tijuana and that the earthquake occurred at a depth of about 10 kilometers. The shaking was felt in downtown Los Angeles.

Press  reports confirm two fatalities and 100 people injured, as well as considerable damage to some buildings in Mexicali. More than 5000 homes in the rural areas south of Mexicali have been badly damaged. About 25,000 people have received emergency shelter and food and other assistance.

Press reports (latest at the top):

Millions in California, Arizona feel 7.2 quake (AP)

Telegraph.co.uk article about the earthquake

Damage reported from Mexicali – LA Times blog

USGS data on earthquake

USGS – Community earthquake intensity map

Tourism based on major events in Mexico (“concert tourism”)

 Mexico's geography in the Press, Teaching ideas  Comments Off on Tourism based on major events in Mexico (“concert tourism”)
Apr 042010
 

The recent (2010) Elton John concert at Chichen Itza provides an ideal case-study for discussion in geography classes. Events such as this concert are a great starting point for a debate about the benefits and drawbacks of using world-famous archaeological or cultural sites as the setting for concerts by major modern international music stars.

Benefits:

  • $$$ paid directly by event organizers
  • $$$ paid by visiting concert-goers (“concert tourists”?) for hotels, food and transportation
  • free promotion for the site in world press and media

Drawbacks:

  • shows little respect for indigenous (Mayan) culture; the Maya consider the site a ceremonial center
  • many of the $$$ end up outside Mexico in the main offices of multi-national hotel chains and foreign airlines
  • ticket prices of $80—$800 (dollars), which most local residents are unable to afford, make this an elitist event

After those initial suggestions, it’s over to you… Readers are hereby invited to add their own suggestions of other benefits and drawbacks. Please do this via the comments section below this post.  (Click here if the comments section is not currently visible.)

So, what other factors should be taken into account before reaching an evaluation of whether or not such events are a good idea?

What do YOU think?

The first geography field trip guide in Mexico

 Books and resources, Teaching ideas  Comments Off on The first geography field trip guide in Mexico
Apr 032010
 

Despite the popularity of geography in Mexico’s high schools, students are rarely involved in any geographic fieldwork until they reach university. The major exceptions are those students lucky enough to attend one of the international schools offering courses such as the International Baccalaureate (IB) Diploma Programme. The IB geography syllabus requires all students to have undertaken and written up a report on fieldwork. Most IB fieldwork is hypothesis-based.

It is perhaps not surprising therefore that the number of publications relating to fieldwork in Mexico is very small. There have been a limited number of specialist “field guides” published, relating to geology and geography, and coinciding with international conferences.

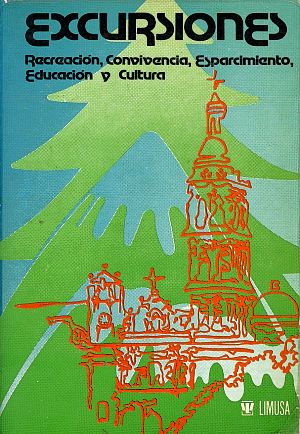
To the best of my knowledge, the first fieldwork guide aimed at high school students, teachers and the general public was written following a meeting of teachers in Mexico City in March 1979. Excursiones was designed to be a guide for “teachers, parents and/or organized groups interested in finding pleasant and educational ways of enjoying our environment and encouraging the spiritual elements inherent in making use of the tourist attractions that form part of Mexico’s heritage.”

The book, published by Editorial Limusa in 1983, has 14 general chapters (clothing, food, first aid, etc), followed by 17 destination specific chapters:

  • Cacahuamilpa
  • Taxco
  • Zempoala
  • Tepoztlán
  • Desierto de los Leones
  • Ruta de la Estrella
  • Valle de Bravo
  • Isla de los Aves-Ocotal
  • El Xinantécatl and its lakes
  • Piedras Encimadas
  • Ruta de los Volcanes
  • Africam Safari
  • El Chico
  • Basalt columns
  • Tolantongo
  • El Xitle and El Ajusco
  • Chapingo-Texcoco

We’ll take a closer look at the opportunities offered for fieldwork in some of these locations in future posts.

Apr 012010
 

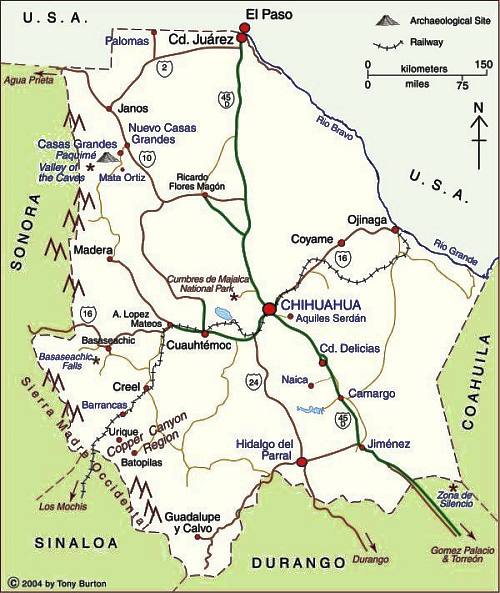
The map shows the state of Chihuahua in northern Mexico. The state capital is the city of Chihuahua (2009 population: 839,000) . Chihuahua is the largest state in Mexico in area: 247,087 square kilometers  (95,401 square miles). The state’s population is 3,422,047 (CONAPO 2010 estimate).

Cd. Juárez is the state’s largest city and Mexico’s 8th largest city with a population of about 1.4 million. In recent years, the city, across the border from the US city of El Paso, has gained considerable notoriety on account of its violence and high murder rate. It also faces air pollution issues, discussed in chapter 23 of Geo-Mexico: the geography and dynamics of modern Mexico.

Map of Chihuahua. Copyright 2004, 2010 Tony Burton. All rights reserved.

The state of Chihuahua has several important tourist attractions, including:

  • the Copper Canyon region (narrower, deeper and longer than the US Grand Canyon) which is home to the Tarahumar Indians, an indigenous group with a particularly distinctive lifestyle. The Copper Canyon and Tarahumar Indians are discussed in chapters 13, 17 and 19 of Geo-Mexico. A world-famous tourist train traverses this region.
  • Mexico’s two highest waterfalls, the Piedra Volada Falls, where the water tumbles 453 meters (1,486 feet) and the Basaseachic Falls, which are  246 meters  (807 feet) in height. The Piedra Volada Falls, which are seasonal, are not shown on this map, but are a short distance north of the Basaseachic Falls.
  • The Casas Grandes area with its important archaeological site
  • Mennonite farming areas; their distinctive landscapes are discussed in chapter 11 of Geo-Mexico
  • Many sites associated with famous revolutionary figure Pancho Villa, including his former 50-room mansion, now a museum, in the state capital

Click here for the interactive version of this map on MexConnect website.

“La Curva de la Gringa”, the American woman’s curve, a place name in Michoacán, Mexico

 Maps, Mexico's geography in the Press, Other  Comments Off on “La Curva de la Gringa”, the American woman’s curve, a place name in Michoacán, Mexico
Mar 302010
 

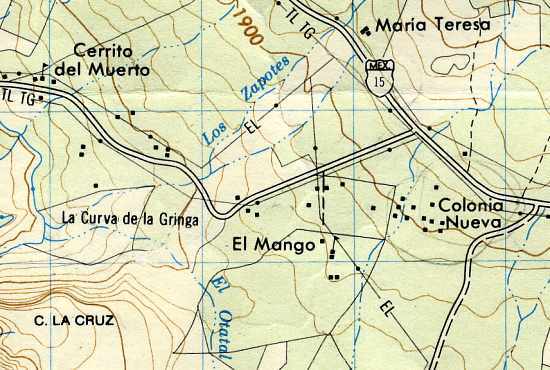
Another interesting example of an unusual place name (following on from an earlier post about unusual place names) is the name “La Curva de la Gringa”, the American woman’s curve.

La Curva de la Gringa is the name of a 90-degree bend near Jungapeo, west of Zitácuaro in the state of Michoacán. Literally translated as “the American woman’s curve”, how did this name come about? The first thing to remember is that all names on maps have to come from somewhere. Detailed maps of Mexico, including the 1:50,000 series, relied initially on aerial (later satellite) imagery, followed by some checking on the ground. Given the expense, ground checking was often relatively limited. However, the on-the-ground surveyors were responsible for adding names to the maps.

La Curva de la Gringa, Michoacán (on Mexico’s 1:50,000 topographic map)

In this case, local informants were apparently unanimous in calling this bend La Curva de la Gringa. Further research shows that this had nothing to do with any purported similarity to the sensuous curve of a gringa‘s breast, but derived from when the road was first paved in the 1950s. Apparently, shortly after the road was finished, an American lady driving her oversized gas-guzzler down to the luxury spa of San José Purua completely missed this bend, and plowed into a cornfield. The locals have long memories!

In 2010, this road is being widened, and sidewalks and street lights installed, all the way from Federal Highway 15 (see map), past La Curva de la Gringa, and as far as the money allocated (currently about 7 million pesos) allows. The first section was due to be inaugurated 21 March 2010. If anyone has an update, please leave a comment. Here’s hoping that no more accidents ever occur along this stretch of road, and that no future place names ever reflect such unfortunate incidents.

Mar 292010
 

To whom do we owe the birth of modern geography in Mexico? To Alexander von Humboldt, the brilliant early-19th century explorer. His visit to the country in 1803-4 helped him amass sufficient data and ideas to publish works which would prove to be a secure foundation for the development, in particular, of physical geography and meteorology.

It is impossible to do justice in these few lines to the brilliance of Friedrich Heinrich Alexander von Humboldt, aptly described by Charles Darwin as “the greatest scientific traveler who ever lived”. He was born in Berlin, Prussia, in 1769 to a very well-connected family.

He studied political economy before turning to science at the University of Göttingen in 1789. One of his friends there, Georg Forster, had been scientific illustrator on Captain James Cook’s second voyage. This friendship undoubtedly reinforced Humboldt’s determination to undertake his own long distance travels. Humboldt systematically prepared himself for a life as a scientific explorer, first studying commerce and foreign languages at Hamburg, then geology and mining at Freiberg, followed by anatomy at Jena, as well as astronomy and the use of scientific instruments.

Detail from Humboldt's 1811 Map.

Humboldt spent five years in the New World, from 1799 to 1804. His visit to Mexico began in Acapulco on March 22, 1803, and lasted until he set sail from Veracruz for the United States on March 7, 1804. In the intervening months, Humboldt measured, recorded, observed and wrote about anything and everything, with remarkable industry and accuracy. He climbed mountains, burned his boots on active volcanoes, descended into mines, recorded geographical coordinates, and collected specimens and antiquities. He also drew a large number of maps, drawings and sketches. Humboldt’s Political essay on the kingdom of New Spain was the first systematic scientific description of the New World. It appeared in 1811, and marked the birth of modern geography in Mexico. His figures and ideas were used and quoted by writers for many many years.

On his return to Europe, he spent more than twenty years, mainly in Paris, writing and publishing his results. The crowning glory of Humboldt’s career was his five-volume Kosmos. Begun at age 76, it turned out to be a masterpiece, proposing conceptual generalizations, supported by the observations of the physical world he had made decades earlier.

Humboldt’s work was the foundation for the subsequent development of physical geography and meteorology. Developing the concept of isotherms allowed climatic comparisons to be made. He recognized that altitudinal differences in climate echoed latitudinal differences. His essay on the geography of plants related the distribution of plant forms to varying physical conditions. Finding that volcanoes fell naturally into linear groups, Humboldt argued that these presumably corresponded with vast subterranean fissures. In addition, he demonstrated the igneous origin of volcanic rocks for the first time.

Humboldt’s work awakened considerable European interest in the Americas and caused many later artists to travel to Mexico to draw and paint.

Humboldt died, at the age of 89, on May 6, 1859. His travels, experiments, and knowledge had transformed western science in the 19th century. Humanist, naturalist, botanist, geographer, geologist: Humboldt was all of these, and more.

A brief extract from Humboldt’s “Political Essay on the Kingdom of New Spain” is included in Tony Burton’s “Lake Chapala Through the Ages, an anthology of travellers’ tales” (Sombrero Books 2008).  This book has extracts from more than 50 original sources covering the period 1530-1910, together with short biographies of the writers, and an informative commentary setting the extracts in their historical context.

Oil in the Gulf of Mexico (Canwest headline writers take note).

 Mexico's geography in the Press  Comments Off on Oil in the Gulf of Mexico (Canwest headline writers take note).
Mar 262010
 

Inaccuracies involving Mexico occur all too frequently in the press. This is the first of an occasional series recording such Mexico-related imprecisions.

Canwest News Service claims to be “the best source in Canada for editorial content because we have more journalists than any other organization.” Maybe its journalists are better than its headline writers.

The evidence? Canwest’s report (20 March 2010) about a recent oil discovery by Shell in the Gulf of Mexico, headlined Mexican oil find ‘significant’. Apparently, Canwest’s headline writers do not realize that much of the Gulf of Mexico is not actually Mexican. A more accurate title for the Canwest story would have been US oil find ‘significant‘.

The USA and Mexico share the Gulf, with periodic arguments about the precise offshore limits of each country’s jurisdiction. A few years ago, it was alleged, probably without foundation, that the USA was already  “sucking the oil” out from joint oil fields that straddled the divide.

What is certain is that the USA has encouraged the development of oil fields in relatively deep water (more than 500 meters deep or 1,640 feet) in the Gulf, which require advanced deep-water drilling techniques, and the expertise of Shell and other multinational oil firms.

However, in Mexico, all oil exploration in managed by state-owned oil giant Petroleos Mexicanos (Pemex). Mexican experts believe that up to 29.5 billion barrels of oil might reside in Mexico’s share of the Gulf, but Pemex has little to show for 7 years of deep water drilling apart from some relatively minor gas finds.

Only a few days before the Canwest story, though, Pemex did announce two  important new finds in shallow waters in the Gulf of Mexico. Ayatzil-Tekel, found in 2008, holds a total of one billion barrels of proven, probable and potential (3P) reserves of super-heavy crude. Tsimin-Xux, found last year, has a similar amount of super-light crude.

Mexico’s total 3P reserves now stand at about 46 billion barrels, which would last more than 40 years at current rates of extraction.

Mar 252010
 

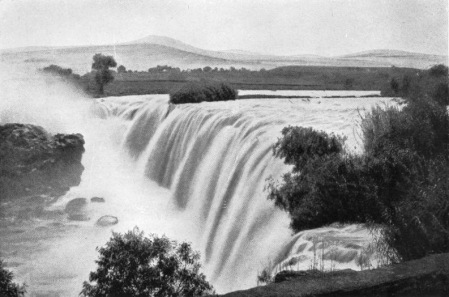
The “Niagara of Mexico” is a natural waterfall on the River Santiago as it winds its way from Lake Chapala to the Oblatos Canyon, the deep ravine which prevents the city of Guadalajara from expanding further northwards.

Juanacatlán Falls, 1909

Between the small villages of El Salto (The Waterfall) and Juanacatlan, 17 kilometers east of the Guadalajara-Chapala highway, is the second biggest waterfall in North America, the biggest being Niagara. A bridge with 24 arches spans the falls and links the two villages. The falls became part of Mexican postal history in 1899.

The Juanacatlan falls are shown as a waterfall of immense beauty, a conclusion echoed by tourist guides of the time which speak of a “magnificent spectacle” and the “majestic falls”.

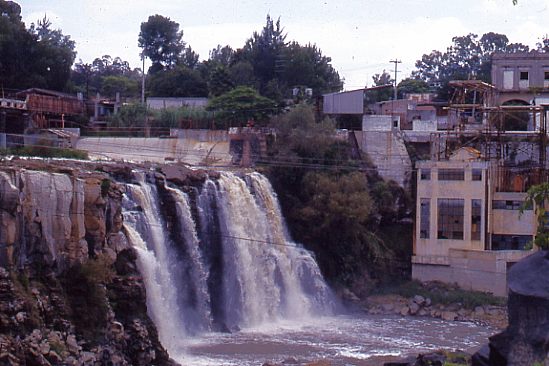
Despite their former fame, the 35-meter-high falls were reduced in the 1980s to a trickle of dirty, evil-smelling effluent from local factories.

Juanacatlán Falls in 1989. Photo: Tony Burton. All rights reserved.

Next to the falls, which at the turn of the 20th century provided hydro-electric power for Guadalajara, now stands the empty shell of a cotton and woolen mill whose wheels were once turned by the falls. Hopefully one day these historic falls will be restored to their rightful place as one of Mexico’s greatest tourist attractions.

Updates:

The text of this post is an edited excerpt from Tony Burton’s Western Mexico, A Traveller’s Treasury (4th edition). All rights reserved.

Mar 242010
 

Update: New Durango-Mazatlán highway officially open (Oct 2013)

Update [October 2012]: Despite earlier claims that the Durango-Mazatlán highway would be completed before the end of 2012, government officials have now confirmed that the highway will not be finished, and will not open, until sometime in 2013.

Update [5 January 2012]:

Original post:

A truly amazing feat of engineering brilliance will force the authors of Geo-Mexico to revise one of their many original maps, when preparing the book’s next edition!

Figure 17.4 of Geo-Mexico is a map using isolines to show the average driving times by road from the city of Durango to everywhere else in Mexico. The map shows that it currently takes about five hours to drive the 312 km from Durango to the Pacific coast resort of Mazatlán, whereas driving south-east for five hours can take you as far as Encarnación de Díaz, 460 km away. The reason for this difference is that the rugged mountains of the Western Sierra Madre separate Durango from Mazatlán, whereas no significant relief obstacles lie between Durango and Encarnación de Díaz.

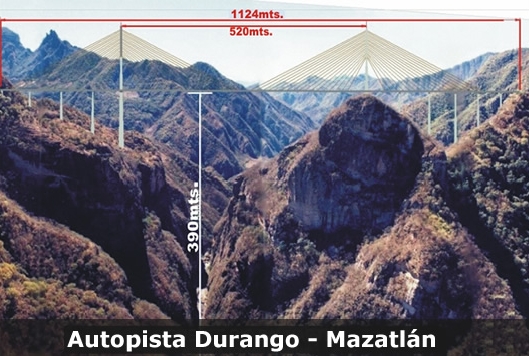
However, this pattern will change significantly once a new 1.2-billion-dollar highway between Durango and Mazatlán is complete. The four-lane, 230-kilometer-long highway is already well advanced; it will greatly reduce the travel time between the two cities. The major ‘missing piece’ remaining to be finished is the Puente Baluarte Bicentenario (Baluarte Bicentennial Bridge).

Puente Baluarte Bicentenario. Photo: TRADECO

This will be the biggest cable-stayed bridge ever built in Latin America. It is 1.124 km long and 4 lanes wide. Its central span extends 520 meters. At its highest point, it is a gravity-defying 390 metres (1280 feet) above the River Baluarte from which it takes its name. The bridge’s largest supporting pillar is 153 meters high, with a base measuring 18 meters by 30 meters.

Construction, by Mexican firm TRADECO, has required 103,000 tons of cement and almost 17,000 tons of steel. The bridge joins the states of Durango and Sinaloa and removes the need for drivers to negotiate a very dangerous stretch of highway known as the Devil’s Backbone.

Meanwhile, the authors of Geo-Mexico are busy preparing a map to show the next best example in Mexico where extreme differences of terrain influence travel times between major cities! Hopefully, the government won’t immediately use the new map in the next edition of Geo-Mexico to decide where to build their next major highway!

The eastern end of Mexico’s largest lake, Lake Chapala, is amputated

 Other  Comments Off on The eastern end of Mexico’s largest lake, Lake Chapala, is amputated
Mar 232010
 

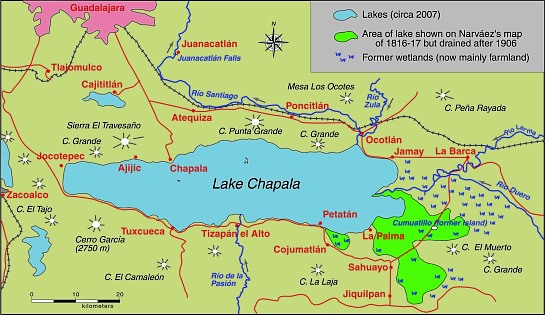
In the 19th century, most of the proposed schemes to change the course or nature of the Lake Chapala area were never carried out. Of those that were implemented, the most significant was the construction in 1883 of the Presa Corona. This dam facilitated the construction of a hydro-power plant at the Juanacatlán Falls. Associated irrigation channels allowed much of the Santiago valley to be farmed all year.

Lake Chapala, showing area drained at start of 20th century. Map: Tony Burton. All rights reserved.

At the eastern end of the lake, farmers had tried several times to gain permanent additional land by draining parts of the lakeshore. Calls for more land, and more control over the position of the edge of the lake were renewed following a drought in 1896, and the very low lake level the following year, when the hydro plant had to be taken out of service for lack of water. Engineers decided to build a dam at Poncitlán to regulate the River Santiago and conserve water in times of plenty.

A few years later, in 1904, very high floods following the rainy season made landowners even more unhappy. The inauguration of the Poncitlán dam in 1905 ironically meant that water levels remained high each year for longer than usual in the much-coveted eastern marshes. In several places, including Jamay and La Palma, local landowners constructed dykes to prevent the water from covering their fields. Levées were built along the Lerma and its tributary the Duero.

Manuel Cuesta Gallardo, a native of Guadalajara, had a much bolder vision, which reflected how successfully Europeans had increased their areas of farmland through drainage and reclamation schemes. He convinced President Porfirio Díaz to award him a concession for the 50,000 hectares of land that would be gained by constructing an 80-kilometer-long earth bank from La Palma to Maltaraña, to completely amputate the eastern end of the lake, the area known as the Ciénega of Chapala. The scheme, designed by engineer Luis P. Ballesteros, also involved digging major drainage channels. All the work was done by hand. By 1908, the work was complete.

The following year, disastrous floods overwhelmed the earth banks, destroyed bridges and wrecked crops. Further floods in 1913 caused further damage, but all the dykes were rebuilt by the following year. While the scheme has certainly not prevented occasional flooding, it has increased the agricultural area in the region. But at what cost? Critics say that the delicate ecological balance of the lake was destroyed for ever. The marshland’s natural sponge-like ameliorating effect, soaking up excess rainfall to make it available again in times of drought, was gone for good.

The hydrology of Lake Chapala is discussed in chapters 6 and 7 of Geo-Mexico: the geography and dynamics of modern Mexico. A case study of ‘residential tourism’ in the villages on the northern shore of Lake Chapala is discussed in chapter19. Lake Chapala was recently declared an Internationally Important Wetland by the Ramsar Convention, joining a large global network of similarly important wetland sites. The 13th International Living Lakes Conference is being held in Chapala, March 22-25, 2010.

This is an edited excerpt from Tony Burton’s Lake Chapala Through the Ages, an anthology of travelers’ tales (Sombrero Books 2008)

Mexico’s North-South economic divide weakens slightly in 2009

 Mexico's geography in the Press, Updates to Geo-Mexico  Comments Off on Mexico’s North-South economic divide weakens slightly in 2009
Mar 222010
 

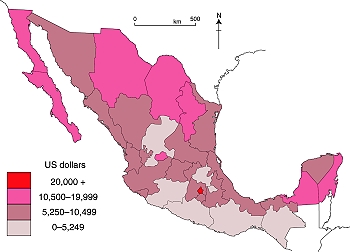
The rapid rates of economic growth in recent decades in the north of Mexico has led to a pronounced economic north-south divide, mapped and analyzed in some detail in chapter 14 of Geo-Mexico: the geography and dynamics of modern Mexico.

GDP/person in Mexico, 2007 (Color version of Fig. 14-3 of Geo-Mexico). All rights reserved.

In 2009, this divide weakened slightly. However, this was not so much a case of the south catching up but more a case of the north stumbling in its progress, due to its heavy reliance on economic ties to the USA.

Northern border states, where manufacturing is important, saw their GDP fall by more than 10% on average during 2009, according to Banamex’s Regional Economic Activity Indicators (Indicadores Regionales de Actividad Económica), published in mid-March. This decline in GDP was accompanied by a fall in employment and also by a significant fall in remittances sent home from Mexican migrant workers in the USA. It should be remembered, however, that these states all experienced marked rises in their GDP in the years immediately prior to the worldwide economic downturn.

No fewer than 29 of Mexico’s 32 states (counting the Federal District as a state for simplicity) saw their GDP decline in 2009. Only 3 states—Zacatecas, Chiapas and Oaxaca—bucked the trend and saw a rise in their GDP in 2009. In the state of Zacatecas GDP grew 1.6% (helped by a resilient construction sector), in Chiapas 1.1% and in Oaxaca 0.8%. It is noteworthy that none of these three states is particularly well integrated into the global economy. As a result, what was happening outside Mexico’s boundaries had little effect on their economic progress.

The list below gives the % change in GDP during 2009 for a sample of states, alongside the national average for comparison:

Zacatecas           + 1/6%
Chiapas               + 1.1%
Oaxaca                + 0.8%

State of México       – 5.6%
Jalisco                     – 6.0%
Federal District       – 6.4%
Querétaro               – 6.3%

National average    – 6.7%

Tamaulipas            – 7.8%
Nuevo León           – 9.3%
Baja California        -10.5%
Chihuahua              -13.6%
Coahuila                -14.4%

Reducing pollution from the making of corn tortillas

 Mexico's geography in the Press  Comments Off on Reducing pollution from the making of corn tortillas
Mar 202010
 

The traditional way of turning corn (maize) into tortillas pollutes large volumes of water and uses copious amounts of energy. Researchers at the biotechnology department of the Autonomous Metropolitan University of Mexico (UAM) are developing a greatly improved “greener” way of  making tortillas.

Tortilla-making. Photo: krebsmaus07 (Flickr)

Tortillas cost less than a dollar a kilo in Mexico, but price rises for corn (and therefore tortillas) in recent years have caused the consumption of tortillas to fall to about 80 kg per person each year. According to the National Institute of Nutrition, tortillas account for about 45% of all the  calories consumed in Mexico.

Conventional tortilla mills cook the corn in a solution of calcium hydroxide (limewater) and then ground it into a dough. The process, known as nixtamalization, was originally developed in pre-Hispanic times. A ball of dough is then flattened into a round which is cooked on both sides on a hot comal to produce a tortilla. Residue from the nixtamalization proces contains starches, cellulose and calcium and is discarded into local drains.

About 54% of all the tortillas consumed in the country are made this way. The remainder come from a ground corn-flour mix to which water must be added to form a dough, marketed by giant commercial producers such as Maseca and Minsa.

Processing a single kilogram of corn for tortillas the conventional way requires two liters of water. There are 20,000 corn mills in Mexico; each one can pollute more than 1,000 liters of water every day. The UAM researchers were able to reduce pollution by conventional mills by 80% simply by introducing a more efficient filtering system for the cooked mass, allowing more dough to be extracted.

The researchers have now turned their attention to energy usage. Using solar energy to help heat the water should reduce the amount of natural gas required by as much as 40%. This could save mills a considerable amount of money. Each mid-sized mill (supplying dough to an average of 10 tortilla factories) spends about 2,300 dollars a month on energy.

Earliest landscapes on Mexican postage stamps

 Other  Comments Off on Earliest landscapes on Mexican postage stamps
Mar 192010
 

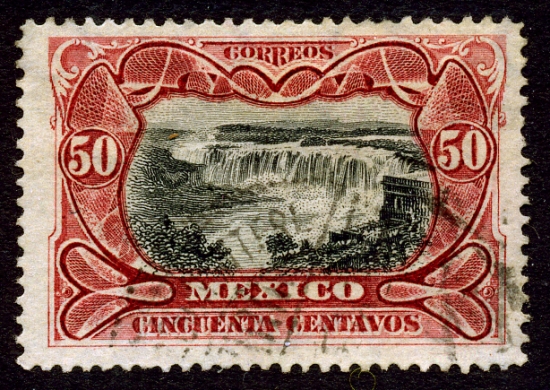
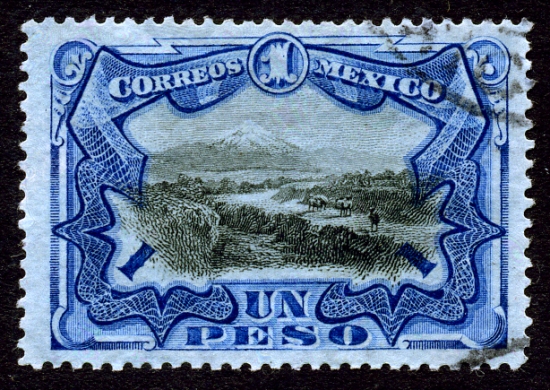
The earliest landscapes to be depicted on Mexican postage stamps were in 1899. The set included these magnificent images of The Juanacatlán Falls, popularly known as the “Niagara of Mexico”, on the 50 cent stamp, and of Popocatapetl volcano on the 1 peso stamp.

The Juanacatlán Falls are on the River Santiago, shortly after it leaves Lake Chapala on its way to carve the deep Oblatos Canyon on the northern edge of Mexico’s second city, Guadalajara. In 1899, these falls were considered to be the second largest waterfall in North America (in terms of volume of flow) after Niagara Falls. A bridge with 24 arches spans the falls and joins the villages of Juanacatlán and El Salto (The Waterfall).

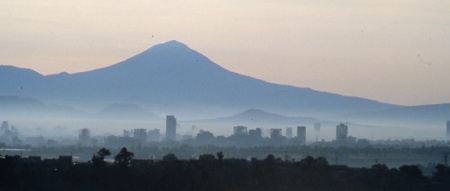
There are two major volcanoes near Mexico City. The first is the still active Popocatepetl (“Popo”), which rises to 5500 meters (18,045 feet) and is shown on the 1899 1 peso stamp. Alongside it, the dormant volcanic peak of Iztaccihuatl is 5220 m (17,126 ft) high. Both are clearly visible from Mexico City on a smog-free day. The southern suburbs of Mexico City are overshadowed by a third, smaller volcano, Ajusco, which reaches 3930 m (12,894 ft).

These beautiful 1899 stamps, designed and printed in the UK, are considered to be among the gems of Mexican philately.

Mexico’s many volcanoes are discussed in chapter 2 of Geo-Mexico: the geography and dynamics of modern Mexico.  Water issues are examined in chapter 7, and environmental trends and issues are the subject of chapter 30.

Mar 172010
 

Geo-Mexico looks in some detail at air quality issues in several Mexican cities, focusing on trends in carbon monoxide, ozone and microparticulates (PM10) from 1995-2008. Among other things, it concludes that,

“As a result of aggressive government efforts, the quality of air in Mexico City has improved significantly. Since 1990 the number of hours that air pollution exceeded the city’s quality standard has declined by about two-thirds. Ozone continues to be a problem as do minute particulates under 10 microns (PM10), both of which can have serious health consequences.”

Mexico City air quality in 1980. Credit: Tony Burton

In the two years since 2008, the trend towards improvement of the air quality in Mexico City has continued according to this article which has appeared in numerous newspapers including the online version of The Independent, a UK daily.

That is very good news indeed. Hopefully air quality in all Mexico’s major cities will improve over the coming decade. When last we looked, Monterrey’s air pollution statistics were still headed in the wrong direction.

The Irish may be everywhere, but mainly due to a Mexican water mold

 Other  Comments Off on The Irish may be everywhere, but mainly due to a Mexican water mold
Mar 172010
 

During the Irish potato famine more than one million people died of starvation when their staple crop failed, and many of those who survived were forced to emigrate. This tide of emigration carried many Irish people to North America, particularly to the north-east of the USA.

How did the potato famine come about? The census of 1841 in Ireland recorded a population of about 8 million. This figure was a staggering 300% more than sixty years earlier. The staple Irish food at that time was the humble potato and Ireland’s rapid population growth during the early part of the nineteenth century was based on the so-called “potato economy”.  Ireland was bursting at the seams in 1841, but just a decade later, after the potato famine, the population had fallen to 6.5 million and by 1900 to around 4 million.

And where does a Mexican mold come in? The cause of famine was a water mold (Phytophthora infestans) that originated in Mexico. This fungus-like mold results in a disease called “late blight” in which entire fields of mature potato plants are destroyed within days. The name “late blight” is because the mold strikes late in the growing season, close to harvest time. Infected tubers are subject to soft-rot bacteria which render them useless as food. What is worse, the discarded rotting tubers can easily re-infect the succeeding year’s crop.

One kind of late blight mold, A1, crossed the Atlantic in the 1840s, reaching Europe in 1845 before rapidly spreading across the continent to reach Ireland. Although cultivated potatoes (Solanum tuberosum) originated in Peru, the late blight mold appears to have originated in the Toluca Valley of Mexico (adjacent to the western edge of Mexico City) where it is found in several related wild-growing Solanum tubers.

After the Irish potato famine, farmers learned to control the A1 mold through careful fungicide applications and by choosing varieties that had some resistance to late blight and planting only healthy tubers.

Since the 1980s, however, farmers are once again fighting late blight as the direct result of the escape of a second kind, A2, into the cultivated potato population. The problem stems from the fact that A1 and A2 can reproduce sexually, with the potential to have offspring that are strains with greater virulence or increased resistance to fungicides. Having two different kinds of late blight as parents greatly magnifies the genetic variability available for future generations of the mold .

The A2 mold first appeared outside Mexico in the 1970s and has already spread with serious economic consequences to the Middle East, Africa and North and South America. It seems almost certain that it will eventually also disrupt harvests in India and in China, the world’s largest potato producer. The A2 mold is considered the most important threat to potato cultivation worldwide. The current response of hitting it with higher and more lethal doses of fungicide is not in line with public demands for greener farming methods.

How did the A2 mold escape from Mexico? It was probably unintentionally carried by potatoes exported to Europe during the winter of 1976-77. Europe needed potatoes because a drought a year earlier had reduced its potato yields significantly. Unrecognized, the mold was then re-transported in seed potatoes throughout Europe and to the Middle East and Africa.

Scientists are studying wild potatoes in the Toluca Valley in an effort to try and identify precisely which gene or combination of genes provides these particular wild potatoes with some degree of defense against the worst ravages of the mold. Mexico’s main center for potato research is the Agricultural University at Chapingo, near Texcoco, on the eastern edge of Mexico City. The University is well worth a visit – if only to admire the magnificent Diego Rivera murals, including one of the world’s great nudes.

Happy St. Patrick’s Day, wherever you may be!

This is an edited version of an article originally published on MexConnect – Click here for the original article

Mexico’s innumerable links (economic, social, demographic and cultural) to the world are relevant to many chapters of Geo-Mexico: the geography and dynamics of modern Mexico.

Mar 162010
 

In earlier posts, we’ve taken a quick look at typical Spanish-language place names (toponyms) and also some common indigenous place name elements. But what about those place names that do not match any of the expected categories?

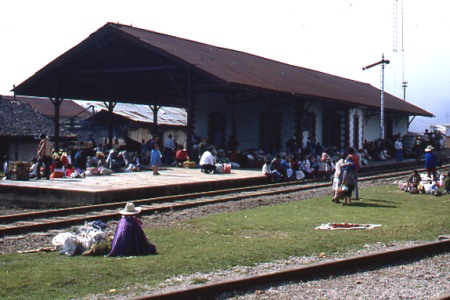
Honey Railway Station (dating from 1908)

My personal favorites in this category include the railway stations of Honey in the state of Puebla (named for a famous railroad engineer) and Wadley in the state of San Luis Potosí. The latter is particularly strange since the letter w does not belong to the Spanish alphabet. I’ve never been able to identify the origin of the name Wadley with any certainty, but for one possible explanation, see Mexico has many “Est”raordinary railway places.

Wadley Railway Station in San Luis Potosí

Another example of an unusual name is that given to one of the sharpest curves on the Mexico City to Cuernavaca highway — La Curva de la Pera, which means “The Curve of the Pear”. The derivation of this name for a bend in the road that loops back on itself is fairly self-evident. Here’s hoping that your vacation after navigating past this bend does not end up being similarly “pear-shaped”!

Many similar instances of how names were allocated, and examples where place names proved critical to legal issues, are given in Raymond Craib’s excellent “Cartographic Mexico, a history of state fixations and fugitive landscapes” (Duke University Press, 2004). This is a perceptive study of the relationships between history and geography in Mexico from the mid-19th century until about 1930. Craib emphasizes the significance of map-making in post-Independent Mexico as a means towards furthering nationalism and as a development tool. He also traces the changing motives of map-makers, focusing especially on the key area of Veracruz-Puebla which served as Mexico’s main gateway to Europe for centuries. One case study examines a mining area where the granting of water rights hinged on precisely where a particular river flowed, and which tributary was which. This proved to be a case where cartographic ‘proof’ was impossible to find, and a pragmatic solution was required.

For a more complete explanation of some of Mexico’s place names, see “Mexico’s place names and their meanings” on MexConnect.

First map of Mexico on postage stamp

 Maps, Other  Comments Off on First map of Mexico on postage stamp
Mar 142010
 

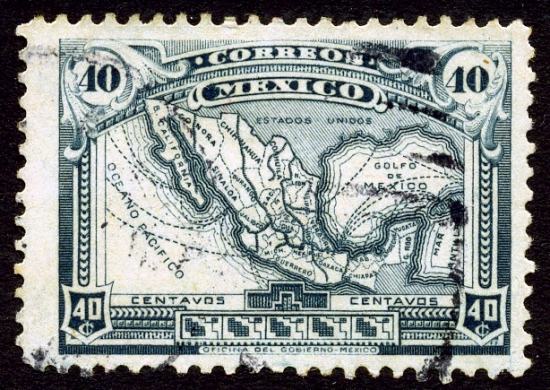
It was not until 1915, in the middle of the Mexican Revolution, that a map of the Republic appeared for the first time as the central design on a Mexican postage stamp.

Most states were named, though abbreviations were necessary given the size of the stamp. In 1915, though, the state of Nayarit on the Pacific Coast, north-west of Colima did not yet exist. It came into being in1917, with the signing of Mexico’s Constitution (the one which is still currently in force). Baja California, shown as single entity on the map, was divided into northern and southern sections in 1931.

In addition to the states, the map shows the main railway lines and also the main shipping routes. In 1915, the easiest way to reach the Yucatán Peninsula was by boat. It would be another 35 years or so before a rail link was completed between Veracuz and Merida. International shipping routes were very important in 1915, since air travel was in its infancy.

The map take some artistic license with scale. In particular, the island of Cuba has been brought much closer to the north-eastern tip of the Yucatán Peninsula than it really is.

The historical evolution of the boundaries of Mexico, and of its individual states, are analyzed in chapter 12, “The changing political map of Mexico” of Geo-Mexico: the geography and dynamics of modern Mexico. The development of Mexico”s railway lines is discussed in detail in chapter 17.

Mexico’s richest individuals in 2010

 Mexico's geography in the Press, Updates to Geo-Mexico  Comments Off on Mexico’s richest individuals in 2010
Mar 122010
 

The Forbes magazine list of the world’s richest individuals in 2010 consists of 1011 individuals, each with a wealth of one billion dollars or more. Nine Mexicans (all men this year) made the list. The nine richest Mexicans are:

World rank / Name / Estimated wealth according to Forbes / Main business interests

#1 Carlos Slim Helú, 53.5 billion dollars, making him the richest man in the world. Fixed line telephone provider Telmex, cell phone provider América Móvil, Grupo Carso, Inbursa

#63 Ricardo Salinas Pliego, 10.1 billion dollars. Television company Televisón Azteca, domestic appliance store Elektra, bank Banco Azteca,
and cell phone company Iusacell

#72 Germán Larrea, 9.7 billion dollars. Grupo México – mining for copper and other minerals

#82 Alberto Bailleres, 8.3 billion dollars. Mining giant Peñoles, department store El Palacio de Hierro and Grupo Profuturo

#212 Jerónimo Arango, 4 billion dollars. Founder of Aurrerá supermarket chain and Grupo Cifra which controlled VIPS and El Portón restaurant chains, Suburbia department stores and tourist developments in Baja California Peninsula and Acapulco

#655 Emilio Azcárraga, 1.5 billion dollars. Television and media conglomerate Televisa,and Nextel cell phones

#828 Roberto Hernández, 1.2 billion dollars. Banker, one of main shareholders of Citigroup, and tourist developments in the Yucatán Peninsula

#937 (equal) Alfredo Harp Helú, 1 billion dollars. Shareholder in Citibank, telecommunications firm Avantel

#937 (equal) Joaquín Guzmán Loera (aka “El Chapo”), 1 billion dollars. Mexico’s most wanted man, head of the Sinaloa drugs cartel, the main supplier of cocaine to the US market

The combined total wealth of these 9 individuals is a staggering 90.3 billion dollars, equivalent to almost 6% of Mexico’s GDP.

The average earnings of Mexican workers registered in IMSS (Mexico’s Social Security Institute) is about 220 pesos a day or $6,300 (dollars) a year. The combined wealth of Mexico’s nine richest individuals is therefore equivalent to the total annual salaries of 14.3 million Mexicans earning this average salary!

Clearly, there are a handful of extremely wealthy individuals living in Mexico, alongside millions of Mexicans who are living at or below the poverty line. These income disparities have existed for a very long time, and are examined in detail in chapter 14 of Geo-Mexico: the geography and dynamics of modern Mexico. That chapter also analyzes the spatial patterns of wealth in Mexico, and discusses whether the gap between rich and poor has widened or narrowed in recent years.

Chapter 29 discusses Gender inequities in Mexico and  Oportunidades, a poverty reduction program (both links are to excerpts from that chapter).