Which states in Mexico are the most competitive in business terms?

 Books and resources, Teaching ideas  Comments Off on Which states in Mexico are the most competitive in business terms?
Nov 012010
 

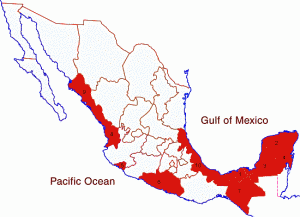
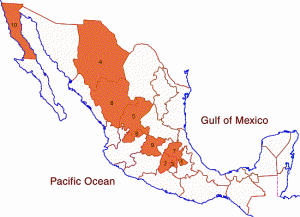
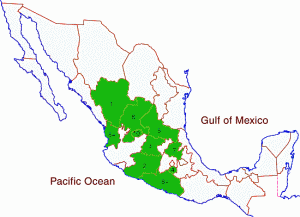
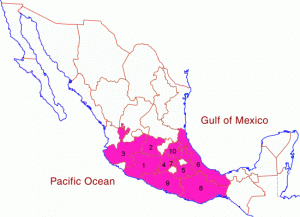
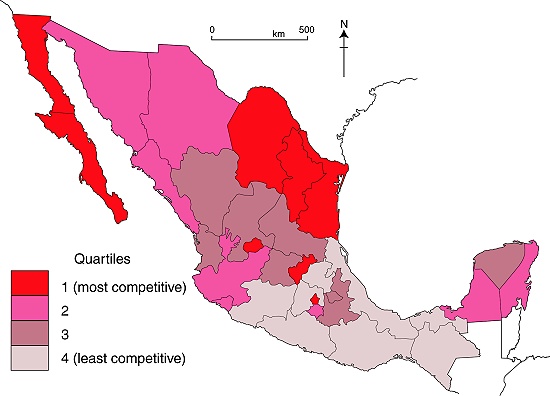
A recent report from the Mexican Institute for Competitiveness (Instituto Mexicano para la Competitividad, IMCO) provides some interesting insights into which areas of Mexico are “most competitive” in business terms. The latest report relies on 2008 data. The IMCO Competitiveness figures are usually compiled for a major urban area or a state, and international comparisons are also possible at the country level. For example, IMCO found that Mexico ranks 31st in the world for competitiveness, immediately behind Brazil, but ahead of China (rank 38). Mexico’s basic pattern of competitiveness at the state level is shown in the map.

IMCO defines competitiveness as the capacity to attract and retain investment and talent. This suggests a business environment that maximizes the socio-economic potential of both the business entities and individuals residing in a a specific area. It also suggests that any improved well-being (economic and social) will be maintained (sustained).

Map of competitiveness in Mexico, 2008

Competitiveness in Mexico, 2008. Map: Tony Burton; all rights reserved

The IMCO index of competitiveness is based on 120 key variables, grouped into 10 major factors affecting competitiveness. All the variables must be ones which are regularly updated and easy to interpret, with transparent methods of calculation. The 10 major factors include the reliability and objectivity of the legal system, the sustainable management of the natural environment, the stability of macroeconomic policies, the degree to which society is non-divisive, educated and healthy, and the stability and functioning of the political system.

  • Using the map above, how would you describe the pattern of competitiveness in Mexico? (north/south? coastal/inland?, proximity to the USA?)
  • Does the pattern of competitiveness match the pattern of GDP/capita? In what way is the State of Mexico an anomaly in this regard? Are there other anomalies?

A full analysis of why some states are more competitive than others is beyond the scope of this post. However, given its relevance to geographers, we will examine the specific variables that make up the sustainable management of the natural environment in a future post, when we will also take a look at the trends for that indicator.

Mexico’s economy and workforce are analyzed in chapters 14 to 20 of Geo-Mexico: the geography and dynamics of modern Mexico. Ask your library to buy a copy of this handy reference guide to all aspects of Mexico’s geography today! Better yet, order your own copy…

Sep 152010
 

The remote Copper Canyon region in northern Mexico is the home of 50,000 Tarahumara Indians who have preserved much of their distinctive culture (language, dress, customs, beliefs) into this century, partly because of their extreme remoteness. Many live untouched by the trappings of modern civilization, moving between caves just below the canyon rim and warmer, winter shelters at lower altitude near the Urique River.

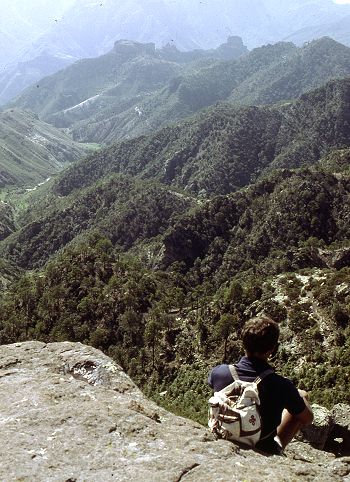
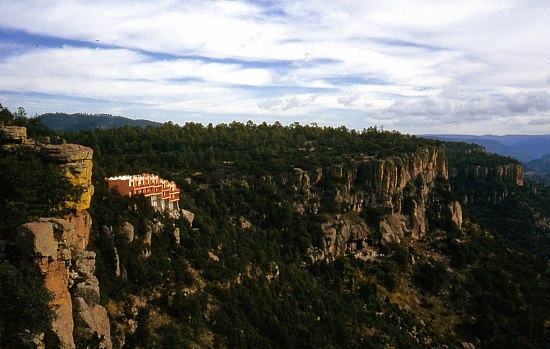
Modern hotels are encroaching on the Copper Canyon

Modern hotels are encroaching on the Copper Canyon, and changing the views in this wilderness region. Photo: Tony Burton; all rights reserved.

Their radically different lifestyle and extreme isolation beg many questions. Their ancestral homelands are already being invaded by marijuana-growers and trampled on by outside developers who have very different notions of property rights and very different customs.

Questions to think about:

  • Are the Tarahumara Indians really in any position to make informed decisions about their future?
  • Should we leave them entirely alone and let them decide entirely for themselves?
  • Should we offer education about what we would consider the benefits of the modern world?
  • Should we improve their access to health services and hospitals?
  • Should we encourage them to acquire computers and internet access?
  • Might these progressive elements destroy their existing lifestyle, break down their social and political structures and ultimately wipe them out?
  • What do YOU think? Now, imagine you were a Tarahumara Indian – would you think the same?
  • Who should decide the future of this region?

Previous Geo-Mexico posts related to the Copper Canyon:

Chapter 10 of Geo-Mexico: the geography and dynamics of modern Mexico is devoted to Mexico’s indigenous peoples, including the Tarahumara Indians. If you have enjoyed this post, please suggest to your local library that they purchase a copy to enhance their collection.

Cultural and eco-tourism in the Copper Canyon region of Mexico

 Other, Teaching ideas  Comments Off on Cultural and eco-tourism in the Copper Canyon region of Mexico
Sep 102010
 

The Copper Canyon area is one of Mexico’s most popular destinations for eco-tourism activities. The canyons offer plenty of opportunities for canyoneering (like mountaineering, but starting from the top!), wilderness hikes and adventure trips. Mexico’s two highest waterfalls—Piedra Volada and Baseaseachi— are also in this area. The Basaseachic Falls are about 250 meters (820 ft) in height, beaten only by the virtually inaccessible 453-meter-high Piedra Volada falls, also in the state of Chihuahua. The Basaseachic National Park is easily accessible via paved roads from Chihuahua City.

Magnificent scenery attracts hikers from all over the world.

Magnificent scenery attracts hikers from all over the world. Photo: Tony Burton; all rights reserved.

Adding to the allure of the Copper Canyon region is the fact that it is the home of some 50,000 indigenous Tarahumara Indians with their distinctive language, customs and lifestyle. The Tarahumara are one of the most culturally distinct groups in all of Mexico, famous especially for their long distance running ability and communal spirit.

Relatively easy access to this region is possible because of the railway line which runs from Chihuahua City to the lumber town of Creel, close to the canyons, and then skirts the canyon rim before descending to El Fuerte (once the capital of Arizona) and Los Mochis in Sinaloa. This railway is an incredible feat of engineering brilliance, matched by few railway lines anywhere on the planet. The railway is the lifeline of this remote region.

Travel articles:

Tourism in this area is not without its discussion points. Tourists place more pressure on scarce resources such as potable water. As noted in an earlier post, tourism has led to changes in the items made by indigenous Tarahumara women. Some hotel developers have viewed the Tarahumara as a human resource to be exploited as a quaint experience for their clients, though others have quite rightly viewed the Tarahumara as the area’s most important assets, one to admire and appreciate for what they are and how they have adapted to the harsh environment in which they live.

Points to ponder (discussion topics in class):

  • Should tourists encourage a monetary economy by buying Tarahumara souvenirs?
  • Is there a risk of tourists introducing a disease to which the Tarahumara have no resistance?
  • Should tourists be allowed to pick flowers and collect souvenir rock samples in the Copper Canyon area?
  • What are the pros and cons of tourists giving small items such as T-shirts to the Tarahumara?
  • What items, if any, are appropriate for tourists to offer the Tarahumara if they wish to give them something for sharing their ancestral homeland?
  • Is it right to take photos of Tarahumara homes, such as their cave dwellings?

Previous Geo-Mexico posts related to the Copper Canyon:

Chapter 10 of Geo-Mexico: the geography and dynamics of modern Mexico is devoted to Mexico’s indigenous peoples, including the Tarahumara Indians. If you have enjoyed this post, please suggest to your local library that they purchase a copy to enhance their collection.

The distinctive sounds of Mexico’s towns and cities

 Mexico's geography in the Press, Teaching ideas  Comments Off on The distinctive sounds of Mexico’s towns and cities
Aug 312010
 

Geographers have long been interested in the distinctive contribution of sounds to landscapes, especially urban landscapes. Some sounds are associated with pleasure, some with danger, others with impatience. The soundscapes of cities have become a legitimate area of study.

Early work tended to focus on traffic noise or on identifying areas where ambient noise from industry or other activities exceeded a comfortable threshold volume.

Soundscapes vary from rural areas to urban areas, and from one region to another. Mexico’s urban soundscapes are among the most distinctive on the planet, and this week has been declared National Sound Week by the federal government. Several “sound walks” have been organized in major cities.

As a USA Today article points out, all sounds contain a message. For example, “A series of four notes on a pan flute means the scissor-sharpening man is in the neighborhood. A ringing hand bell means the garbage truck is here” and so on.

The traffic whistles made by police are an important subset of the sounds in any Mexican town or city. They have a mini-language of their own, explored in this MexConnect article: Did you know? Different traffic whistles in Mexico mean different things.

Fieldwork idea: Portable sound meters make it relatively easy to compile a map showing the sound levels (measured in decibels) around particular sources of sound, whether periodic in occurrence (such as vehicles at a traffic light or the crowd in a sports stadium) or more or less continuous (like the hum of wind turbines or the noise of a factory).

Once a map has been compiled, analyze any patterns you can identify. Studies of urban soundscapes are not only of academic value, but have an important role in city planning as well. For example,

  • Do tall buildings mask the loudest sounds, or do they funnel it towards the listener?
  • Does the sound level vary depending on the quantity of vegetation between the sound source and the listener?
  • Which kinds of vegetation are most effective in masking sounds?
  • Is east-west traffic louder than north-south traffic?

The energy efficiency of farming in Mexico and elsewhere

 Other, Teaching ideas  Comments Off on The energy efficiency of farming in Mexico and elsewhere
Aug 302010
 

Corn is one of the world’s major cereal crops and has long been a vitally-important crop to Mexico.

However, is it more efficient in energy terms to be a slash-and-burn farmer of corn in the jungle or a technologically-sophisticated corn farmer on the US or Canadian prairies?

David and Marcia Pimentel have compiled data from a variety of sources and analyzed this question and similar questions in some detail.

In Mexico, they calculated that about 1144 hours of human labor are required to produce 1 hectare (ha) of corn using only hand labor, and no animals or machinery. On the other hand, using machinery, cultivating a hectare of corn requires only 10 hours of labor in the USA.

The total energy required to cultivate a single hectare of corn by hand is 589,160 kcal for the 1144 hours of hand labor, plus 16,570  kcal for making the axe and hoe used by the farmer (this figure assumes a certain lifespan and maintenance needs for such tools), plus 36,608 kcal for the 10.4 kg of seed required. The grand total for energy inputs into the system is 642,336 kcal. [One kcal (kilocalorie) = 4184 joules.]

An average yield for corn in such a non-mechanized system is 1,944 kg/ha, equivalent to 6,901,200 kcal. The ratio between the energy output and the energy expended of this system is almost 11:1.

By way of comparison, the energy inputs (labor, machinery, gasoline, seeds, irrigation, herbicides, etc) in a typical, highly mechanized US or Canadian cornfield total 10,535,000 kcal/ha. The yield of corn is about 7,500 kg/ha, equivalent to 26,625,000 kcal. The energy ratio for this farming system is 2.5:1
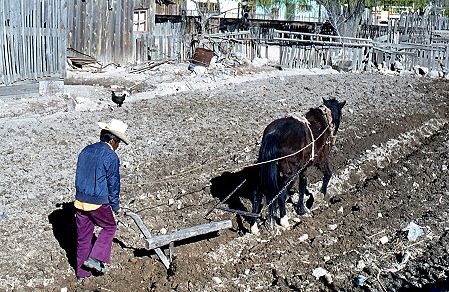
Horse-drawn plough, Creel, Chihuahua, 1980

More efficient than a tractor?

Which system is more efficient? This is where it becomes essential to define what is meant by efficiency. In terms of output per hour of labor, the US farm is far more efficient. In terms of yield per hectare, the US farm is more efficient. However, in terms of energy ratios, the Mexican farm is four times more efficient than its US counterpart.

Looking at energy ratios makes it possible to make various generalizations about farming. In general, hand cultivation methods are the most energy efficient, followed by systems where animals are used, followed by systems based largely on machinery. The precise numbers for any type of farming will vary from one country to another, since the labor required and crop yields do depend to some extent on such geographic factors as soil types, terrain and the weather during the growing season.

It is also possible to look at what the additional energy inputs in a highly mechanized system actually achieve. For instance, in the USA, machinery and fuel account for about 20% of all the fossil energy employed; in other words, about 20% of the energy input reduces, or replaces, human and animal labor. The remaining 80% of fossil fuel inputs is employed in increasing corn yields by means of fertilizers, insecticides, herbicides and irrigation.

The table shows the energy ratios which have been calculated for a selection of crops in various countries.

Type of farmingLocationEnergy ratio (output/input)
CassavaTanzania23.0
Corn (human power)Mexico10.7
Corn (human power)Guatemala4,8
Corn (oxen power)Guatemala3.1
Corn (oxen power)Mexico4.3
Corn (animal power)Philippines5.1
Corn (mechanized)USA2.5
Wheat (bullock power)Uttar Pradesh, India1.0
WheatUSA2.0
Rice (human power)Borneo7.0
Rice (mechanized)Japan3.0
RiceCalifornia2.0
Sorghum (human power)Sudan14.0
SorghumUSA2.0
SoybeansUSA4.0
OrangesFlorida, USA2.0
ApplesEastern USA1.0
PotatoesNew York state, USA1.2
PotatoesUK1.5
TomatoesCalifornia0.6
SpinachUSA0.2
Eggs, batteryUK0.15
CatfishLouisiana, USA0.03
ShrimpThailand0.01
OystersHawaii0.01
Winter lettuce (glasshouse)UK0.0023
All agriculture, 1952UK0.47
All agriculture, 1968UK0.35

An energy ratio below 1.0 for a particular item means that the inputs of energy exceed the output, or in other words more energy is expended on cultivation than is returned via the crop.

As Tim Bayliss-Smith concludes in the The ecology of agricultural systems, the evidence is that, “Only in fully industrialized societies does the use of energy become so profligate that very little more energy is gained from agriculture than is expended in its production.”

Why are energy ratios important?

Energy ratios shed some light on the sustainability of farming. Cultivation relying only on human power, is clearly sustainable virtually indefinitely, provided that land degradation is avoided and yields do not decline. Farming using a mix of animal and human power is also likely to be fully sustainable. However, the same is not true for cultivation relying on power derived from fossil fuels. For mechanized farming, sustainability requires machinery to be powered by renewable sources of energy, such as solar or wind power. Such sources of energy may be impossible to harness in some climatic zones.

Of course, farm systems are not only about energy flows and ratios. As Tim Bayliss-Smith points out, farms ”also provide jobs, incomes and a way of life for agrarian societies, whose social and ideological characteristics cannot be ignored.”

Sources / further reading:

  • Pimentel, David and Pimentel, Marcia H. Food, energy and society (3rd edition) CRC Press, 2008
  • Bayliss-Smith, T.P. The ecology of agricultural systems. Cambridge University Press, 1982.
  • Simmons, I.G. “Ecological-Functional Approaches to Agriculture in Geographical Contexts”, in Geography, 65: 305-316 (Nov. 1980)

Agriculture is analyzed in chapter 15 of Geo-Mexico: the geography and dynamics of modern Mexico. and concepts of sustainability are explored in chapters 19 and 30.  Buy your copy today, so you have this handy reference guide to all aspects of Mexico’s geography available whenever you need it.
The 10 least populous states in Mexico

 Maps, Teaching ideas  Comments Off on The 10 least populous states in Mexico
Aug 192010
 

The table shows the 10 states in Mexico which have the fewest inhabitants.

RankStatePopulation (2005)Population (2010 census)
1Baja California Sur512,170637,065
2Colima567,996650,129
3Campeche754,730822,001
4Nayarit949,6841,084,957
5Tlaxcala1,068,2071,169,825
6Aguascalientes1,065,4161,184,924
7Quintana Roo1,135,3091,324,257
8Zacatecas1,367,6921,490,550
9Durango1,509,1171,632,860
10Querétaro1,598,1391,827,985
Map of least populous states

The smallest states in Mexico (by population). Click to enlarge. All; rights reserved

(a) Can you suggest any characteristics which many of these small states might share? (not counting, obviously, their small population!)

(b) What implications might a relatively small population have for a state, and for its economy and administration?

(c) What geographic and historical factors might help to explain why some states have only a relatively small population?

(d) Which two states exchanged their rank positions between 2005 and 2010? Can you suggest why this might have occurred?

Several chapters of Geo-Mexico: the geography and dynamics of modern Mexico. discuss population issues, including population distribution and population density. Buy your copy today to have a handy reference guide to all major aspects of Mexico’s geography!

The 11 states in Mexico with the oldest population

 Maps, Teaching ideas  Comments Off on The 11 states in Mexico with the oldest population
Aug 142010
 

The table shows the eleven states in Mexico which have the oldest population (defined by average age of the population).

RankStateAverage age (years)
1Federal District30.0
2Veracruz28.4
3=Nayarit28.0
3=Nueva León28.0
5Yucatán27.6
6=Zacatecas27.4
6=Colima27.4
6=Hidalgo27.4
6=Morelos27.4
6=Sonora27.4
6=Tamaulipas27.4
Map of states with the oldest population

States with the oldest population. Click to enlarge. All rights reserved.

(a) What factors might explain why the inhabitants of some states in Mexico have a high average age than others? What might these 11 states have in common?

Hint: Do not just think about why some states might have many elderly people, but also why some states might have relatively few young children

You might also like to compare this map with a map of the states which have the youngest average age.

Several chapters of Geo-Mexico: the geography and dynamics of modern Mexico. discuss population issues, including the age of the population. Buy your copy today to have a handy reference guide to all major aspects of Mexico’s geography!

The 11 states in Mexico with the youngest population

 Maps, Teaching ideas  Comments Off on The 11 states in Mexico with the youngest population
Aug 052010
 

The table and map show the eleven states in Mexico which have the youngest population (defined by average age of the population).

RankStateAverage age (years)
1Quintana Roo22.3
2Chiapas24.2
3Baja California24.9
4Querétaro25.7
5=State of México25.9
5=Aguascalientes25.9
7=Guerrero26.0
7=Baja California Sur26.0
9=Tabasco26.3
9=Puebla26.3
9=Chihuahua26.3
The states with the youngest average age

The states with the youngest average age. Click to enlarge. All rights reserved.

This map does not appear to reveal any obvious spatial pattern. What do these 11 states have in common, apart from (presumably) a high percentage of young people?

(a) Can you suggest what circumstances (or combination of circumstances) might result in a state having a relatively young population?

(b) Find a table or map showing the birth rates in each state. Is there any similarity between that information and this map of states with the youngest population?

(c) Find a table or map showing which states have experienced the fastest rates of in-migration because their economies have grown rapidly in the past 30 or 40 years. Is there any similarity between that information and this map of states with the youngest population?

Several chapters of Geo-Mexico: the geography and dynamics of modern Mexico. discuss population issues, including the age of the population. Buy your copy today to have a handy reference guide to all major aspects of Mexico’s geography!

The 10 warmest states in Mexico

 Maps, Teaching ideas  Comments Off on The 10 warmest states in Mexico
Jul 292010
 

The table shows the ten warmest states in Mexico, defined by their average annual temperature.

RankStateAverage annual temperature (degrees C)
1Tabasco26.4
2Yucatán25.9
3=Campeche25.8
3=Quintana Roo25.8
5Colima25.3
6Guerrero24.9
7=Chiapas24.1
7=Nayarit24.1
9Sinaloa24.0
10Veracruz23.7
Map of the warmest states in Mexico

The warmest states in Mexico. Click to enlarge. All rights reserved.

In both Canada and the USA, average temperatures tend to depend largely on latitude, ie. they increase towards the south of the country. This is clearly only partially the case in Mexico.

(a) What factors apart from latitude influence the average temperatures in Mexico’s states? Try to find evidence that either supports (or refutes) your ideas.

(b) Is there any connection between average temperature and precipitation amounts? Compare this map of states which are relatively warm with the states which have

(c) If you do not already know, can you guess where the coolest states in Mexico will be? Check here to find out if you are right!

Mexico’s diverse climates are the subject of chapter 4 of Geo-Mexico: the geography and dynamics of modern Mexico. Climate-related hazards are analyzed in chapters 6 and 7. Buy your copy today!

The 10 coolest states in Mexico

 Maps, Teaching ideas  Comments Off on The 10 coolest states in Mexico
Jul 262010
 

The table shows the ten coolest states in Mexico, defined by their average annual temperature.

RankStateAverage annual temperature (degrees C)
1Tlaxcala14.1
2=Estado de México15.2
2=Federal District15.2
4Chihuahua16.6
5=Zacatecas17.2
5=Aguascalientes17.2
7Hidalgo17.4
8Durango17.7
9Guanajuato17.9
10Baja California18.5
Map of the coolest states in Mexico

The coolest states in Mexico. Click to enlarge. All rights reserved.

In both Canada and the USA, average temperatures tend to depend largely on latitude, ie. they decrease towards the north of the country. This is clearly not the case in Mexico.

(a) What factors apart from latitude influence the average temperatures in Mexico’s states? Try to find evidence that either supports (or refutes) your ideas.

(b) Is there any connection between average temperature and precipitation amounts? Compare this map of states which are relatively cool with the states which have

(c) Can you guess where the warmest states in Mexico will be? To find out if you are right, you can find an atlas or on-line map showing average temperatures in Mexico, or keep reading the Geo-Mexico blog each day until we include our own map showing the warmest states!

Mexico’s diverse climates are the subject of chapter 4 of Geo-Mexico: the geography and dynamics of modern Mexico. Climate-related hazards are analyzed in chapters 6 and 7. Buy your copy today!

The 10 states in Mexico with the highest percentage of homes receiving remittances

 Maps, Teaching ideas  Comments Off on The 10 states in Mexico with the highest percentage of homes receiving remittances
Jul 212010
 

The table and map show the ten states which have the highest percentage of homes receiving remittances. (Data for 2005)

RankState% of homes that receive remittances, 2005
1Zacatecas12.2
2Michoacán10.4
3Guanajuato9.6
4Morelos7.5
5San Luis Potosí7.4
6Durango7.3
7Hidalgo7.1
8=Guerrero6.8
8=Nuevo León6.8
10Aguascalientes6.7
States where a high % of households receive remittances

States where a high % of households receive remittances. Click to enlarge. All rights reserved.

These data portray where remittances are most critical in terms of maintaining household finances. If a high percentage of homes in a state receive remittances, that suggests that people living in the state are likely to be quite dependent on remittances.

The local economy in many towns and villages in these states may be significantly boosted by incoming remittances. These places are likely to suffer most in times of economic down-turn when the US economy is suffering, employment is harder to find, and when fewer remittance payments are sent back home.

(a) What do the 10 states where a high percentage of homes receive remittances have in common?

(b) What factors might help explain why lots of households in some states receive remittances, but only very few households in other states?

(c) Explain what is meant in geography or economics by a “multiplier effect”.

(d) Suggest which sectors of the economy would be most likely to benefit from incoming remittance payments. Try to find evidence to support (or refute) your ideas.

“Migration to the USA” is the title of chapter 26 of Geo-Mexico: the geography and dynamics of modern Mexico. This chapter provides a good introduction to the geography, history and impacts of migration and remittances. Buy your copy today!

The 10 states in Mexico receiving the most remittances in total

 Maps, Teaching ideas  Comments Off on The 10 states in Mexico receiving the most remittances in total
Jul 162010
 

The table shows the 10 states which receive the highest total remittances.

RankStateRemittances ($ millions), 2005
1Michoacán2,595
2Guanajuato1,715
3Jalisco1,693
4State of México1,675
5Puebla1,174
6Veracruz1,155
7Federal District1,452
8Oaxaca1,002
9Guerrero957
10Hidalgo718
States receiving the most remittances (highest value)

States receiving the most remittances (highest value). Click to enlarge. All rights reserved.

The data show very clearly that all the states receiving high total amounts of remittances are in the southern half of Mexico.

(a) What factors might explain this pattern?

(b) Compare this map with a map of the states with highest per person remittances. Why are some states only shown on one of the maps, and not on the other?

(c) Find a table showing the total population of each state in Mexico. To what extent do the total population figures for each state help to explain whether or not they are in the top 10 states for receiving remittances?

“Migration to the USA” is the title of chapter 26 of Geo-Mexico: the geography and dynamics of modern Mexico. This chapter provides a good introduction to the geography, history and impacts of migration and remittances. Buy your copy today!

Jul 122010
 

The map shows the ten states which receive the highest remittances (funds sent home, primarily from the USA, by Mexican migrant workers) on a per person basis in 2005.

Map of states receiving most remittances per person

The states receiving most remittances per person, Click to enlarge. All rights reserved.

Many factors help to explain why some states receive high amounts of remittances, on a per person basis, while other states receive much less.

They include:

  • the number of migrant workers from that state working in USA
  • the poverty levels in the state
  • unemployment rates in the state
  • whether or not that state has a long history of supplying migrant workers

Perhaps surprisingly, there is no correlation between distance from the USA and the per person remittances sent back by migrant workers. On the contrary, it is clear that more remittances are received per person in several southern states. No northern border state is in the top 10 receiving states for remittances.

Why might this be? Perhaps workers from states nearer to the border return funds by non-official channels, such as with friends or relatives returning home. Perhaps life is so good in the northern states that fewer workers migrate.

(a) What other factors can you think of which might be relevant?

(b) Try to find data to help support (or refute) your ideas.

“Migration to the USA” is the title of chapter 26 of Geo-Mexico: the geography and dynamics of modern Mexico. This chapter provides a good introduction to the geography, history and impacts of migration and remittances. Buy your copy today!

Jun 152010
 

Want to show off your Spanish language skills? Try learning this Spanish-language tongue-twister related to San Juan Parangaricutiro, a town that was destroyed by Paricutín Volcano:

El arzobispo de Parangaricutirimícuaro
se quiere desarzobispoparangaricutirimicuarizar
¡el que lo desarzobispoparangaricutirimicuarizare,
un buen desarzobispoparangaricutirimicuarizador será!

The inhabitants of San Juan Parangaricutiro won a UN Development Prize.

For a more detailed account of the history of the volcano, and of the considerable architectural attractions of the village of Angahuan, including its superb church, read chapter 35 of Western Mexico: A Traveler’s Treasury (Sombrero Books 2013).

Original article, as published on MexConnect

Paricutín Volcano is discussed in chapter 2 of Geo-Mexico: the geography and dynamics of modern Mexico; a local sustainable forestry project (at San Juan Parangaricutiro) is examined in chapter 15.

Mexico’s population density compared to other countries. Is Mexico too crowded?

 Other, Teaching ideas  Comments Off on Mexico’s population density compared to other countries. Is Mexico too crowded?
May 192010
 

It is sometimes claimed that Mexico is ‘too crowded’ or ‘overpopulated’. Overpopulation, however, is an elusive concept, since it depends on the complex relationships between total population (and/or population density) and the resources available to support that population. In turn, the value of these resources depends in part on the technologies available to utilize them.

Even accepting that Mexico is not over-populated (since it apparently has sufficient resources to support its population), it is still interesting to compare Mexico’s population density with that of other countries.

CountryPopulation Density (persons per sq. km)
Mexico55
Bangladesh1127
India359
Japan337
UK337
Germany229
Italy200
Nigeria167
China 139
Indonesia121
Colombia40
USA31
Venezuela29
Brazil22
Argentina14
Canada3

As the table shows, Mexico’s overall population density of 55 persons per km2 is low, compared to Asian and European countries: Bangladesh (1127), India (359), Japan (337), UK (255) and Germany (229).

On the other hand, it is easily the highest among large countries in the New World like Colombia (40), USA (31), Venezuela (29) and Brazil (22).

Q. What are the implications for development of a country having a high density of population?

In a future post, we will consider whether or not Mexico’s population is evenly distributed across the country.

Perceptions of Mexico, from popular images to the “real” Mexico

 Other, Teaching ideas  Comments Off on Perceptions of Mexico, from popular images to the “real” Mexico
May 182010
 

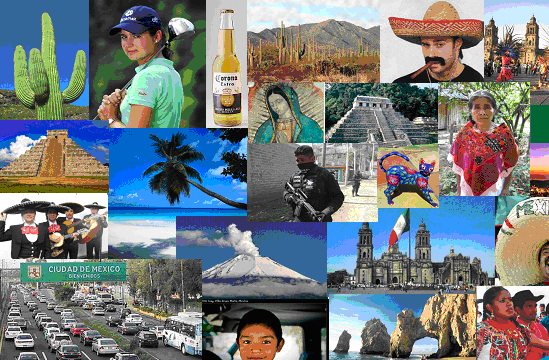
What comes to mind when the word “Mexico” is mentioned?

For most people, it brings to mind a variety of colorful images, such as those below, usually based on television, magazines, travel brochures and personal travels in Mexico. “Mexico” also is associated with verbal or written words or phrases, such as:

  • Drug wars
  • Illegal immigrants
  • Tacos and tamales
  • Tequila / Good beer
  • Fabulous beach resorts
  • Bargain prices
  • Poverty
  • Friendly people
  • Carlos Slim (the World’s richest man)
  • Deserts and cactus
  • Swine flu
  • Pre-Columbian ruins
  • Sombreros
  • Geo-Mexico (well maybe that last one is wishful thinking, but hopefully it will true someday)

Q. How many of these images can you identify?

These images and word phrases hold some truth, but do not begin to capture the full importance and significance of Mexico, something we try to do more thoroughly in Geo-Mexico: the geography and dynamics of modern Mexico.

For example, did you know that Mexico is one of only six countries ranked in the top 15 in the world in geographic size, population, and economic production? Furthermore, Mexico is one of the earth’s most biologically diverse countries. It ranks first in number of reptile, cactus and pine species; second in mammal species; and fourth in amphibian species.

There is lots more to Mexico than meets the eye in magazine and TV adverts – and that’s why you should consider buying your own copy of Geo-Mexico: the geography and dynamics of modern Mexico, rather than relying on your local library or extracts posted on this blog!

The 10 states of Mexico which have the longest coastline

 Other, Teaching ideas  Comments Off on The 10 states of Mexico which have the longest coastline
May 132010
 

Here are the ten states of Mexico which have the longest coastlines. Note that these figures are those published by the National Statistics and Geography Information Institute (INEGI). We discussed the impossibility of ever measuring a coastline accurately in a previous post:

How long is Mexico’s coastline?

RankStateLength of coast (km)
1Baja California Sur2,131
2Baja California1,493
3Sonora1,209
4Quintana Roo1,176
5Veracruz720
6Sinaloa622
7Oaxaca568
8Guerrero522
9Tamaulipas433
10Campeche425

Only seven other states have a marine coast. They are Jalisco, Yucatán, Nayarit, Chiapas, Michoacán, Tabasco and Colima.

The remaining 15 states (counting the Federal District as a state) are land-locked.

Q. What are the likely impacts on economic activity of either (a) having a coastline or (b) being landlocked?

The 10 driest states in Mexico

 Teaching ideas  Comments Off on The 10 driest states in Mexico
Apr 102010
 

These are the ten states in Mexico with the lowest annual precipitation totals. Mexico’s six wettest states receive more than twice the precipitation of any of these dry states.

RankStateAnnual precipitation (mm)
1Baja California Sur176.2
2Baja California203.7
3Coahuila326.8
4Sonora421.6
5Chihuahua423.4
6Aguascalientes456.4
7Durango499.0
8Zacatecas517.6
9Querétaro558.2
10Nuevo León602.2

Teaching ideas:

  • Plot these states on a map of Mexico and see if there is any clear pattern to their location.
  • Does their location help to explain why these states receive less precipitation than other parts of Mexico?
  • What other factors, besides location, may help to explain why they are the driest states in Mexico?
  • What are the implications of receiving limited precipitation for economic activities?
  • To what extent does receiving limited precipitation influence a region’s development?

Mexico’s diverse climates are the subject of chapter 4 of Geo-Mexico: the geography and dynamics of modern Mexico. Water availability, rivers, aquifers, water issues and hazards are analyzed in chapters 6 and 7. Buy your copy today!

The 10 largest states in Mexico in terms of population

 Other, Teaching ideas  Comments Off on The 10 largest states in Mexico in terms of population
Apr 062010
 

This table shows the ten states in Mexico which have the largest populations. The total population was 112,322,757 in 2010, according to the preliminary results of the 2010 census. These figures may change slightly when the final results of the census are made available.

RankStatePopulation (2010 census)
1State of México15,174,272
2Federal District8,873,017
3Veracruz7,638,378
4Jalisco7,350,355
5Puebla5,779,007
6Guanajuato5,485,971
7Chiapas4,793,406
8Nuevo León4,643,321
9Michoacán4,348,485
10Oaxaca3,801,871

Q. Find these ten states on a map of Mexico [printable map of Mexico in pdf format]. Do the states with the most people also have the largest land areas?

Tourism based on major events in Mexico (“concert tourism”)

 Mexico's geography in the Press, Teaching ideas  Comments Off on Tourism based on major events in Mexico (“concert tourism”)
Apr 042010
 

The recent (2010) Elton John concert at Chichen Itza provides an ideal case-study for discussion in geography classes. Events such as this concert are a great starting point for a debate about the benefits and drawbacks of using world-famous archaeological or cultural sites as the setting for concerts by major modern international music stars.

Benefits:

  • $$$ paid directly by event organizers
  • $$$ paid by visiting concert-goers (“concert tourists”?) for hotels, food and transportation
  • free promotion for the site in world press and media

Drawbacks:

  • shows little respect for indigenous (Mayan) culture; the Maya consider the site a ceremonial center
  • many of the $$$ end up outside Mexico in the main offices of multi-national hotel chains and foreign airlines
  • ticket prices of $80—$800 (dollars), which most local residents are unable to afford, make this an elitist event

After those initial suggestions, it’s over to you… Readers are hereby invited to add their own suggestions of other benefits and drawbacks. Please do this via the comments section below this post.  (Click here if the comments section is not currently visible.)

So, what other factors should be taken into account before reaching an evaluation of whether or not such events are a good idea?

What do YOU think?

The first geography field trip guide in Mexico

 Books and resources, Teaching ideas  Comments Off on The first geography field trip guide in Mexico
Apr 032010
 

Despite the popularity of geography in Mexico’s high schools, students are rarely involved in any geographic fieldwork until they reach university. The major exceptions are those students lucky enough to attend one of the international schools offering courses such as the International Baccalaureate (IB) Diploma Programme. The IB geography syllabus requires all students to have undertaken and written up a report on fieldwork. Most IB fieldwork is hypothesis-based.

It is perhaps not surprising therefore that the number of publications relating to fieldwork in Mexico is very small. There have been a limited number of specialist “field guides” published, relating to geology and geography, and coinciding with international conferences.

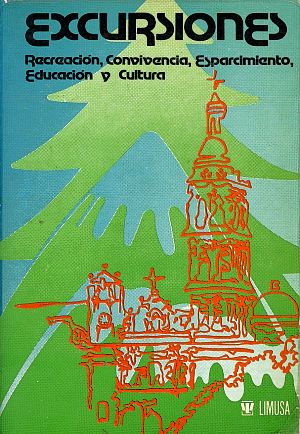
To the best of my knowledge, the first fieldwork guide aimed at high school students, teachers and the general public was written following a meeting of teachers in Mexico City in March 1979. Excursiones was designed to be a guide for “teachers, parents and/or organized groups interested in finding pleasant and educational ways of enjoying our environment and encouraging the spiritual elements inherent in making use of the tourist attractions that form part of Mexico’s heritage.”

The book, published by Editorial Limusa in 1983, has 14 general chapters (clothing, food, first aid, etc), followed by 17 destination specific chapters:

  • Cacahuamilpa
  • Taxco
  • Zempoala
  • Tepoztlán
  • Desierto de los Leones
  • Ruta de la Estrella
  • Valle de Bravo
  • Isla de los Aves-Ocotal
  • El Xinantécatl and its lakes
  • Piedras Encimadas
  • Ruta de los Volcanes
  • Africam Safari
  • El Chico
  • Basalt columns
  • Tolantongo
  • El Xitle and El Ajusco
  • Chapingo-Texcoco

We’ll take a closer look at the opportunities offered for fieldwork in some of these locations in future posts.

Baseball is not the oldest ballgame in the Americas

 Other, Teaching ideas  Comments Off on Baseball is not the oldest ballgame in the Americas
Mar 052010
 

Forget modern “traditions” like the World Series! Forget soccer, tennis and golf! By far the oldest ballgame in the Americas is the little known game of Ulama. Amazingly, this game is still played in some regions of Mexico, where it is believed to have originated more than 3000 years ago!

The precise rules of the ancient game are lost in the mists of antiquity, but three distinct forms of Ulama (using the hip, arm and a stick respectively) were played at the Mesoamerican ballgame (Ulama) Festival in Mazatlán in April 2002. The Festival was organized by the Mazatlán Historic Society, which was pushing for the game to be included in the “Intangible Heritage Category” of UNESCO’s World Heritage denominations. (As of March 2010, it had not yet made the list.)

The original ballgame, played by the Aztecs and other Nahuatl speaking peoples in Mexico at the time of the Spanish Conquest, was known as Ullamaliztli, a name deriving from ullama, which means the playing of a game with a ball, and ulli, rubber. Many archaeological sites in Mexico boast the ruins of one or more ballcourts where the game was played and hundreds of representations are known in Pre-Columbian art of ballgame players with their characteristic protective gear, some dating as far back as 1500 B.C. The protective padding was necessary because the solid rubber ball used in the game weighed five to eight pounds (2 – 3 kilos) and was propelled at speeds of up to 95 kph (60 mph). While most ballgame relics are of single players, one polished clay model found in the state of Nayarit actually depicts a game in progress.

Before you say “What a load of (old) balls!”, consider the fact that the ballgame has had profound consequences on sports all around the world. When the Spanish conquistador Hernán Cortés returned to Spain in 1528, he took with him ballplayers who demonstrated their skills at the court of King Charles V. The rubber ball they used amazed the Europeans as much as the game itself, since it bounced much more than the hair-stuffed leather balls in use at the time in Europe. The smuggling of the first rubber seeds out of Brazil led to rubber-tree plantations being established in Malaysia and rubber quickly became a world commodity, with the widespread uses we know today.

The research establishing the links between the relatively modern versions of Ulama, played in Sinaloa, and the pre-Columbian game of Ullamaliztli was carried out by Dr. Ted Leyenaar of the Rijksmuseum voor Volkenkunde in Leiden, Holland. Emphasizing the game’s immense historical importance, he says, “That the Mesoamerican ballgame has survived and flourished for more than 3000 years earns it the distinction of being one of humanity’s great cultural expressions”.

The details, meaning and significance of the game are explored more fully on the Mazatlán Historical Society’s webpages at http://www.ulama.org, the main source for this article. The Society is hoping to set up the world’s first Ulama Museum and has begun collecting related artifacts.

“A load of old balls!”? – I don’t think so!

This is an edited version of an article originally published on MexConnect.

Click here for the complete article

“Indigenous peoples” is the title of chapter 10 of Geo-Mexico: the geography and dynamics of modern Mexico and “Mexico’s cultural landscape” is the title of chapter 13.

Sports-related teaching idea:

  1. Map the locations of Mexico’s top fútbol (soccer) clubs.
  2. To what extent do these locations match a map of Mexico’s population density (Figure 8.2 in Geo-Mexico)?
  3. Does it appear that factors such as GDP/capita (Figure 14.3) or Mexico’s highway system (Figure 17.3) have also influenced where the top soccer clubs are located?
  4. Suggest what other factors may have influenced where Mexico’s soccer clubs are located.

Mexico’s ten largest cities (2009)

 Other, Teaching ideas  Comments Off on Mexico’s ten largest cities (2009)
Feb 202010
 

Mexico’s ten largest cities (2009 population) are:

  1. Mexico City          19,982,000 (Metropolitan Area)
  2. Guadalajara          4,365,000
  3. Monterrey             3,986,000
  4. Puebla                  2,647,000
  5. Tijuana                 1,784,000
  6. Toluca                  1,775,000
  7. León                     1,555,000
  8. Cuidad Juárez      1,408,000
  9. Torreón                1,187,000
  10. San Luis Potosí   1,037,000

[Figures taken from Table 21.2 of Geo-Mexico: the geography and dynamics of modern Mexico.]

Teaching idea:
1. Plot the location of these cities on a blank map of Mexico
2. Show the relative sizes of the cities in a way which is clear to the viewer. Use some form of proportional representation, and justify your choice.
3. Describe the resulting pattern of Mexico’s ten largest cities. (For instance, are they mainly in the central part of the country, the south, the north, or…?)
4. Suggest some possible reasons for the pattern you have described.

Mexico’s Spanish language place names

 Teaching ideas  Comments Off on Mexico’s Spanish language place names
Feb 182010
 

The Spanish language is at least as rich as English when describing landscapes. Common Spanish geographical terms relating to landscape include:

  • cerro = hill
  • montaña = mountain
  • sierra = elongated mountain range
  • mesa = flat-topped (table) hill
  • cumbre = summit or peak
  • pico = sharp peak
  • valle = valley
  • barranca = canyon
  • cenote = limestone sinkhole
  • cabo = point or cape
  • punta = point or headland
  • arroyo = brook
  • río = river
  • lago = lake
  • salto, cascada = waterfall
  • ojo (de agua) = spring
  • presa = reservoir (and dam)
  • mar = sea
  • salinas = salt flats or salt works
  • golfo = gulf
  • bahía = bay
  • puerto = port (inland, puerto = pass)

[Extract from chapter 1 of Geo-Mexico: the geography and dynamics of modern Mexico]

Mexico’s indigenous place names

 Teaching ideas  Comments Off on Mexico’s indigenous place names
Feb 172010
 

Mexico’s place names, or toponyms, offer many clues about geography. Mexico’s indigenous peoples spoke languages that had no formal alphabet. For place names, they used combinations of pictographs, ideographs and phonetic symbols.

Spanish explorers recorded the names provided by the locals as best they could, resulting in some inevitable confusion and distortion. For instance, it is sometimes claimed that “Yucatán” actually derives from Maya Indians responding, “I don’t know!” when asked to name a nearby place.

Suffixes derived from indigenous (mostly Nahuatl) words include:

  • -apan = in/near water or river
  • -calco = in the house of
  • -can = place
  • -cingo, -tzingo = (small) place of settlement
  • – huacan, -oacan = place where they have
  • -pan = in/on
  • -ro = place
  • -tepec = hill
  • -tepetl = mountain
  • -titlan = near
  • -tla = abundance
  • -tlan = in or near

Can you think of examples of modern-day place names using each of these suffixes? For instance,  “Zapopan”, in the state of Jalisco, is an example of a place name ending in -pan = in/on.

[Edited extract from chapter 1 of Geo-Mexico: the geography and dynamics of modern Mexico]

Mexico’s population in 1990, 2010 and 2050

 Books and resources, Teaching ideas, Updates to Geo-Mexico  Comments Off on Mexico’s population in 1990, 2010 and 2050
Feb 082010
 

Want your very own Geo-Mexico bookmark?

This link – Population of Mexico in 1990, 2010 and 2050 – is to a pdf file of three age-sex pyramids showing the population of Mexico in the years 1990 and 2010, and the predicted population for the year 2050.

Print the file to make your own Geo-Mexico bookmark and get a fascinating insight into Mexico’s likely future population. Mexico’s population growth rate has fallen dramatically since 1990. More surprisingly, between now and 2050, the average age of people in Mexico will rise rapidly. Mexico is set to move from a predominately young population to a predominately old population in only a couple of generations.

What else can you say about Mexico’s population from a close analysis of the population pyramids? (Feel free to post your comments below)