Exclusive: Quintana Roo cacao megaproject collapses

 Other  Comments Off on Exclusive: Quintana Roo cacao megaproject collapses
Aug 302013
 

Following our critique of the Maya Biosana chocolate megaproject (Maya Biosana or Maya Bio-Insana? Chocolate megaproject in Quintana Roo),  a project which claimed it would plant four million cacao plants in four years, we have received additional information about developments in the Los Divorciados ejido where the project is based.

According to an insider, the project has now completely abandoned its plans for a massive cacao plantation. Jim Walsh, the former CEO of Maya Biosana, left the project in December 2012. Maya Biosana is now being managed by a Mexican firm AMSA (Agroindustrias Unidas de México, S.A. de CV) which is trying to convert the land into a profit-making venture producing corn and other grains.

Prior to the demise of the cacao megaproject, the organizers of Maya Biosana had released a short documentary detailing the project, and lauding its successful transformation of “a dwindling Mayan town” into a “now blossoming entrepreneurial city growing cacao fields and supporting their local community.” The film’s blurb claims that since the video was filmed, “the town has expanded and grown two-fold.”

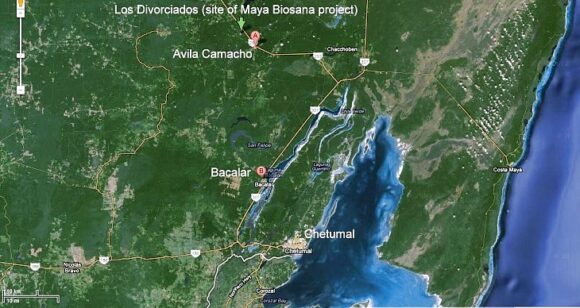
According to recent visitors to Los Divorciados (the ejido in question—see map), this could not be further from the truth. They report that in summer 2013, the Maya Biosana project, which had started out by employing around 200 people, now had 40 workers at most. One member of the group that visited Maya Biosana estimates, “based on the number of motorcyles parked there when we were there”, that the real workforce at Maya Biosana may be even smaller, perhaps 20-25.

Google Earth image of southern Quintana Roo

Google Earth image of southern Quintana Roo

The 13-minute documentary, “Maya Biosana – The Rebirth of Mexican Cacao, A short documentary,” can still be seen (as of August 2013) via http://intentionalchocolate-blog.com/2013/07/17/maya-biosana-the-rebirth-of-mexican-cacao-a-short-documentary/ on the Intentional Chocolate blog. However, note that many of the images included in the video are most definitely NOT from the Maya Biosana area, or even from Quintana Roo.

The film’s badly-written blurb claims that it, “follows Maya Biosana, as it repositions Mexico as the largest organic cocoa producer in the world and bringing the sacred plant back to it’s birth home. Improving the quality of life in Mexico with it’s vision of collaboration, co-creation and intention by providing the local and surrounding communities with a new model of business utilizing their own proprietary Well Being index as the marker of change.”

According to the Intentional Chocolate blog, “The film won the best short Award in 2012 at the Awareness Festival”, a claim it has also proved impossible to verify.

The original Maya Biosana is no more, but will the new management of this area by AMSA prove to be any better for the local ejidatarios than the original megaproject fiasco? We certainly hope so, but only time will tell.

In the interim, we received an e-mail  a few weeks ago about a new megaproject underway in Avila Camacho, the next village to Los Divorciados (see map). Apparently, this megaproject is for plantations of exotic trees, which involves deforesting the jungle, extracting the wood, and planting a total of 6000 hectares with White Teak (Gmelina arborea, Spanish common name melina), a tropical hardwood, at the rate of 1000 hectares a year. So far, about 50 hectares have already been planted.  The correspondent writes that they “stole the land of the Mayan people, cheating about the pay of rent: the rent is $45US for a hectare for a year. They are destroying the jungle  and extracting the wood.” We have been unable to get independent verification of these claims as yet, but will continue attempting to do so.

Initially, some equipment from Maya Biosana was utilized on the Avila Camacho project, and our correspondent  claims that it is the same Mexican-associated company that is responsible, though we have not yet been able to confirm this.  According to a second source, the CEO of this project is Fernando Gonzalez, a “very good friend of Jim Walsh”, the former CEO of Maya Biosana, but there is no longer any direct connection between the two projects.

There may have been recent “developments” in this part of Mexico, but they certainly do not yet constitute any form of sustainable development.

Related posts:
Shopping habits in Mexico

 Mexico's geography in the Press  Comments Off on Shopping habits in Mexico
Aug 282013
 

Kantar Worldpanel México’s survey of shopping habits for 8,500 homes across the country reveals that 70% of household expenditures are spent in one of three main “purchasing channels”.

1. The first, traditional convenience or “corner” stores receive 35% of household spending, and are the channel most frequently visited, 217 times/year/household on average. Poorer households rely more on these stores than middle-class households. Most visits (71%) are on weekdays and 44% of visits are to purchase items for immediate consumption.

2. Supermarkets are the second main channel, used by 98% of households, with a frequency of 49 trips/year. Supermarkets are favored by middle class families for their weekly or biweekly shop, usually on weekends.

3. The third main channel is door-to-door and catalog sales, used by 92% of households, with a frequency of 42 times/year.

According to the study, 74% of households choose the nearest store and 78% attach importance to the location of the store.

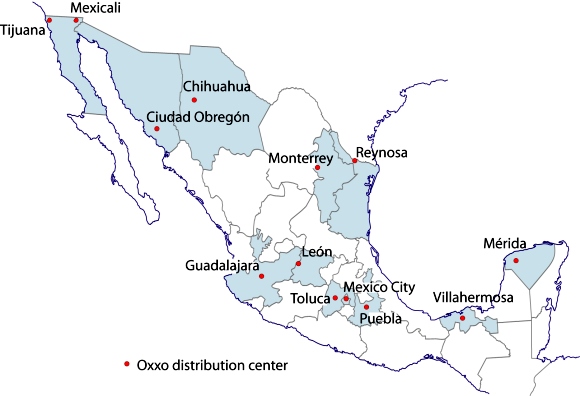
Cities with Oxxo Distribution Centers. Credit: Tony Burton/Geo-Mexico

Cities with Oxxo Distribution Centers. Credit: Tony Burton/Geo-Mexico

It is no coincidence, then, that Oxxo, the nation’s largest convenience store chain, recently opened its 11,000th store in Mexico. Oxxo now serves residents of 350 towns and cities, and plans to add a further 1,037 outlets before the end of this year. Its extensive network is served via a chain of 15 strategically-located distribution centers in the 13 cities shown on the map above.

Related posts:

Fresnillo, Mexico’s leading silver mining town

 Other  Comments Off on Fresnillo, Mexico’s leading silver mining town
Aug 242013
 

The city of Fresnillo, founded in the sixteenth century, is a place that most people speed by en route to somewhere else. Yet Fresnillo, in the state of Zacatecas, holds several surprises. It was once an important city on the colonial silver route (El Camino Real or Royal Road, the spine of the colonial road system in New Spain), and still boasts many fine buildings, including a lovely old theater and several churches.

fresnillo-plcFresnillo is still an important mining center today. Fresnillo plc, incorporated in the UK, is Mexico’s largest single silver mining company and the country’s second largest gold producer. It operates mines in three major mining zones in Mexico—Fresnillo (Zacatecas), Ciénega (Durango) and Herradura (Sonora)—and is actively developing or exploring numerous other sites.

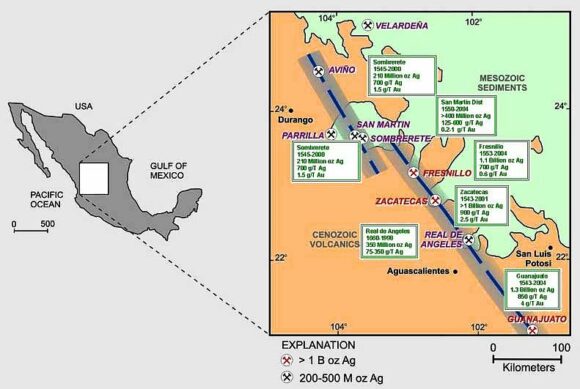
Fresnillo became a major mining center from 1568, when a garrison of soldiers, complete with a fort, was installed in the town to help protect mule-trains carrying silver from Sombrerete (and the San Martín mine) further north and Zacatecas. By the mid-nineteenth century, Fresnillo’s own mines had serious flooding problems. Mine owners sent to England for experienced Cornish tin miners to come and help. The Cornishmen knew how to assemble and operate powerful steam engines, a novelty at that time in Mexico, and a reliable way to help drain deeper mine shafts.

Location of mining districts near Fresnillo. Credit: 321gold.com

Location of mining districts near Fresnillo. Credit: 321gold.com. Click to enlarge

George Ruxton, a nineteenth century traveler and author, described Fresnillo when he visited as “paltry” but “busy and frenzied” with 2500 miners hacking away at the nearby mountains. Ruxton thought the work ethic of the Cornish was superior to other English settlers and to the local Mexicans. He was especially impressed by how the miners had planted a beautiful garden, full of fruit-bearing trees, complete with a fountain and ornamental summerhouse.

Silver bars were regularly taken from Fresnillo to Zacatecas for smelting and subsequent stamping in the Zacatecas mint. The wagon-trains carrying silver bars, called conductas while under military protection, were frequently assaulted by large groups of bandits, up to several hundred strong.

Fresnillo also has significant artistic interest. Two very famous, yet very different, Mexican artists—musician Manuel M. Ponce and painter Francisco Goitia—were born in (or at least very near) the city in the same year, 1882.

The patron saint of silversmiths

From Fresnillo, it is only seven kilometers along a wide, well-paved road to Plateros, a place of pilgrimage. The baroque Santuario de Plateros was built at the end of the eighteenth century to be a suitable residence for the Santo Niño de Atocha and the Señor de Plateros (the patron saint of silversmiths). The fame of the Santo Niño de Antocha spread rapidly following a fight between two miners. One miner was sure he had killed the other but then prayed to this saint for his recovery. Lo and behold, his companion recovered! Ex-votos (retablos) tell the stories of the numerous “miraculous” interventions performed by the Santo Niño de Antocha to resolve all manner of problems in more recent years.

Source: Most of this post is based on chapter 20 of my “Western Mexico: A Traveler’s Treasury” (link is to Amazon’s “Look Inside” feature), also available as either a Kindle edition or Kobo ebook.

Other Mexican mining towns previously described on Geo-Mexico.com include:

New public transportation system should help rejuvenate Acapulco

 Other  Comments Off on New public transportation system should help rejuvenate Acapulco
Aug 222013
 

Several developments connected to public transportation are an integral part of Acapulco’s ongoing efforts to modernize and rejuvenate itself as a tourist destination.

ACAbús

Acapulco city authorities have been working hard to complete a new public rapid transit system called ACAbús in time for the next influx of sun-seeking winter tourists. The system represents an investment of around $140 million, roughly two-thirds for highway and transit stop refurbishment and one-third for operating equipment (vehicles and travel card machines).

acabus

ACAbús will connect the resort’s many tourism attractions and facilities. The main central axis is a 16-km (10 mile) long route from Las Cruces along Avenida Cuauhtémoc to Caleta, with 18 stops along the way. This portion will be confined solely to rapid transit articulated buses. Five trunk routes will supplement this central axis, each with a limited number of stops. The one of interest to most tourists will be that along the main Costera Miguel Alemán highway. When the system is complete, the number of bus routes in Acapulco will be reduced from about 220 to 120, but travel times will actually be greatly improved. Authorities estimate that the system should cut regular traffic by about 25%, and claim that everyone will benefit as it will lead to older vehicles being removed from the roads and a decrease in total emissions.

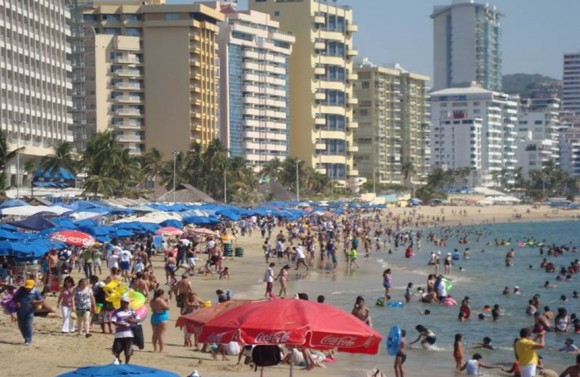
Caleta Beach, Acapulco. Photo: Vanguardia/El Universal

Caleta Beach, Acapulco. Photo: Vanguardia/El Universal

Maribús

At a later stage, the ACAbús system will be complemented by a maritime equivalent Maribús. This water taxi system will operate over about 3 kilometers of coast and have six access wharves: Acapulco Diamante, Puerto Marqués, Icacos, The Maritime Terminal (Terminal Marítima), Playa Manzanillo and Caleta. It would cut some transfer times in half. For example, it is estimated that the Golden Zone-Zona Diamante trip would take about 16 minutes.

Acabici

A bike-sharing system, Acabici, is also planned. This would initially have 450 bikes distributed between 30 “stations”.

The Scenic Alternative

Drivers of private vehicles in Acapulco will benefit from construction of an alternative route to the slow and congested Scenic Highway (Carretera Escénica) that links the resort’s airport to its Zona Dorada (Golden Zone) hotels and main beach, Playa Icacos, via the rapidly growing upscale Acapulco Diamante district. Acapulco Diamante is the newest of Acapulco’s three major tourist zones, known for its exclusive homes, stores, hotels and resorts. ,

The 270-million-dollar project, just begun by Mexican firm ICA, and dubbed Avenida Escénica (Scenic Alternative), is a 5 mile (8 km) toll highway that includes a tunnel 2 miles (3.3 km) long. It will slash travel time to a few minutes, instead of the hour or more sometimes required at present when traffic is heavy. This is the state of Guerrero’s largest infrastructure project for several decades. It will cost around $270 million, involve 1,000 workers and will take two years to complete. When the new link is opened, the tunnel will be the longest highway tunnel anywhere in Mexico.

Related posts:

How globalized is Mexico?

 Excerpts from Geo-Mexico  Comments Off on How globalized is Mexico?
Aug 192013
 

What exactly is globalization?

Globalization can be defined in simple terms as “the process by which events, activities and decisions in one part of the world can have significant consequences for communities in distant parts of the globe.” [Peter Haggett in his Geography (A Global Synthesis), Pearson Education Limited, 2001]. Though globalization began centuries ago with colonial conquests and trade, it has only gained widespread attention in the past few decades.

Globalization is a highly contentious issue. There are major debates as to whether globalization brings more benefits than problems. While many international organizations such as the International Monetary Fund and World Bank are pro-globalization, many individuals and sectors of society remain deeply skeptical, and a powerful anti-globalization movement has arisen in some parts of the world.

How globalized is Mexico?

Several attempts have been made to quantify globalization. In this section we compare two indices which look at how globalized Mexico is compared to other countries.

The KOF Index of Globalization measures three main dimensions of globalization: economic, social and political. Economic globalization considers the long distance flows (exports, imports) of goods, capital and services, as well as political restrictions (tariffs, taxes) to these flows. Social globalization measures the international spread of ideas, information (telephone traffic, internet access) and people (migration, tourism). Several small European countries score well on these first two measures. Political globalization examines the number of embassies a country has, as well as its membership of international organizations and participation in UN peace missions. European countries occupy the first seven places on this dimension. Based on the indices for these three dimensions, an overall index of globalization is calculated.

The 2009 KOF Index used data from 2006 to rank 208 countries. Mexico placed 65th overall, with rankings of 79th for economic, 69th for social, and 80th for political globalization. By comparison, Russia ranked 61st, Argentina 63rd, Brazil 79th, China 91st, Indonesia 100th and India 122nd.

The A.T. Kearney Globalization Index has four main components: economic integration (trade, foreign direct investment), personal contact (telecommunications, travel, remittances), technological connectivity (internet) and political engagement (international treaties, organizations and peacekeeping). The 2006 index ranked 62 countries. Mexico placed 42nd overall, with ranks of between 36 and 41 for each of the four components. For comparison, Russia ranked 47th, Argentina 43rd, Brazil 52nd, China 51st, Indonesia 60th and India 61st.

In Mexico’s case, these two globalization indices give broadly similar results. The data suggest that Mexico is relatively globalized compared to other large emerging countries. However, in the case of the USA, the different methodologies of the two indices produce very different results. The KOF index ranks the USA as 38th out of 208, with rankings of 59th for economic, 56th for social and 9th for political globalization respectively. The A.T. Kearney index places the USA 3rd out of 62 countries, despite its ranks for separate components of 58th for economic, 40th for personal, 1st for technological and 41st for political globalization. The differences between the indices indicate the difficulty of quantifying globalization.

Related posts:

The pattern of homicides in Mexico in 2012

 Mexico's geography in the Press  Comments Off on The pattern of homicides in Mexico in 2012
Aug 172013
 

Homicide rates in Mexico increased between 2010 and 2012, though there is some evidence that they are now beginning to fall again. Did the pattern of homicide rates also change since 2010?

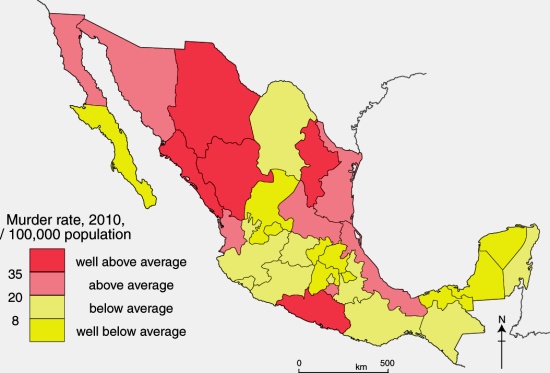
The top map shows the pattern of intentional homicides in Mexico in 2010. As we commented at the time, this map shows “that many northern states like Chihuahua, Sinaloa, Nuevo León and Durango are plagued by drug war violence and have very high murder rates. On the other hand, most states in the south and southeast, like Yucatán, Campeche and Tlaxcala are relatively free of drug war violence and historically have had low murder rates. One significant anomaly in the overall pattern appears to be Guerrero which is well to the south but has a high murder rate and a very significant amount of drug violence.”

Map of intentional homicide rate, 2010

Map of intentional homicide (murder) rate, 2010 Credit: Tony Burton / Geo-Mexico

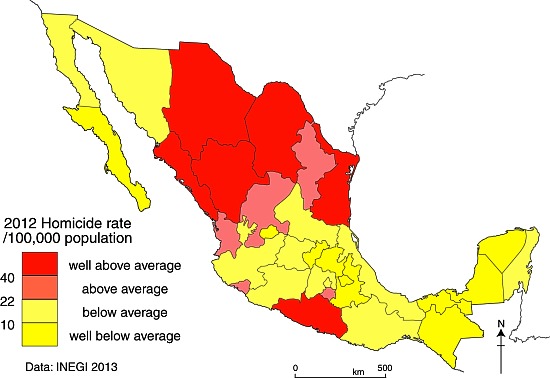
The second map shows the pattern of intentional homicides in Mexico in 2012. (Note that the values on the key are slightly different to reflect the increase in Mexico’s average (nationwide) homicide rate between 2010 and 2012).

Map of homicide rates in Mexico, 2012, Credit: Tony Burton/ Geo-Mexico

Map of intentional homicide (murder) rates in Mexico. Credit: Tony Burton/ Geo-Mexico

At first sight the pattern in 2012 look pretty similar to that for 2010. The adjoining states of Sinaloa, Chihuahua and Durango continue to have rates well above the national average, as does Guerrero further south. However, the homicide rate in Nuevo León, which was “well above average” in 2010 has declined somewhat to “above average” in 2012. Since 2010, the north-eastern state of Tamaulipas has seen its homicide rate increase from “above average” to “well above average”. Perhaps more significantly, the border state of Coahuila has witnessed a jump from “below average” to “well above average”. Homicide rates in the two north-west border states of Baja California and Sonora have fallen since 2010 to “below average”.

Elsewhere, homicide rates have increased in both Zacatecas and in Colima since 2010, while rates in Veracruz have declined to “below average”. The shift in Veracruz means that a broad swathe of southern Mexico, including the Yucatán Peninsula, Oaxaca and Chiapas, now has a homicide rate “below average” or “well below average”, good news for tourists headed for Oaxaca, Cancún and the Riviera Maya!

On a more cautionary note, the state of Michoacán has seen increased violence in 2013; its homicide rate is headed upwards.

The changes in pattern of homicides between 2010 and 2012 are partially attributable to the “zones of contention” between rival drug gangs. For instance, the Knights Templar cartel (currently thought to be Mexico’s third largest cartel, behind the Zetas and the Sinaloa cartel) has its origin in  Michoacán but has expanded its geographic influence very rapidly in the past few years. Equally, the capture of key cartel leaders in recent years seems to herald increased violence as rivals compete to fill the perceived power vacuum left behind. This unfortunate outcome from the arrest of leading cartel operatives is continuing this year following the capture of Zeta leader Z-40.

Related posts:

Mexico’s seven climate regions

 Excerpts from Geo-Mexico  Comments Off on Mexico’s seven climate regions
Aug 152013
 

Climatologists have developed several scientific systems to classify climates. The system developed by Wladimir Köppen in the early 20th century is one of the earliest and best known. The Köppen climate classification system assumes that climate is best reflected in native vegetation and can be accurately classified using seasonal variations in temperatures and precipitation. Mexican climatologists, including Enriqueta García, have proposed minor modifications to the Köppen system to make it more appropriate for Mexico. The following paragraphs reflect García’s revised Köppen system.

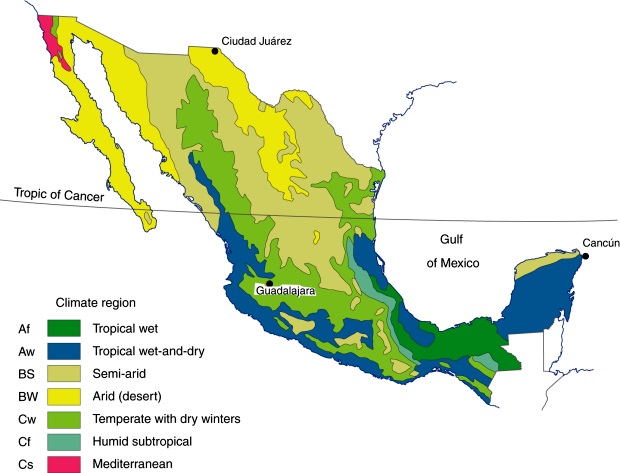
Given that Mexico has many mountains with rapid changes in elevation, temperature and rainfall, applying the Köppen system, even as modified by García, to Mexico can become extremely complicated. A relatively small area of Mexico may include several Köppen climate categories. Aggregating these areas provides a less complicated, more understandable, picture of Mexico’s climates (see map). In this scheme, Mexico has seven main climate regions, as shown on the map:

Major climate regions in Mexico. (Fig 4-5 of Geo-Mexico, the geography and dynamics of modern Mexico). All rights reserved.

Major climate regions in Mexico. (Fig 4-5 of Geo-Mexico, the geography and dynamics of modern Mexico). All rights reserved.

Two tropical climates

Mexico has two tropical climates which have average temperatures of over 18°C (64°F) for all twelve months of the year.

The first, tropical wet (Af in the Köppen system, see map), has at least 60 mm (2.4 in) of rain in every month of the year. This is the climate of the Amazon and Indonesian rainforests. In Mexico this is the climate of the Gulf Coast Plain in southern Veracruz and Tabasco (classic tierra caliente areas). It also occurs in the Oaxaca and Chiapas highlands. The rains fall all year, varying from about 120–150 mm (4–5 in) in April to 380 mm (15 in) in September.

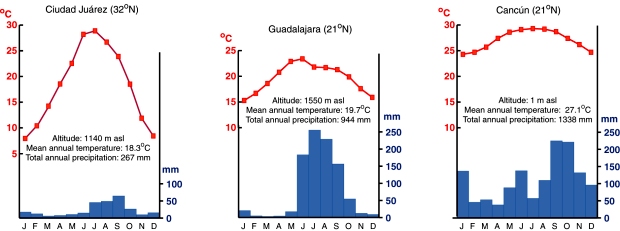
The tropical wet-and-dry (Aw) category (see the climate graph for Cancún) has a pronounced dry season. The dry winter months typically get less than 40 mm (1 in) of rain, compared to over 150 mm (6 in) in each of the summer months. Parts of West Africa, Brazil and India have a similar climate. Much of coastal Mexico, stretching from Nayarit along the Pacific coast all the way to Guatemala, is in this category. It also covers many inland areas along the Pacific coast. Central and northern Veracruz and most of the Yucatán Peninsula also have this tropical climate with summer rains.

Climate graphs for three cities. (Fig 4.6 of Geo-Mexico,)

Climate graphs for three cities. (Fig 4.6 of Geo-Mexico, the geography and dynamics of modern Mexico) All rights reserved.

Two dry climates

Areas with an arid (desert) climate (BW) usually receive less than 250 mm (10 in) of rain a year (see climate graph for Ciudad Juárez). This is the climate of the Sahara Desert and Central Australia. In Mexico dry desert areas include most of Baja California, western Sonora, and the northern section of the Central Plateau. These areas can experience frost and freezing during the winter.

Areas with the second type of arid climate, semiarid (dry steppe) (BS), receive 250–750 mm (10–30 in) of rain a year. This is the climate of the African savanna lands and much of central Asia. In Mexico, this climate region includes most of the Central Plateau as well as western sections of the Western Sierra Madre, northern Yucatán and scattered inland areas as far south as Oaxaca. The rains in this region fall mostly in the summer, and localized heavy thunderstorms are quite common. The southern parts of this climatic region are warmer than the northern parts.

Three temperate zones

Temperate climates typically have average temperatures above 10°C (50°F) in their warmest months, and a coldest month average between 3°C and 18°C (27–64°F). Moisture characteristics distinguish between the three temperate climates.

The temperate with dry winters climate (Cw) is characterized by mild temperatures, low humidity, and summer rainfall ranging from about 600 to 1200 mm (25–45 in) per year (see climate graph for Guadalajara). This is classic tierra templada country. The low nighttime temperatures in winter are typically around 5°C (41°F). Of course, higher elevations have lower temperatures with occasional frost. The highest temperatures usually reach about 35°C (95°F), though temperatures may reach as high as 40°C (104°F). This climate is similar to that of the Kenyan Highlands. In Mexico, this climate includes parts of Nuevo León and Tamaulipas, most of the Western Sierra Madre and many mountainous areas in western, central and southern Mexico. Most of the Volcanic Axis is in this temperate with dry winters zone. Here, the major control as far as temperatures are concerned is altitude, which directly affects precise rainfall amounts and seasonality, resulting in a mosaic of microclimates and natural vegetation regions.

Compared with the temperate with dry winters climate, the humid subtropical (Cf) zone gets more rainfall, is more humid and gets rain throughout the year. The only areas of Mexico with this climate are the eastern slopes of the Eastern Sierra Madre and some parts of the southern mountain systems.

The Mediterranean climate (Cs) is the mild climate associated with Europe’s Mediterranean coast as well as the California coast. The area around Tijuana is the only part of Mexico with this type of climate. This area is relatively arid and gets less than 400 mm (15 in) of rain a year; it is unique in Mexico, being the only place that is dry in summer and gets rain only in winter.

Related posts

Mexico’s position among the most populous countries to 2100

 Updates to Geo-Mexico  Comments Off on Mexico’s position among the most populous countries to 2100
Aug 122013
 

How does Mexico compare with the world’s most populous countries? Available information suggests that in 1500, before the Spaniards arrived, the population of the area that is now Mexico was roughly 15 to 20 million (McCaa 1997). At that time Mexico may have been the third most populous country behind only China and India. However, by 1600 the population had crashed to about 1.6 million, one of the most dramatic population collapses in human history. Mexico did not regain its pre-Columbian population level until about 1900. But the population declined by about 6% during the Mexican Revolution, 1910-1920.

Children in Zitácuaro, Michoacán. Photo: Tony Burton. All rights reserved.

Photo: Tony Burton. All rights reserved.

A recently published UN study, World Population Prospects, The 2012 Revision, enables us to compare Mexico’s population with that of other countries for 1950, 2013, 2050 and 2100. Slow but steady growth brought Mexico’s population up to 28 million by 1950, ranking Mexico 16th just ahead of Spain and right behind the Ukraine. Very rapid growth peaking in the 1970s increased Mexico’s population to about 120 million by 2013. [The UN report quotes Mexico’s 2013 population as 122 million, whereas Mexico’s CONAPO (National Population Commission) estimates the current population is 118.4 million, the difference perhaps due to differing assumptions about international migration.]

This ranked Mexico 11th in the world just behind Japan, but ahead of the Philippines. [The 15 most populous countries in 2013 are China (1,386m), India (1,252m), USA (320m), Indonesia (250m), Brazil (200m), Pakistan (182m), Nigeria (174m), Russia (143m), Japan (127m), Mexico (122m), Philippines (98m), Ethiopia 94m), Vietnam (92m) and Germany (83m)]

By 2020, Mexico will pass Japan to become 10th, the highest it will ever rank except for during the pre-Columbian era.

The UN study forecasts that the Mexican population will grow to 156 million by 2050. This is considerably higher that the Mexico’s National Population Commission (CONAPO) forecast, which uses higher rates of out-migration. In 2050 Mexico will be back in 11th place, having jumped ahead of Russia, but having been passed by Ethiopia and the Philippines. According to the UN study by 2050 India will have passed China, and Nigeria will have replaced the USA as the 3rd most populous.

By 2100 Mexico’s population will be down to 140 million, putting it in 16th place behind Nigeria and five other very rapidly growing African countries: Tanzania, Congo, Uganda, Niger and Kenya. Interestingly, between 2050 and 2100 all of the 31 largest countries are expected to lose population except the USA, the Philippines, and 12 African countries. The world’s total population will have essentially leveled off by 2100 at about 10.9 billion with African countries continuing to grow while European and Asian countries experience population declines. Of course many unexpected demographic changes may occur between now and 2100.

According to the study, Mexico’s life expectancy at birth will be 90.0 years in 2100, above the USA’s level of 88.8 years, but behind Canada at 91.2 years. Mexico’s total fertility rate is forecast by the UN at 1.99 children per women in 2100 which is considerably higher than rates forecast by Mexico’s CONAPO and other demographers.

Reference:

Robert McCaa, Robert. 1997. “The Peopling of Mexico from Origins to Revolution”, preliminary draft for Richard Steckel & Michael Haines (eds.), The Population History of North America, Cambridge University Press, 1997.

Related posts:

Has the homicide rate in Mexico begun to fall?

 Mexico's geography in the Press, Updates to Geo-Mexico  Comments Off on Has the homicide rate in Mexico begun to fall?
Aug 102013
 

The National Statistics Institute (INEGI) recently published state-by-state intentional homicide (murder) statistics for 2012. The values calculated by INEGI for rates/100,000 population rely on CONAPO’s estimates for the population each year. The INEGI report includes homicide trends from 1990 to 2012.

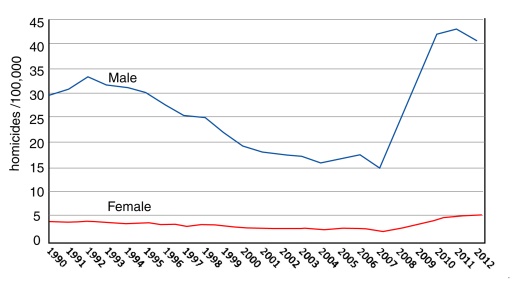
From 1992 to about 2007, homicide rates in Mexico declined (see graphic) to 8/100,000 in 2007. However, during former President Felipe Calderón’s “War on Drugs”, the homicide rate almost tripled. In 2010 and 2011, the national rate averaged 23/100,0000. These national averages mask a huge difference between males and females. For example, the 2011 rate for males was 43/100,000, about eight times higher than the 5/100,000 recorded for females. As the graphic shows, there is some slight evidence that the homicide rate for males is beginning to fall again.

Trends in homicide rate, 1990-2012 (Data: INEGI)

Trends in homicide rate, 1990-2012 (Data: INEGI)

Mexico’s intentional homicide rate is about the same as that in Brazil (21/100,000). Both countries have rates that are very high compared to Peru (10), the USA (5), Canada (1.6) or the UK (1.2). On the other hand, the intentional homicide rates in Mexico and Brazil are quite low compared to Honduras (92), El Salvador (69) Venezuela (45) and South Africa (32). [Figures for other countries from wikipedia]

In a later post we will look at the pattern of homicides in 2012, and compare a map of homicide rates in 2012 to our previous analysis of the homicide pattern in 2010:

Does tourism in Acapulco match Butler’s resort cycle model?

 Excerpts from Geo-Mexico  Comments Off on Does tourism in Acapulco match Butler’s resort cycle model?
Aug 082013
 

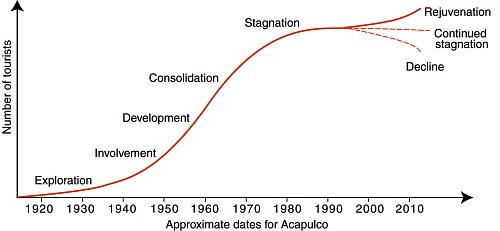
Butler’s resort cycle model applied to Acapulco

Butler’s model (see graphic below) describes the evolution of a tourist resort. His model, similar to a product life cycle model, is quite a good fit with the evolution of Acapulco, a traditional resort which evolved over several decades.

Butler's Model applied to Acapulco (Geo-Mexico Fig 19.7; all rights reserved)

Butler’s Model applied to Acapulco (Geo-Mexico Fig 19.7; all rights reserved)

The model would not be expected to work as well with resorts such as Cancún and Huatulco, which were planned from the start and developed rapidly with the infusion of millions of dollars of federal funds.

In the case of planned resorts, the stages of exploration and involvement are unlikely to apply. The adapted model for such places might perhaps start at the development phase.

Reference for Butler’s Model:

Butler, R.W. 1980. The Concept of the tourist area cycle of evolution: Implications for management of resources. Canadian Geographer 24 (1): 5‑12.

Related posts

Aug 052013
 

A recent study published by the Clean Air Institute analyzed air pollution in 22 Latin American cities:

  • Air Quality in Latin America: An Overview (May 2013; pdf file)

Six Mexican cities were included in the study: Mexico City, Guadalajara, Monterrey, Puebla, Ciudad Juárez and León. However, only limited data were available for Puebla, Cd. Juárez and León. One of the main conclusions of the study is that Mexico has about the worst urban air pollution in Latin America. It is believed to be responsible for about 15,000 deaths in Mexico each year.

The focus was on the following air pollutants:

  1. Particulate matter is divided into two measures; particles less 2.5 microns in diameter (PM2.5) and those less than 10 microns (PM10). PM2.5 pollution is extremely harmful because it penetrates deep into lungs causing inflammation and worsening heart and lung diseases. This can be fatal.
  2. Ozone is formed in the air when oxides of nitrogen and volatile organic compounds mix with intense sunlight. The very intense sunlight in Mexican cities makes them particularly prone to ozone pollution.
  3. Nitrogen dioxide (NO2) is caused by high temperature combustion of fossil fuels in vehicles, factories and power plants. It can aggravate lung diseases as well as contribute to ozone and fine particle pollution.
  4. Sulfur dioxide (SO2), which also comes from burning fossil fuels, contributes to heart and respiratory disease. Unfortunately, not all of the 22 cities had data on all four pollutants. Consequently comparisons among cities are a bit limited.

According to the study, Mexican cities had some of the worst urban particulate pollution in Latin America, significantly above WHO standards. Of the 16 cities with data, Monterrey had by far the worst PM10 pollution with 85.9 micrograms per cubic meter (ug/m3); considerably worse than the perennially dusty Lima with 62.2 ug/m3. Guadalajara came second with 70.1 ug/m3, Mexico City was 6th with 57.0 ug/m3, and León placed 11th with 39.0 ug/m3, even worse than Sao Paulo at 36.5 ug/m3. Though not in the study, Mexicali has worse PM10 pollution than Monterrey. Also Monterrey’s PM10 levels are much better than many major world cities including Cairo, Delhi, Kolkata, Beijing, Chengdu, Bangalore, Shanghai, Dacca, Jakarta, and Karachi.

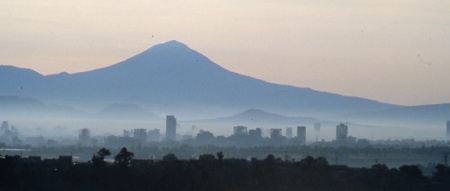
Mexico City air quality in 1980 (Photo: Tony Burton)

Mexico City air quality in 1980 (Photo: Tony Burton)

Mexico did a bit better with respect to the more serious PM2.5. Of the 11 cities with data, Bogota was worst with 35.1 ug/m3 followed by Lima at 31.5ug/m3 and San Salvador and Montevideo at 28.0 ug/m3. The two Mexican cities with data, Mexico City (26.2 ug/m3) and Monterrey (25.9 ug/m3) were 6th and 8th.

Mexican cities also have some of the highest levels of ozone pollution. Of the ten cities with data, five of the six worst were Mexican cities. Guadalajara had the highest ozone pollution with 69.3 25.9 ug/m3 followed closely by León 68.9 at ug/m3. Mexico City was 4th (59.4 ug/m3); Monterrey was 5th (55.2 ug/m3); and Cd. Juárez came 6th (46.3 ug/m3), just ahead of Quito (44.1). Much better ozone levels were recorded by Sao Paulo (36.0 ug/m3), Santiago (28.8 ug/m3) and Bogota (21.1 ug/m3).

Cities in Mexico also had high levels of nitrogen dioxide. The highest levels were in Montevideo (70.0 ug/m3), but Guadalajara (57.2ug/m3), Mexico City (54.2 ug/m3) and León (45.5 ug/m3) placed 2nd, 3rd and 4th worst among the 14 cities with data. Monterrey was much better with the third lowest nitrogen oxide level (29.0 ug/m3), trailing only Lima (12.8 ug/m3) and Quito (23.3 ug/m3).

Mexican cities were also among the worst in terms of sulfur dioxide pollution. Of the 13 cities with data, León had by far the highest level with (23.4 ug/m3), followed by Medellin (16.0 ug/m3). Mexico City was 3rd worst (15.3 ug/m3); Monterrey was 4th (13.1 ug/m3); and Guadalajara was 6th (8.6 ug/m3).

In summary, the study indicates that Mexico has about the worst urban air pollution in Latin America. Fortunately, Mexico City, which used to be considered one of the most polluted cities in the world, has significantly improved its air quality in the last few decades. (see Rhoda and Burton, Geo-Mexico: The geography and dynamics of modern Mexico, p 177)

On the other hand, other major cities in Mexico have not had the same experience. The data in this study appear to suggest that among Mexico’s three biggest cities, Guadalajara has the worst air pollution followed by Mexico City and then Monterrey. (This study found insufficient data for comparisons with Puebla, Cd. Juárez and León.)

Other posts on urban air pollution:

Aug 032013
 

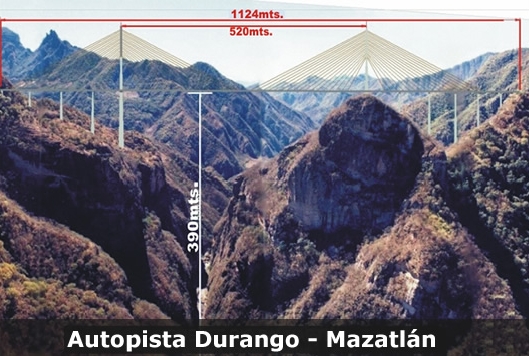
It currently takes about 5 hours to drive from the city of Durango to the Pacific coast resort of Mazatlán, but this time will be slashed to under 3 hours once the new 1.2-billion-dollar, 4-lane, 230-kilometer highway between the cities is complete.  The Baluarte Bridge is already in place and was officially opened in January 2012, but the highway is still incomplete and not yet open. The highway is due to be completed by later this year, rainy season permitting.

This post features two videos about the Bridge. The first 4-minute video (below) is in English and is a promotional short for VSL International, one of the construction firms building the bridge. It includes footage of the amazing building techniques that were required.

The main span of the Baluarte Bridge is 520 meters in length and is 402 meters above the river (rather than the 390 m in the picture below), making it not only the tallest cable-stayed bridge in the world, but the cable-stayed bridge with the longest span in the Americas.

puente-baluarte

Puente Baluarte. Photo: TRADECO

The second video (below), first aired on National Geographic channels in Latin America, is 43 minutes long and entirely in Spanish (no subtitles). Its English-language equivalent, entitled Megastructures: World’s Highest Suspension Bridge, has been shown in the USA and Canada, but is not currently viewable online.

There is a minor geographic error in the first minute of this video when it shows a graphic placing the Baluarte Bridge at the junction of two distinct highways (Durango-Mazatlán and Tampico-Durango). The producers have taken some “geographic license” here since the two highways actually meet in the vicinity of the city of Durango, a considerable distance east of the Baluarte Bridge, which is more properly located on the boundary between the states of Durango and Sinaloa, mid-way between Durango and Mazatlán.

While this Spanish language version is quite long winded in places, it includes some spectacular photos and graphics, including the celebration held when the two crews working from opposite sides of the ravine finally met each other in the middle!

In order to ensure safety, the Baluarte Bridge is kitted with an array of sensors which send real time information to engineers in Mexico City who can monitor every aspect of the bridge and its response to every change in wind direction, strength, traffic, etc.

The construction project is not without its critics. While tourism officials expect a massive increase in the number of visitors to Mazatlán, and a doubling of the number of hotel rooms in that resort in the next 10-15 years, the local residents of several villages and ejidos along the route of the new highway claim they have not yet been fully paid for allowing construction crews access to their property or compensated for the damage caused to their pine forests, farmland and water supplies. The new highway may also “change the criminal dynamic” in this mountainous area, the more remote parts of which have a long and troubled history of violence and drugs trafficking.

We’ll post again about this astonishing engineering achievement when the new highway is completed and open to regular traffic, hopefully later this year! Meanwhile, it’s back to drawing an updated version of Figure 17.4 of Geo-Mexico, the geography and dynamics of modern Mexico (currently on special offer at Amazon.com), a map showing the average driving times by road from the city of Durango to everywhere else in Mexico.

Related posts:

Aug 012013
 

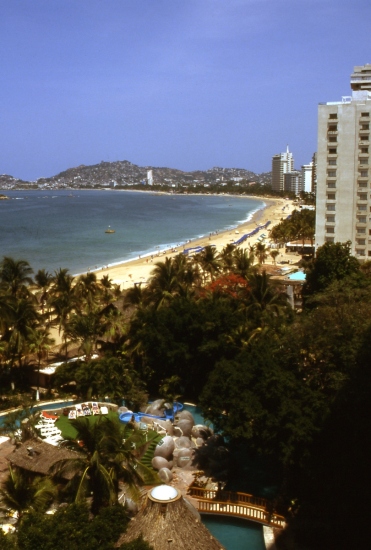
Acapulco was Mexico’s first major resort. Overlooking the Pacific, Acapulco had been fashionable among wealthy Mexicans since the 1920s. The first road from Mexico City to Acapulco opened in 1927; this became a four-lane highway in the 1955 and is now a toll super-highway.

Acapulco, Mexico's first major resort. Photograph by Tony Burton. All rights reserved.

Acapulco, Mexico’s first major resort (Tony Burton; all rights reserved)

The development of Acapulco during the 1940s and 1950s, with new roads, hotels and an airport, provided alternative employment for peasants who had left their land, and helped to reduce the flow of migrants out of the poverty-stricken state of Guerrero. Some viewed Acapulco as a growth pole for further coastal development, but most other coastal towns continued to lag behind for decades. By the 1950s, it had become the playground for Hollywood’s jet set, the world’s first major resort to rely mainly on tourists arriving by air. In the 1960s, Acapulco’s city center was redeveloped and a new airport was built inland.

Acapulco began a prolonged period of stagnation during the 1970s, struggling to cope with urban growth, the provision of adequate urban services and air and water pollution. In the past decade, it has turned things around based on a series of major gated hotel developments that overcome visitors’ security concerns.

Related posts