RR-TB

Thirty years ago: the 1985 Mexico City earthquakes, a major disaster

 Excerpts from Geo-Mexico  Comments Off on Thirty years ago: the 1985 Mexico City earthquakes, a major disaster
Sep 172015
 

The worst earthquake disaster in modern Mexican history occurred thirty years ago this week. On Thursday 19 September 1985 a magnitude 8.1 earthquake struck at 7:19 a.m. and lasted a full two minutes. It was followed by a 7.5-magnitude earthquake 36 hours later.

Mexico's position in relation to tectonic plates

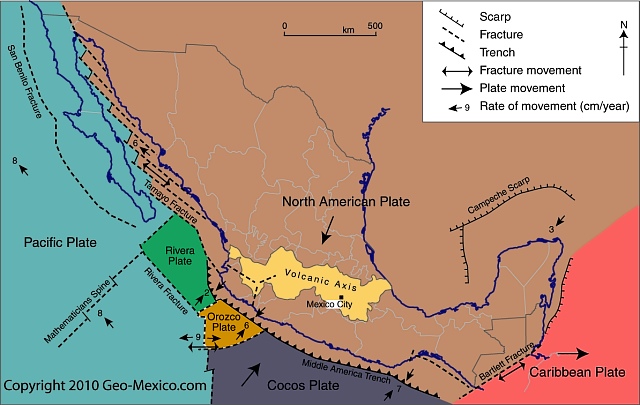
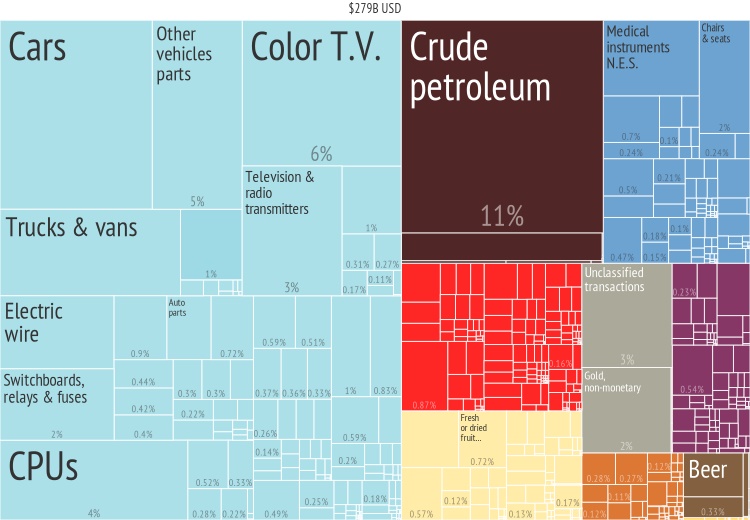
Mexico’s position in relation to tectonic plates.Map: Geo-Mexico.com; all rights reserved

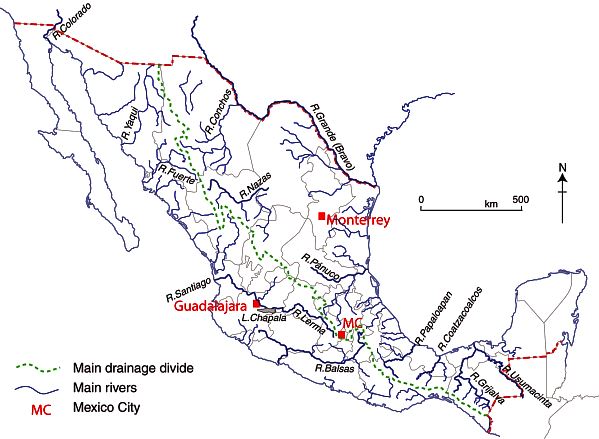
These earthquakes resulted from the Cocos Plate (see map) pushing under the North American Plate. While the epicenters were 50 km off Mexico’s Pacific coast, near the Michoacán-Guerrero border, most of the damage occurred 350 km (215 mi) away in Mexico City because the city center’s subsoil, being former lakebed, is very unstable. The clay and silt beneath the city is up to 50 m thick in the area that received most damage. Geologists have likened the effects of the earthquake to the shaking of a bowl of jelly.

Further damage was caused by liquefaction, a process in which water is squeezed rapidly through the pore spaces in soil, dramatically reducing its cohesion. The sediments beneath Mexico City amplified the ground motions during the earthquakes and many buildings were stressed well beyond building code limits.

Damage from Mexico City's 1985 earthquake

Damage from Mexico City’s 1985 earthquake. Photo: Tony Burton; all rights reserved

Damage estimates range upward to 10,000 deaths, 50,000 injured and 100,000 homeless. More than 500 buildings collapsed, and a further 600 of the 3000 damaged structures were subsequently razed to the ground. The destruction was concentrated in a relatively small area near the city center and included many public buildings, such as government offices, as well as 11 hospitals and clinics, numerous multi-story apartment blocks, 11 hotels and 10 banks. More than 1600 school classrooms were damaged.

Buildings of between 6 and 15 stories were especially hard hit. The underbelly of the city was exposed; dozens of textile sweatshops were destroyed. The damages revealed many instances of poor construction standards and of poor enforcement of building codes. Well-built high rises such as the Latin American tower, designed to be earthquake-proof, were unscathed.

The total cost to the Mexican economy was estimated to exceed $5 billion, equivalent to 2% of the country’s GDP (Gross Domestic Product).

The disastrous 1985 earthquakes led to much tighter building codes, equal or superior to anywhere in the world, and to the formation of well-trained emergency search and rescue brigades. They also resulted in the establishment of a Seismic Alarm System which provides a 50-second warning for any earthquake measuring over 6.0 on the Richter scale occurring off the coast of Guerrero or Michoacán.

This is an excerpt from chapter 2 of Geo-Mexico: the geography and dynamics of modern Mexico.  Many more details of Mexico’s geology and landforms are analyzed in other parts of the book; take a look using Amazon.com’s Look Inside feature before buying your copy today!

Related posts:

Mexico’s urban hierarchy

 Excerpts from Geo-Mexico  Comments Off on Mexico’s urban hierarchy
May 072015
 

Mexico’s urban hierarchy is still very dominated by Mexico City, its primate capital city. Even though the Mexico City urban area (ZMCM) has grown relatively slowly during the past 30 years, by 2000 it had a population of 17.8 million, almost five times larger than Guadalajara, instead of twice as large as expected from the rank size rule.

The concept of urban hierarchy is more complicated than the rank-size rule, which is based solely on population size. Urban hierarchy is based more on the functions provided by urban centers and their relationships with their hinterlands. An urban hierarchy is conceptually similar to an organization chart or layered pyramid. At the top is the largest center, the dominant financial, economic, and often political center of the country. It has the widest range and most complex set of urban functions and services such as international banking, stock exchanges, trade organizations, and major media and communications centers. It is the center of power of the country: the place where the most important decisions are made.

Fig 21-2 of Geo-Mexico; all rights reserved

Fig 21-2 of Geo-Mexico; all rights reserved

At the second level are a few regional cities that are the centers of power in their region or hinterland. They provide high level services that are not available elsewhere in the region. Such services might include investment banking, an important international airport, as well as sophisticated business, legal and medical centers. At the third level are a larger number of subregional centers which are the focus of economic activity in their subregion. At each succeeding lower level, there are a greater number of centers serving as the economic foci of their smaller hinterlands.

Often a center’s population is a guide to its level in the hierarchy, but not always. Some centers may have a large population, but do not provide a wide range of key economic functions to surrounding areas. For example, Puebla is Mexico’s fourth largest urban area, but does not serve as a real center for a national region because it is so close to Mexico City. In other words, Mexico City is so economically dominant in central Mexico that Puebla has been unable to carve out a substantial hinterland of its own. The same can be said for Toluca, Mexico’s fifth largest urban area.

Tourist centers like Cancún and Acapulco are other examples of cities that have a reduced regional importance despite their relatively large populations. They provide vacation and recreation services for visitors from around the world. However, neither is a state capital, and they are not necessarily the key functional center in their respective regions.

Given their complexity, the specific delineation of urban hierarchies has often been as much art as science. So far, no uniformly accepted, easy to use criteria have been developed for this purpose. Efforts to delineate urban hierarchies have traditionally used information on the range of services provided; financial, communication and transportation flows; as well as a center’s location, its surrounding hinterland, and the distance to competing centers.

Mexico City is at the apex on the Mexican urban hierarchy; Guadalajara and Monterrey are key second level cities. Beyond these three centers, there is less agreement concerning the appropriate levels of other urban centers. Some think there are only two genuine level two cities, while others have argued that Toluca, Tijuana and Ciudad Juárez should also be considered level two cities. There is even less agreement when it comes to specifying cities in levels three and four. The exact delineation of the levels is less important than understanding the basic concepts of urban hierarchy and realizing that a city’s level is related to the range of functions it provides to its surrounding hinterland.

The suggested current urban hierarchy of Mexico (see map) is based on objective and subjective information on the urban center itself, as well as the population in its hinterland and its distance from a competing urban center. This hierarchy is only suggestive. Intermediate levels could be added indicating centers that could arguably be included in either the level above or level below.

The current hierarchy is not static and is very different from the urban system of the Colonial era, or even of the 19th century. The one constant is that Mexico City has always been at the apex of the hierarchy. The positions of  individual cities may change drastically with changing economic and political conditions. For example, Guanajuato was once an important level two city, but with the decline of its silver mines, it dropped below level five.

Related posts:

The spatial diffusion of Banamex branches across Mexico prior to 1960

 Other  Comments Off on The spatial diffusion of Banamex branches across Mexico prior to 1960
Jan 102015
 

This post looks at where branches of Banamex (Banco Nacional de México) were founded in the period prior to 1960. Banamex is one of the oldest banking institutions in Mexico. It is now a subsidiary of Citigroup, but remains the second largest bank in the country after BBVA Bancomer.

Diffusion of Banamex branches across Mexico prior to 1960

Diffusion of Banamex branches across Mexico prior to 1960. Click to enlarge

Banamex was formed on 2 June 1884 from the merger of Banco Nacional Mexicano and Banco Mercantil Mexicano, two banks that had only been operating for a couple of years. Shortly after its founding, Banamex had branches in Mexico City, Mérida, Veracruz, Puebla, Guanajuato, San Luis Potosí, and Guadalajara.

The maps to the left are based on Figure 8 of Las Regiones Geográficas en México by Claude Bataillon (8th edition, 1986, Siglo Veintiuno Editores).

Each dot represents the location of a branch of Banamex in the year shown. For simplicity’s sake, it is assumed that all branches present on any earlier map continued to exist through to 1960, and did not close or relocate in the interim.

The concept of spatial diffusion looks at the spread of an innovation, whether a new idea, technique, good, service or brand. The spatial diffusion of information or of the adoption of innovations is an important subset of spatial interactions. Looking at the spatial diffusion of a banking network offers lots of interesting insights into how Mexico’s economic geography has changed over the years.

There are three basic types of diffusion. The first is relocation diffusion where people travel or migrate and bring their cultural and technological practices with them. For example, modern studies in the genetics of corn (maize) have established that ancient Mexicans first domesticated corn in the Balsas valley. They then migrated both northwards and southwards, taking the practice of cultivating corn with them.

The second is contagious diffusion, which generally spreads from person to person and exhibits strong distance decay. An example is the spread of the Jehovah’s Witness faith in Mexico which required a considerable amount of face-to-face personal interaction. Many diseases also spread by contagious diffusion.

The third is hierarchical diffusion, which spreads across higher levels of a hierarchy and then down to lower levels. This is often how information from the top of an organization reaches those at the bottom. An example is the government’s 1970s family planning program that was first adopted in large cities, then smaller cities, and eventually penetrated into rural areas.

Combinations of these three types are also possible. One relatively recent example is the spread of the H1N1 influenza virus in early 2009. First reports were that it started in a rural village, probably in Oaxaca, and spread by contagious diffusion to others in the village. From there an infected person temporarily relocated to Mexico City where the flu again spread by contagious diffusion. From Mexico City, the top of the Mexican hierarchy, it spread down the hierarchy as carriers of the virus traveled to smaller Mexican cities and to other cities worldwide.

In the case of the diffusion of Banamex branches shown on the maps, the main type of diffusion involved is hierarchical. In this case, given that Banamex is a banking institution, the hierarchy reflects where most economic activity is taking place at the time. (There would be little point in placing a new branch in a location where little money was in circulation).

The 1930 distribution of Banamex branches looks to be quite scattered across the country, though Baja California and north-west Mexico have no branches and fall outside the network. By 1940 more additional branches have opened in the northern half of Mexico than the southern half, and the north-south economic divide that we have commented on in many previous posts is beginning to become apparent. Between 1940 and 1952 many new Banamex branches are added in central Mexico (this is the period when in-migration was turning Mexico City into a monster) and along the west coast, following the line of Highway 15 which runs from Guadalajara to the border with California. Overall, the north-south divide is now quite clear.

Between 1952 and 1960 additional branches open close to the US border, a branch finally reaches Baja California Sur (in La Paz) and the economic dominance of northern Mexico over southern Mexico is clearly established.

One of the most striking features, when comparing all four maps, is how the number of Banamex branches in southern and south-eastern Mexico (defined as the states of Chiapas, Tabasco, Campeche, Yucatán and Quintana Roo) barely changed between 1930 and 1960.

It would be interesting to update this example with similar maps for more recent years. Please contact us if you have access to suitable data or know where such data may be found.

Other posts related to the concept of diffusion:

Another instance of diffusion, of cholera in Mexico during the 1991-1996 epidemic, is mapped and discussed in chapter 18 of Geo-Mexico: the geography and dynamics of modern Mexico. Geo-Mexico also includes an analysis of the pattern of HIV-AIDS in Mexico, and of the significance of diabetes in Mexico.

The spatial development of Mexico’s railway network

 Excerpts from Geo-Mexico  Comments Off on The spatial development of Mexico’s railway network
Dec 202014
 

At the end of the nineteenth century, during the successive presidencies of Porfirio Díaz, railway building leapt forward. Díaz aggressively encouraged rail development through generous concessions and government subsidies to foreign investors. By 1884 Mexico had 12,000 km of track, including a US-financed link from Mexico City to the USA through Torreón, Chihuahua and Ciudad Juárez. A British company had completed lines from Mexico City to Guadalajara, and from Mexico City via Monterrey to Nuevo Laredo.

Fig. 17.2 The development of Mexico's railway network

Fig. 17.2 The development of Mexico’s railway network. Copyright: Geo-Mexico; all rights reserved

By the start of the twentieth century, additional tracks connected Guadalajara, San Luis Potosí and Monterrey to the Gulf coast port of Tampico. A line connecting the Pacific and Gulf coasts was also completed. Durango was now connected to Eagle Pass on the US border. A second line to Veracruz was constructed, with a spur to Oaxaca. Laws passed in 1898 sought to bring order to the rapid and chaotic expansion of Mexico’s rail system. Foreign concessions were restricted. Subsidies were only made available for the completion of missing links such as lines to Manzanillo and the Guatemala border. Efforts were made to standardize track gauges.

After the Revolution, network improvements were hindered by poor administration, corruption, labor unions and a shift of government priority to roads. The west coast railroad from Sonora to Guadalajara was completed in 1927. The Yucatán Peninsula was joined to the national network in the 1950s and the famous Chihuahua to Los Mochis line through the Copper Canyon was completed in 1961, finally linking Texas and Mexico’s northern plateau to the Pacific Ocean.

Related posts:

Mexico’s golden age of railways

 Excerpts from Geo-Mexico  Comments Off on Mexico’s golden age of railways
Nov 302014
 

Early concessions (the first was in 1837) came to nothing. By 1860 Mexico had less than 250 km of short disconnected railroad lines and was falling way behind its northern neighbor, the USA, which already had almost 50,000 km. Political, administrative and financial issues, coupled with Mexico’s rugged topography, also prevented Mexico from keeping up with other Latin American nations. Mexico City was finally linked by rail to Puebla in 1866 and Veracruz in 1873.

In deciding the best route for the Veracruz-Mexico City line, Arthur Wellington, an American engineer, developed the concepts which later became known as positive and negative deviation. At first glance, it might be assumed that the optimum route for a railway is the shortest distance between points, provided that the maximum possible grade is never exceeded. Negative deviations lengthen this minimum distance in order to avoid obstacles such as the volcanic mountains east of Mexico City: the Veracruz line skirts the twin volcanic peaks of Popocatepetl and Ixtaccihuatl before entering Mexico City from the north-east. Positive deviations lengthen the minimum distance in order to gain more traffic.

Detail of lithograph by Casimiro Castro of Railway near Orizaba, Veracruz

Detail of lithograph by Casimiro Castro of Railway near Orizaba, Veracruz

At the end of the nineteenth century, during the successive presidencies of Porfirio Díaz, railway building leapt forward. Díaz aggressively encouraged rail development through generous concessions and government subsidies to foreign investors. By 1884 Mexico had 12,000 km of track, including a US-financed link from Mexico City to the USA through Torreón, Chihuahua and Ciudad Juárez. A British company had completed lines from Mexico City to Guadalajara, and from Mexico City via Monterrey to Nuevo Laredo.

Different gauge tracks typified a system based on numerous concessions but no overall national plan. By the turn of the century, additional tracks connected Guadalajara, San Luis Potosí and Monterrey to the Gulf coast port of Tampico. A line connecting the Pacific and Gulf coasts was also completed. Durango was now connected to Eagle Pass on the US border. A second line to Veracruz was constructed, with a spur to Oaxaca. Laws passed in 1898 sought to bring order to the rapid and chaotic expansion of Mexico’s rail system. Foreign concessions were restricted. Subsidies were only made available for the completion of missing links such as lines to Manzanillo and the Guatemala border. Efforts were made to standardize track gauges.

However, the country’s 24,000 km railroad network still had serious deficiencies. There were only three effective connections from the central plateau to the coasts. There were no links from central Mexico to either the Yucatán Peninsula or to the northwestern states of Nayarit, Sinaloa, Sonora and Baja California. The only efficient way to move inland freight from Chihuahua, Torreón, Durango or Ciudad Juárez to the Pacific was either north through the USA or all the way south and through Guadalajara to Manzanillo. The Sonora railroad linked Guaymas and Hermosillo to the USA, but not to the rest of Mexico.

Despite their weaknesses, railroads revolutionized Mexico. The railroads had average speeds of about 40 kph (25 mph) and ran through the night. They were five to ten times faster than pre-railroad transport. They lowered freight costs by roughly 80%. They shrank the size of Mexico in terms of travel time by a factor of between five and ten. They were also much cheaper and far more comfortable than stagecoaches. The estimated savings from railroad services in 1910 amounted to over 10% of the country’s gross national product. Between 1890 and 1910, the construction and use of railroads accounted for an estimated half of the growth in Mexico’s income per person. In addition, the railroads carried mail, greatly reducing the time needed for this form of communication. Clearly, the benefits of railroads far outweighed their costs.

Foreign companies gained mightily from their investments building railroads, which were almost entirely dependent on imported locomotives, rolling stock, technical expertise, and even fuel. But Mexicans also benefited enormously; in the early 1900s over half of the rail cargo supplied local markets and industries. The railroads thrust much of Mexico into the 20th century.

Cities with favorable rail connections grew significantly during the railroad era while those poorly served were at a severe disadvantage. The speed and economies of scale of shipping by rail encouraged mass production for national markets. For example, cotton growing expanded rapidly on irrigated farms near Torreón because the crop could be shipped easily and cheaply to large textile factories in Guadalajara, Puebla and Orizaba. Manufactured textiles were then distributed cheaply by rail to national markets. Elsewhere, the railroads enabled large iron and steel, chemical, cement, paper, shoe, beer and cigarette factories to supply the national market.

On the other hand, most Mexicans still lived far from railroad lines and relied on foot or mule transport while practicing subsistence agriculture. In addition, the cost of rail tickets was prohibitively expensive for many Mexicans; paying for a 70 km (43 mi) trip required a week’s pay for those on the minimum wage. The railroads greatly expanded the gap between the ‘have’ and the ‘have not’ areas of the country. Almost all the Pacific coast and most of southern Mexico did not benefit from the railroads. Such growing inequalities contributed to the Mexican Revolution.

After the Revolution, network improvements were hindered by poor administration, corruption, labor unions and a shift of government priority to roads. The west coast railroad from Sonora to Guadalajara was completed in 1927. The Yucatán Peninsula was joined to the national network in the 1950s and the famous Chihuahua to Los Mochis line through the Copper Canyon was completed in 1961, finally linking Texas and Mexico’s northern plateau to the Pacific Ocean.

In the second half of the 20th century, the rapidly improving road network and competition from private autos, buses and, later, airplanes caused railroad traffic to decline significantly. Freight traffic on the nationalized railroad maintained a competitive advantage for some heavy shipments that were not time sensitive, but for other shipments trucks became the preferred mode of transport. The current system, with its roughly 21,000 km of track, is far less important to Mexico’s economy than it was a century ago.

Related posts:

Oct 232014
 

The online Atlas of Economic Complexity is now interactive, allowing users to choose and combine a large number of variables related to imports, exports, date and country. In the webpage’s own words, it is “a powerful interactive tool that enables users to visualize a country’s total trade, track how these dynamics change over time and explore growth opportunities for more than a hundred countries worldwide.”

What is economic complexity?

A country with a high Economic Complexity has a wide range of complex knowledge capabilities related to productive enterprises. Its economy is likely to produce sophisticated products that require a very wide and diverse set of knowledge capabilities. For example, relatively few countries have the capabilities to produce highly complex chemicals or pharmaceuticals, since their production requires very specialized equipment and very precise measuring instruments. Equally, very few countries have nuclear power stations or space stations, since they lack the range of knowledge capabilities needed to build them. At the other end, a very large number of countries have far less complex economies that are capable of producing simple products (basic foods, mineral ores, lumber, garments, shoes, glass, kitchen utensils, furniture) but not products involving more complicated processes or technology

We first discussed the Atlas in 2012 in How “complex” is the Mexican economy?, when we noted that the Atlas ranked Mexico’s Economic Complexity Index (ECI) as #20 of the 128 countries studied. The interactive nature of the online Atlas has added the opportunity to explore many more trends in trade, generating a range of related, visually-appealing infographics.

In particular, choosing Mexico as the country, the Atlas can answer questions such as:

  • What does Mexico import and export?
  • How has Mexico’s trade evolved over time?
  • What are the drivers of Mexico’s export growth?
  • Which new industries are likely to emerge in Mexico? Which are likely to disappear?
  • What are the GDP growth prospects of Mexico over the next 5-10 years, based on its productive capabilities?

Playing with the variables and dates in the Atlas is a really interesting way to explore just how Mexico’s exports and imports have changed over the years. For example, compare these infographics for Mexico’s exports in 1964 and 2010 respectively:

What_did_Mexico_export_in_1964_

Mexico’s exports in 1964

Mexico's exports in 2010

Mexico’s exports in 2010

It is sometimes hard to imagine just how much Mexico has changed in the past fifty years! Overall, at rank #20, Mexico turns out to have an unusually high Economic Complexity Index given its income level. (All the other countries in the top 20 have significantly higher incomes than Mexico).

According to the Atlas, during the rest of this decade Mexico’s GDP should grow relatively rapidly, bringing its GDP rank more in line with its Economic Complexity Index. In general, analyses in the Atlas indicate that during the last few decades countries with higher than expected ECIs compared to their income levels experience more rapid economic growth.

Note, though, that while this relationship is empirically true, it does not explicitly include other factors thought to be important to economic growth such as governance and institutional quality, corruption, political stability, measures of human capital and competitiveness indicators.

Related posts

Mexico’s annual GDP/person now stands at $16,463

 Updates to Geo-Mexico  Comments Off on Mexico’s annual GDP/person now stands at $16,463
Sep 292014
 

Recent World Bank figures reveal that Mexico’s GDP/person in 2013 reached $16,463 a year, an increase in GDP/person of 1.8% since 2012. (All figures in US dollars). Mexico’s 2013 GDP/capita is well above the Latin America and Caribbean average of $14,978.

The GDP figures are based on purchasing power parity (PPP) which overcomes gross distortions resulting from differences in exchange rates. For example, a haircut of the exact same quality might cost $15 in the USA, $5 in Mexico and $1 in China. Using the PPP approach, this same haircut would count as a $15 contribution to the GDP of each of the three countries.

Mexico’s GDP/person has grown at an average rate of 4.5%/year since 1991, according to the World Bank. Back in 1991, the GDP/person averaged $6,320.

Mexico’s GDP/person has risen quite sharply since 2008, when the comparable figure was $14,810, though its world rank (#80) is essentially unchanged. The figures suggest that economic growth has outstripped population growth over the past five years, making Mexicans better off (on average), and able to afford more goods and services, now than they were then.

Since 1991, Mexico’s GDP/person has declined in only three years:

  • 1994-1995 – decline of 10% due to world economic crisis
  • 2000-2001 – decline of 0.2%
  • 2008-2009 – decline of 2.2% due to world economic crisis

These figures suggest that Mexico’s economy has become more resilient when there is any slump in global markets.

Retirees and “residential tourism”: a case study of Chapala-Ajijic in Jalisco

 Excerpts from Geo-Mexico  Comments Off on Retirees and “residential tourism”: a case study of Chapala-Ajijic in Jalisco
Jan 162014
 

Retirees, mainly from the USA and Canada, form a special subgroup of tourists. About 1 million US visitors to Mexico each year are over the age of 60. Their total expenditure is about $500 million a year. Three-quarters arrive by air; half of these stay 4-8 days and almost one in ten stays 30 days or longer. Half stay in hotels, and one-third in time-shares; the remainder either stay with family or friends, or own their own second home. Of the 25% arriving by land, almost one in three stays 30 days or more. For Canadians, the patterns are broadly similar except that a higher percentage arrive by air.

The number of retiree tourists is relatively easy to quantify. However, it is extremely difficult to place accurate figures on the number of non-working, non-Mexicans who have chosen to relocate full-time to Mexico. Technically, these “residential tourists” are not really tourists at all but longer-term migrants holding residency visas. They form a very distinct group in several Mexican towns and cities, with lifestyle needs and spending patterns that are very different from those of tourists. Their additional economic impact is believed to exceed $500 million a year.

Map of Lake Chapala, Jalisco, Mexico

Map of Lake Chapala, Jalisco, Mexico. Credit: Tony Burton; all rights reserved.

The largest single US retirement community outside the USA is the Guadalajara-Chapala region in Jalisco, according to state officials (see map). The metropolitan area of Guadalajara, Mexico’s second city, has a population of about 4 million. The villages of Chapala and Ajijic (combined population about 40,000) sit on the north shore of Lake Chapala some 50 km (30 mi) to the south. Historically, Chapala was the first lakeshore settlement to attract foreign settlers, as early as the start of the 20th century. Today the area is home to a mix of foreign artists, intellectuals, escapees (of various non-judicial kinds), pensioners and ex-servicemen. In the last 40 years, Ajijic has become the focal point of the sizable non-Mexican community living on the lakeshore. Depending on how they are defined, there are probably between 6000 and 10,000 foreign residents in the Chapala-Ajijic area, the higher number reflecting the peak winter season. About 60% of retirees in the area own their own homes or condos, though many still own property in the USA or Canada as well, and many make regular trips north of the border.

The main pull factors for residential tourists are an amenable climate; reasonable property prices; access to stores, restaurants and high quality medical service; an attractive natural environment; a diversity of social activities; proximity to airports; tax advantages, and relatively inexpensive living costs.

David Truly has suggested that conventional tourist typologies do not work well with Ajijic retirees. He identified migrant clusters with similar likes and dislikes. Retirees vary in education, travel experience and how they make decisions about relocation. Early migrants tended to dislike the USA and Canada and adapted to life in Mexico. They were generally content with anonymity unlike many more recent migrants. Traditional migrants appreciate all three countries, but have chosen Mexico as their place of permanent residence. Many new migrants do not especially like the USA or Canada but are not particularly interested in Mexico either. They seek familiar pastimes and social settings and are content to have relatively little interaction with Mexicans.

The large influx of residential tourists into small lakeside communities like Ajijic inevitably generates a range of reactions among the local populace. From empirical studies of regular tourism elsewhere, George Doxey developed an “irritation index” describing how the attitudes of host communities change as tourist numbers increase. His model applies equally well to residential tourists. In the initial stage the host community experiences euphoria (all visitors are welcome, no special planning occurs). As numbers increase, host attitudes change to apathy (visitors are taken for granted) and then annoyance (misgivings about tourism are expressed, carrying capacities are exceeded, additional infrastructure is planned). If numbers continue to grow, hosts may reach the stage of antagonism, where irritations are openly expressed and incomers are perceived as the cause of significant problems.

Residential tourism in the Chapala-Ajijic area has certainly wrought great changes on the landscape. Residential tourists have created a distinct cultural landscape in terms of architectural styles, street architecture and the functions of settlements. (Browse the Chapala Multiple Listing Service New Properties). Gated communities have been tacked on to the original villages. Subdivisions, two around golf courses, have sprawled up the hillsides. Swimming pools are common. Much of the signage is in English. Even the central plazas have been remodeled to reflect foreign tastes. Traditional village homes have been gentrified, some in an alien “New Mexico” style.

On the plus side, many retirees, as a substitute for the family they left behind, engage in philanthropic activities, with a particular focus on children and the elderly. Retiree expenditures also boost the local economy. Areas benefiting from retirees include medical, legal and personal services, real estate, supermarkets, restaurants, gardening and housecleaning. Employment is boosted, both directly and indirectly, which improves average local living standards.

On the minus side, decades of land speculation have had a dramatic impact on local society. Land and property prices have risen dramatically. Many local people have become landless domestic servants, gardeners and shop-keepers with a sense that the area is no longer theirs. Crime levels have risen and some local traditions have suffered. The abuse of water supplies has resulted in declining well levels. Over zealous applications of fertilizers and pesticides have contaminated local water sources.

Other locations besides Chapala-Ajijic where a similar influence of non-Mexican retirees on the landscape can be observed include San Miguel de Allende (Guanajuato), Cuernavaca (Morelos), Mazatlán (Sinaloa), Puerto Peñasco (Sonara), Rosarito (Baja California) and Todos Santos (Baja California Sur). The most preferred locations are all on the Pacific coast side of Mexico.

As more baby-boomers reach retirement age, residential tourism offers many Mexican towns and cities a way of overcoming the seasonality of conventional tourism. Lesser-developed regions have an opportunity to cash in on their cultural and natural heritage and improve their basic infrastructure.

This is a lightly edited excerpt from chapter 19 of Geo-Mexico: the geography and dynamics of modern Mexico.

References:

  • Boehm S., B. 2001 El Lago de Chapala: su Ribera Norte. Un ensayo de lectura del paisaje cultural. 2001. Relaciones 85, Invierno, 2001. Vol XXII: 58-83.
  • Burton, T. 2008 Lake Chapala Through the Ages, an Anthology of Travellers’ Tales. Canada: Sombrero Books.
  • Doxey G.V. 1975 A causation theory of visitor‑resident irritants: methodology and research inferences. Proceedings of the Travel Research Association, San Diego, California, USA: 195‑8.
  • Stokes, E.M. 1981 La Colonia Extranero: An American retirement Community in Ajijic, Mexico. PhD dissertation, University of New York, Stony Brook, cited in Truly, D. 2002.
  • Truly, D. 2002 International Retirement migration and tourism along the Lake Chapala Riviera: developing a matrix of retirement migration behavior. Tourism Geographies. Vol 4 # 3, 2002: 261-281.
  • Truly, D. 2006 The Lake Chapala Riviera: The evolution of a not so American foreign community, in Bloom, N.D. (ed) 2006 Adventures into Mexico: American Tourism beyond the Border. Rowman & Littlefield: 167-190

Related posts:

Many Mexican Bracero workers still trying to claim their pay

 Excerpts from Geo-Mexico, Updates to Geo-Mexico  Comments Off on Many Mexican Bracero workers still trying to claim their pay
Nov 302013
 

In response to severe labor needs during the second world war, the governments of Mexico and the USA initiated the Bracero guest worker program in 1942. The program enabled Mexico to contribute to the war effort by sending temporary agricultural workers to the USA. Mexicans were granted renewable six month visas to work on selected farms. Most migrants under the Bracero program came from the same three states, Michoacán, Jalisco and Guanajuato. They worked mostly in California and other states along the Mexican border.

Los BracerosAs a result of the Bracero program, some farmers in the USA became very dependent on relatively cheap Mexican labor. The program was considered a great success by farmers. Unfortunately mistreatment of Bracero laborers was widespread. In protest, the Mexican Government threatened to stop the flow of migrants. During the war many Mexicans who were not recruited under the Bracero program entered the USA illegally looking for work. Tolerance for unauthorized migration developed on both sides of the border. With a large dependency in the USA on Mexican farm workers and a large supply in Mexico, there was virtually no way to put a halt to this migration stream.

Labor unions, churches and Latino groups in the USA opposed the Bracero program on the grounds that it held down farm wages and impeded the upward mobility of US Hispanics. They convinced the US Congress to halt the Bracero program in 1964. Between 1942 and 1964 an estimated 4.5 million Mexican Bracero workers entered the USA. At its height in the late 1950s more than 500,000 workers migrated each year. Most were temporary migrants who returned to Mexico within a year, often settling in larger cities, exacerbating the flow of migrants from rural areas to the growing cities. The Bracero program set the stage for the continued high volume of Mexican labor migration to the USA.

In an effort to ensure that the Bracero workers were only temporary migrants to the USA, the US government withheld 10% of all their earnings. The US government then remitted this amount to the Mexican government for payment to the workers on their return home. More than 70 years after the Bracero program started, many braceros are still trying to claim money that they earned legitimately years ago and that is still owed to them by the Mexican government.

The struggles of temporary bracero workers who were never repaid the 10% that had been withheld, are detailed in a short October 2013 article entitled “Bracero Guestworkers, Unpaid”, written by Adam Goodman and Verónica Zapata Rivera (history doctorate students at, respectively, the University of Pennsylvania and Mexico’s National Autonomous University).

The article also describes some of the other injustices faced by Bracero workers, including forced whole-body fumigation with DDT as they crossed the US border.

For more information about the Bracero program, see The Bracero Archive

Related posts:

The growth of the city of Monterrey, Mexico’s industrial powerhouse

 Excerpts from Geo-Mexico, Other  Comments Off on The growth of the city of Monterrey, Mexico’s industrial powerhouse
Oct 282013
 

A series of historical maps of the city of Monterrey was published earlier this year in the city’s online Catalog of Buildings of Historic and Artistic Importance in Barro Antiguo, The maps, dated 1765, 1791, 1846, 1865, 1922, 1933 and 1947 respectively, offer a good basis for considering the urban growth of Monterrey, the industrial powerhouse of northern Mexico.

In chapter 22 of Geo-Mexico, the geography and dynamics of modern Mexico, we explained why, “Monterrey does not fit the general Latin American urban model as well as Mexico City or Guadalajara. First, it never really existed as a colonial city. Secondly, its development was more heavily dependent on industry. Thirdly, its relative wealth and progressive leadership in some ways make it more similar to a North American city than a Latin American city. It fits the model only in that it developed a definite high status sector in contrast to lower status industrial sectors, and eventually became spatially fragmented.”

But just how did Monterrey develop as a city? In each of the following historical maps of Monterrey, Barrio Antiguo (16 blocks in size in the present-day city) is marked by a red quarter-circle, which is an easy way to check each map’s orientation and scale. Monterrey was founded in 1596. The earliest map in our series, for 1765, shows that, even by that date, Monterrey was still a relatively small settlement situated between a (seasonally dry) “stream formed by various springs” (to the top of the map, north) and the seasonally-dry “Monterrey River” (now called the Santa Catarina River). The Barrio Antiguo is shown as mostly an empty area, with only one major construction.

Monterrey 1765

Monterrey 1765

Very little has changed by 1791 (see map below: note that this map is oriented south-upwards), though the Barrio Antiguo has now been developed, and is shows as having several streets in a clear grid pattern:

monterrey-1791

Monterrey in 1791

The grid pattern for Barrio Antiguo is equally evident in the details of the map in 1846:

monterrey-1846

Monterrey in 1846

As of 1846, no development is shown on the south bank of the Santa Catarina River, though tracks are shown heading east and south-east respectively from the city. The next map, for 1865, shows that the city is beginning to expand to the south. A substantial settlement is developing on the south bank, more of less opposite the Barrio Antiguo. Note, though, that this map shows only part of the city:

monterrey-1865

Monterrey in 1865

Clearly, Monterrey only emerged as a real city after the colonial period which ended in 1821. The relatively small city did not experience real growth until late in the 19th century when it became connected by railroad and started to attract industrial development.

Early in the 20th century, investors built the then largest iron and steel works in Latin America a few kilometers east of the city center. Many related industries located nearby. These industries and the railroad, which ran east–west about four kilometers (2.5 mi) north of the city center, stimulated early industrial development in these directions. Developers established low income housing tracts for industrial and other workers on the east, north and west periphery of the city. Neighborhoods for the wealthier classes were developed south of the city center.

By 1933, Monterrey has grown significantly in area, especially towards the north:

monterrey-1933-whole-city

The city of Monterrey in 1933

Between 1933 and 1947, the city continues to expand, with many areas being infilled with residences:

monterrey-1947

The city of Monterrey in 1947

The city experienced another surge of industrialization and immigration in the 1950s and 1960s. Industrial development continued after 1970 when the national government implemented policies to shift development away from Mexico City. Monterrey became a major producer of steel, metal fabrication, cement, beverages, petrochemicals, food, telecommunications, auto parts, glass, and house furnishings. It also developed into a major financial center and one of the wealthiest and most progressive cities in the country.

Low income housing became a serious problem after the 1960s as the inner city tenements became extremely crowded. The government was not sympathetic to irregular housing schemes, so low income groups established numerous illegal squatter settlements on vacant land near the industrial zone. Government made a few efforts to remove these, but most survived and eventually became regularized.

The high status sector expanded south-west into San Pedro Garza García, which became one of the wealthiest municipalities in Mexico. The high overall income and wages in the city meant that many workers could afford home ownership and private automobiles. As a result, many gated communities (large and small) and suburban shopping malls were built around the urban periphery. The urban area became relatively fragmented with many low income residential zones located near high income areas.

Source of the maps used in this post:

Other posts about the urban geography of Mexico’s cities:

How globalized is Mexico?

 Excerpts from Geo-Mexico  Comments Off on How globalized is Mexico?
Aug 192013
 

What exactly is globalization?

Globalization can be defined in simple terms as “the process by which events, activities and decisions in one part of the world can have significant consequences for communities in distant parts of the globe.” [Peter Haggett in his Geography (A Global Synthesis), Pearson Education Limited, 2001]. Though globalization began centuries ago with colonial conquests and trade, it has only gained widespread attention in the past few decades.

Globalization is a highly contentious issue. There are major debates as to whether globalization brings more benefits than problems. While many international organizations such as the International Monetary Fund and World Bank are pro-globalization, many individuals and sectors of society remain deeply skeptical, and a powerful anti-globalization movement has arisen in some parts of the world.

How globalized is Mexico?

Several attempts have been made to quantify globalization. In this section we compare two indices which look at how globalized Mexico is compared to other countries.

The KOF Index of Globalization measures three main dimensions of globalization: economic, social and political. Economic globalization considers the long distance flows (exports, imports) of goods, capital and services, as well as political restrictions (tariffs, taxes) to these flows. Social globalization measures the international spread of ideas, information (telephone traffic, internet access) and people (migration, tourism). Several small European countries score well on these first two measures. Political globalization examines the number of embassies a country has, as well as its membership of international organizations and participation in UN peace missions. European countries occupy the first seven places on this dimension. Based on the indices for these three dimensions, an overall index of globalization is calculated.

The 2009 KOF Index used data from 2006 to rank 208 countries. Mexico placed 65th overall, with rankings of 79th for economic, 69th for social, and 80th for political globalization. By comparison, Russia ranked 61st, Argentina 63rd, Brazil 79th, China 91st, Indonesia 100th and India 122nd.

The A.T. Kearney Globalization Index has four main components: economic integration (trade, foreign direct investment), personal contact (telecommunications, travel, remittances), technological connectivity (internet) and political engagement (international treaties, organizations and peacekeeping). The 2006 index ranked 62 countries. Mexico placed 42nd overall, with ranks of between 36 and 41 for each of the four components. For comparison, Russia ranked 47th, Argentina 43rd, Brazil 52nd, China 51st, Indonesia 60th and India 61st.

In Mexico’s case, these two globalization indices give broadly similar results. The data suggest that Mexico is relatively globalized compared to other large emerging countries. However, in the case of the USA, the different methodologies of the two indices produce very different results. The KOF index ranks the USA as 38th out of 208, with rankings of 59th for economic, 56th for social and 9th for political globalization respectively. The A.T. Kearney index places the USA 3rd out of 62 countries, despite its ranks for separate components of 58th for economic, 40th for personal, 1st for technological and 41st for political globalization. The differences between the indices indicate the difficulty of quantifying globalization.

Related posts:

May 132013
 

Mexican rivers are not well suited for navigation and thus have had only a minor influence on Mexico’s historical development. Their most important use has been as sources of irrigation water and hydroelectric power. Mexico’s annual flow of river water (roughly 410 km3) is about 25% more than the St. Lawrence River, but 25% less than the Mississippi River. Most of this flow is in southern Mexico which gets by far the most rainfall. Mexico’s dams have an installed capacity of about 11 gigawatts of electricity, roughly one fifth of the country’s total generating capacity; they don’t operate at full capacity, so they only generate about one eighth of total electricity. Only about a fifth of the total river water is consumed for other productive purposes. This proportion is far higher for rivers in drier northern Mexico where river flow is significantly smaller during the dry winter months.

Fig 6-3 of Geo-Mexico: Rivers of Mexico

Fig 6-3 of Geo-Mexico: Rivers of Mexico; all rights reserved

The two longest rivers in Mexico, the Rio Bravo (Rio Grande north of the border) and Colorado, start in the US state of Colorado (see map). The Río Bravo is about 3000 km (1900 mi) long and forms the border between Mexico and the USA for about 2000 km (1250 mi). Occasionally floods shift its location resulting in border disputes. Though it drains about a quarter of Mexico’s total area, its drainage basin is arid and its total flow is less than 2% of Mexico’s total. The Colorado River, which is almost entirely in the USA, formed a vast delta in the otherwise arid Sonoran desert in northern Mexico. The amount of water reaching Mexico has declined dramatically as a result of the Hoover and Glen Canyon dams and other diversions in the USA (see here, here and here). As a result delta wetlands have been reduced to about 5% of their original extent, and the potential water supply for the rapidly-growing urban centers of Mexicali, Tijuana, Tecate and Rosarito has been compromised.

Interestingly, the Mexican river with the greatest flow, the Grijalva–Usumacinta, does not start in Mexico either (see map). The river has a double name because it is actually a double river, with two branches of similar length which both start in Guatemala. Each branch flows about 750 km (465 mi) through Chiapas before they unite in Tabasco about 25 km from the Gulf of Mexico. Each of the two branches has a flow of about 14% of Mexico’s total. The flow of the combined Grijalva–Usumacinta River is about twice that of the Missouri River in the USA.

There are several other important Mexican rivers. The Lerma River starts in the State of Mexico and flows westward into Lake Chapala and continues to the Pacific Ocean with the name Santiago. The Lerma–Santiago River system is about 1280 km (800 mi) long, the longest river entirely in Mexico. It drains about 6% of Mexico. The Lerma–Santiago, which flows through several states, is one of the economically most important rivers in Mexico because it feeds some of the country’s prime agricultural areas as well as the two largest metropolitan areas: Mexico City and Guadalajara. However, its flow is quite small, only about 2% of the national total.

The flow of the Balsas River, south of the Lerma–Santiago, is about three times that of the Lerma–Santiago. Though it offers some white-water rafting and irrigation opportunities, it is not as important economically. There are numerous rather long rivers that also flow west to the Pacific from the Western Sierra Madre in northwestern Mexico, but these have relatively little water. There are also several rather long rivers in the north such as the Nazas that flow into landlocked basins and either die or feed small drying lakes.

Three major rivers flow into the Gulf of Mexico through the state of Veracruz. The Rivers Papaloapan and Coatzacoalcos start in Oaxaca and flow through southern Veracruz. Their combined flow is nearly 20% of the national total. The Pánuco–Tamesi–Moctezuma River system starts in the State of Mexico and carries nearly 5% to the Gulf of Mexico at Tampico.

Related posts:

The world’s richest man is one of 15 Mexican billionaires on 2013 Forbes list

 Updates to Geo-Mexico  Comments Off on The world’s richest man is one of 15 Mexican billionaires on 2013 Forbes list
Mar 072013
 

The 2013 Forbes list of the world’s billionaires shows that the world’s 1,426 billionaires (an all-time high) share a record net worth of $5.4 trillion. The four countries with most billionaires are the USA (442), China (122), Russia (110) and Germany (58).

Fifteen Mexican individuals or families make the 2013 list, also a record number. The fifteen super-rich Mexicans are:

World rank / Name / Estimated wealth according to Forbes / Main business interests

#1 Carlos Slim Helú and family, $73.0 billion, making him the richest man in the world. Fixed line telephone provider Telmex, cell phone provider América Móvil, Grupo Carso, Inbursa. [Slim Helú remains the world’s richest man for the fourth consecutive year]

#32 Alberto Bailleres González and family, $18.2 billion. Mining giant Peñoles, department store El Palacio de Hierro and Grupo Profuturo.

#40 Germán Larrea Mota Velasco and family, $16.7 billion. Grupo México –mining for copper and other minerals, railways.

#111 Ricardo Salinas Pliego and family, $9.9 billion. Television company Televisón Azteca, domestic appliance store Elektra, bank Banco Azteca, and cell phone company Iusacell.

#179 Eva Gonda Rivera and family, $6.6 billion, soft drinks (FEMSA)

#248 Maria Asunción Aramburuzabala and family, $5 billion, beer (Grupo Modelo)

#329 Jerónimo Arango and family, 4 billion dollars. Founder of Aurrerá supermarket chain and Grupo Cifra which controlled VIPS and El Portón restaurant chains, Suburbia department stores and tourist developments in Baja California Peninsula and Acapulco

#589 Emilio Azcárraga, $2.5 billion. Television and media conglomerate Televisa, and Nextel cell phones

#613 Rufino Vigil González, $2.4 billion; steel (Industrias CH)

#641 José and Francisco Calderón Rojas (brothers), $2.3 billion, beverages (Coca-Cola Femsa)

#792 Carlos Hank Rhon and family, $1.9 billion, banking

#831 Roberto Hernández, $1.8 billion. Banker, one of main shareholders of Citigroup, and tourist developments in the Yucatán Peninsula

#974 Alfredo Harp Helú and family, $1.5 billion. Shareholder in Citibank, telecommunications firm Avantel

#1031 Max Michel Suberville, $1.4 billion, retail (Coca-Cola Femsa)

#1107 Juan Gallardo Thurlow, $1.3 billion, beverages (organización Cultiba)

Conspicuous by his absence from the list (for the first time in several years) is Joaquín Guzmán Loera (aka “El Chapo”) who Forbes has consistently claimed has a net worth of about $1 billion, but whose assets the magazine now declares “impossible to verify”. Guzmán Loera is Mexico’s most wanted man, head of the Sinaloa drugs cartel, the main supplier of cocaine to the US market.

The combined total wealth of these fifteen individuals is a staggering $148.5 billion (compared to an equivalent total of $125.1 billion in 2012). The 2013 figure is equivalent to more than 6% of Mexico’s GDP.

The average earnings of Mexican workers registered in IMSS (Mexico’s Social Security Institute) in 2012 was about 260 pesos ($20 dollars) a day. The combined wealth of Mexico’s fifteen richest individuals/families is therefore equivalent to the total annual salaries of more than 20 million Mexicans earning this average salary! Note that this equivalence has risen steadily over recent years. For example, in 2010 the combined wealth of Mexican billionaires was equivalent to “only” 14.3 million Mexicans earning the then average salary.

Clearly, there are a handful of extremely wealthy individuals living in Mexico, alongside millions of Mexicans who are living at or below the poverty line. These income disparities have existed for a very long time, and are examined in detail in chapter 14 of Geo-Mexico: the geography and dynamics of modern Mexico. That chapter also analyzes the spatial patterns of wealth in Mexico, and discusses whether the gap between rich and poor has widened or narrowed in recent years.

Chapter 29 discusses Gender inequities in Mexico and  Oportunidades, a poverty reduction program (links are to excerpts from that chapter).

Related articles:

The important role of telenovelas and historietas as forms of communication in Mexico

 Excerpts from Geo-Mexico  Comments Off on The important role of telenovelas and historietas as forms of communication in Mexico
Dec 312012
 

The highest rating programs on TV are televised novels, telenovelas. A telenovela is a limited‑run television serial melodrama, somewhat like a soap opera but normally lasting less than a year, and where the eventual ending has already been scripted.

image of los ricos tambien lloranThe first global telenovela was Los ricos también lloran (“The rich cry too”), originally shown in 1979. Telenovelas are now a $200 million market. Some critics claim they are effective promoters of social change, others deride them as being nothing more than mass escapism. Whichever view is more accurate, their portrayals reflect society’s values and institutions.

Advocates of telenovelas point to their role in challenging some traditional Mexican media taboos by including story lines about urban violence, racism, homosexuality, birth control, physical handicaps, political corruption, immigration and drug smuggling. Early telenovelas tended to be shallow romantic tales. The form subsequently evolved to include social commentaries and historical romances, some applauded for their attention to historical detail. Some were used for attempts at social engineering. An early government-sponsored telenovela promoted adult literacy programs. Several others openly advocated family planning and have been credited with contributing to Mexico’s dramatic decline in fertility rate. Other telenovelas have targeted younger audiences, focusing on issues connected to pop music, sex and drugs.

Rius historieta: The failure of education in Mexico

Rius historieta: The failure of education in Mexico

Besides the shallowness of the plot lines in most telenovelas, the other common criticism is that their stars are almost always white-skinned, blue-eyed blondes. Sadly, all too often, actors with indigenous looks are relegated to roles portraying menial workers such as home help or janitors.

Telenovelas have been extraordinarily successful commercially. They have become immensely popular not only in Latin America and among the US Hispanic population but also in more than 100 other countries, mainly in Eastern Europe and Asia.

In print media, a similar role to the telenovela has been played by historietas (comic books), the best of which have tackled all manner of social, political and environmental issues well before such topics made the main-stream press. Historietas helped educate millions of Mexicans and were also a commercial success. Their circulation peaked in the 1980s but has since declined due to competition from television and, more recently, the internet. The most influential creator of historietas is the cartoonist and writer Eduardo del Río (Rius) whose work earned him a 1991 United Nations Environment Programme prize.

Related posts:

The geography of music and dance in Mexico

 Excerpts from Geo-Mexico, Maps  Comments Off on The geography of music and dance in Mexico
Nov 272012
 

Numerous different regional music styles are found in Mexico (see map), some strongly influenced by indigenous instruments but most relying on the string and brass instruments brought by early Spanish settlers. Curiously, mariachi music, which is often considered Mexico’s national musical style, is believed to owe its origin to French immigrants and refer to wedding (mariage) music. Other popular music types include rancheras (country style songs), corridos (songs telling stories, often about heroes), norteño (northern), rock and pop.

Music and dance in Mexico.

Music and dance in Mexico. Fig 13.3 of Geo-Mexico, the geography and dynamics of modern Mexico. All rights reserved.

Musical instruments vary regionally as well. For instance, the marimba, a kind of wooden xylophone, is most often heard in Chiapas whereas the harp is more characteristic of Veracruz.

Regional dance styles have provided the stimulus for Mexico’s numerous baile folklórico (folkloric ballet) groups, many of which tour internationally. Some examples of regional dances are shown on the map.

Dance of the Quetzals, Cuetzalan, Puebla.

Dance of the Quetzals, Cuetzalan, Puebla. Photo: Tony Burton; all rights reserved.

Some of these dances are very localized. For example, the Quetzal Dance, with its elaborate headdresses (see photo)  is performed almost exclusively in the village of Cuetzalan in the state of Puebla.

In addition to these cultural manifestations there are significant spatial variations among many other facets of culture, including sport, dress, architectural styles and handicrafts. Regional differences are also found in some forms of literature.

Related posts:

How does Mexico’s telephone system compare with that in other countries?

 Excerpts from Geo-Mexico  Comments Off on How does Mexico’s telephone system compare with that in other countries?
Nov 192012
 

Mexico’s first telephone line was erected in Puebla in the early 1880s. Before long, the Mexican Telephone Company, a subsidiary of Bell, was operating in Mexico City. The first telephone lines did not work very well and were limited to downtown areas. Only public officials, police stations, a few select businesses and the wealthy used the telephone service.

The growth of telephony was slow because it lacked strong government support, was expensive and had a very limited range. By 1893 telephone services had spread to 13 more cities even though intercity lines would not become available until much later. In about 1950 all Mexico’s telephone companies were purchased by a single group of investors to form Teléfonos de México (Telmex) which established a monopoly. Even after the government nationalized the company in 1972, few incentives were offered for expansion and it was still almost impossible to obtain a new telephone line.

Access to fixed line and cell phones by country.

Access to fixed line and cell phones by country. Fig. 18.1 of Geo-Mexico; all rights reserved.

In 1990 Telmex was re-privatized in one of Mexico’s largest, most complicated and most controversial privatizations. The government sold majority voting rights and a 20% stake in Telmex to a consortium of investors for $1.8 billion and it sold $3.7 billion in shares to the public. The newly privatized Telmex invested significantly in the mid 1990s, enabling millions to get new lines but raising rates dramatically. Competitors were allowed to enter the telephone market but Telmex has remained the dominant player, especially for residential services. It remains fashionable for its customers to complain about its poor service and very high long distance rates.

Mexico and the USA are closely linked by telephone. Over 90% of the international calls from Mexico go to the USA whereas roughly 13% of all US international calls go to Mexico.

For a country of Mexico’s wealth and sophistication, it lags behind most of the world in telephony (see graph). In 2007, Mexico had 19 fixed telephone lines per 100 population compared to 53 in the USA and 56 in Canada. The Federal District had the best service with about 50 fixed telephone lines per 100 people, followed by Nuevo León with 33 and Baja California with 27. Chiapas had the fewest with only 5 per 100, not far behind Oaxaca with 6 and Tabasco with 7. Telephone communications are difficult or inconvenient in these southern states; this limits their residents’ quality of life and economic competitiveness. Other states with poor telephone service (less than 12 lines per 100 people) are Hidalgo, Zacatecas, Campeche, Tlaxcala, Guerrero, Veracruz and San Luis Potosí.

Mexicans have better access to cell phones than fixed lines with 63% of the population owning one in 2007, compared to 84% in the USA, 62% in Canada and a staggering 107% (more than one cell phone per person) in Argentina. While lagging slightly behind Guatemala where 76% of the population has a cell phone, a higher percentage of people in Mexico use cell phones than in China or India.

Cell phone use in Mexico has grown rapidly in the capital and other big cities but has also grown spectacularly in southern and rural areas where there are few wired telephones. Many rural villages with only a few fixed line phones now have dozens of cell phones, mostly used by those under age thirty. When asked why they don’t use cell phones more, some older rural adults say they find cell phones too complicated because of their many small buttons.

Many rural residents get cell phones from relatives who have migrated to the USA. They avoid monthly fees by buying pre-paid cell phone cards when they have the money. When the card runs out, they make no calls until they can afford to buy another one. Some enterprising rural residents use their cell phone as a pay phone. In short, cell phone technology has greatly improved communications in many Mexican rural areas.

Related posts:

Life expectancy and infant mortality: how does Mexico compare to other countries?

 Excerpts from Geo-Mexico  Comments Off on Life expectancy and infant mortality: how does Mexico compare to other countries?
Nov 032012
 

How long do Mexicans live? The 20th century brought dramatic increases in longevity. From under 30 years at the beginning of the century it rose to 38 by 1930. From there it went up to 50 by 1950 and reached 62 by 1970. By 2000 it was 72, almost double the 1930 value. Women live longer than men. Life expectancy for Mexican women is about 78; that for men is roughly 73 years. In the future Mexican longevity is expected to increase at about 2.5 years per decade. This is not as rapid as in the past but still significant.

Infant mortality and life expectancy for a range of countries and regions.

Infant mortality and life expectancy for a range of countries and regions, 2010. Fig 28.2 of Geo-Mexico; all rights reserved.

It is not easy to find an accurate and reliable indicator of health. One common indicator is infant mortality, the percentage of children who die before their first birthday. This usually provides a reasonable measure of the general quality of health in a society. Mexico has made impressive progress; its infant mortality rate dropped from 7.5% in 1970 to 1.7% by 2005. More improvements are expected in the years ahead.

Mexicans clearly are living longer and healthier lives than they did in past decades. How does Mexico compare to other major countries? Though Mexico trails Canada, the USA and Argentina (see graph), it is slightly ahead of Brazil, China and the weighted average for Latin America. Mexico is significantly ahead of Indonesia, the world average and its southern neighbor Guatemala.

Related posts:

The confirmed results of Mexico’s 2012 presidential elections

 Mexico's geography in the Press  Comments Off on The confirmed results of Mexico’s 2012 presidential elections
Jul 062012
 

Mexico’s Federal Electoral Institute, has now confirmed the results of the presidential vote, held on 1 July 201.

PRI candidate Enrique Peña Nieto is the president-elect of Mexico and will take office on 1 December this year.

The confirmed figures for the presidential vote are as follows:

  • Enrique Peña Nieto (PRI)  38.21%
  • Andrés Manuel López Obrador (PRD) 31.59%
  • Josefina Vázquez Mota (PAN)  25.41%
  • Gabriel Quadri de la Torre (New Alliance Party) 2.29%

The vote turnout was around 63%. We will analyze the map for voting patterns for president, by state, in a future post.

Related posts:


Mexico City in colonial times: 1530–1820

 Excerpts from Geo-Mexico  Comments Off on Mexico City in colonial times: 1530–1820
May 212012
 

The internal geography of cities is closely related to transportation technology. Pre-Columbian cities in Mexico were walking cities; the wheel had not been developed and animals were not used for transport. Human power moved people and goods, but not very quickly or efficiently. As a result, cities were relatively compact and congested; densities were high. Despite these transport restrictions, at least one urban center in pre-Columbian Mexico had a population estimated to exceed 200,000.

The Aztec capital Tenochtitlan was built on an island in the middle of a lake, and was a thriving city when Hernán Cortés arrived. After the conquest, the Spaniards built their colonial city directly on top of Tenochititlan’s main buildings and large central plaza or Zócalo. Spanish colonial urban centers were explicitly patterned after cities in Spain, with a grand central square or plaza at the center (large enough for displays of horsemanship). The streets were laid out following a north-south, east-west grid. In larger cities, smaller plazas might be planned every four blocks or so.

Panoramic view of Mexico City during colonial times

Panoramic view of Mexico City during colonial times. (Talavera tiles based on unattributed oil painting in the Franz Mayer Museum, Mexico City).

Colonial Mexico City conformed closely to the Latin American city model. Important government, commercial, and religious buildings, such as the Cathedral, faced onto the square. Status was largely correlated with distance from the main plaza, the hub of all activity. Wealthy and important colonial officials had large homes in a zone surrounding the main square. This zone tended to be square or rectangular given the grid pattern of streets. Less important, middle income families lived in smaller houses farther from the main plaza; lower status groups lived even farther from the main square. The lowest status mestizos and Indians lived around the outside of the city. The city was very compact and congested. The wealthiest residents in the center lived relatively close to the poorest families on the periphery. With the very high densities, there was considerable noise and congestion, as well as sanitation problems and other health issues.

As Mexico City and other major Latin American cities grew throughout the 300-year colonial period, they tended to maintain a roughly concentric pattern; however, the growth of important government and business activities as well as wealthy residential neighborhoods usually favored one side of the city.

As these high status activities expanded they slowly took over middle status areas, which in turn expanded into poorer neighborhoods. The poorest groups were pushed to the periphery or to undesirable steep hillsides or low areas prone to flooding. The rate of spatial expansion never managed to keep pace with the growth of population and economic activity. Densities and congestion increased.

From the very beginning in Mexico City, a high status sector extended west of the Zócalo. The Aztecs considered Chapultepec Hill, six kilometers (3.6 mi) west of Tenochtitlan, a royal retreat. They built a castle there, connected to their island capital by along causeway. Spanish King Charles V declared the zone a nature reserve in 1537. Early colonial Viceroys built palacial residences there. In 1592, Viceroy Luis de Velasco constructed an impressive park, the 90-hectare (216-acre) Alameda Central about a kilometer west of the Zócalo. The area between the Alameda and the Zócalo became the city’s highest status area. The development decisions made during the 16th century solidified the west as the preferred direction and set the pattern of growth for the next 400 years. Similar high status sectors evolved in virtually all Latin American colonial cities.

Related posts:

Mexico’s highest volcanoes

 Excerpts from Geo-Mexico  Comments Off on Mexico’s highest volcanoes
Apr 302012
 

In a previous post, we saw how most of Mexico’s volcanoes are located in a broad band that crosses central Mexico known as the Volcanic Axis (Eje neovolcánico). In this post, we provide brief descriptions of some of the major volcanoes in Mexico.

Starting in the west, the first active volcanoes are Everman and Barcenas in the Revillagigedo Islands. Two of the westernmost volcanoes on the mainland are near Colima. At 4260 m (13,976 ft), the inactive Nevado of Colima, Mexico’s sixth-highest peak, is as tall as the highest mountains in the contiguous USA. Its younger brother, Colima Volcano (or Volcán de Fuego) is lower (3820 m) but highly active and considered potentially very dangerous. It has erupted in cycles for several hundred years, and is capped by a dacitic plug characteristic of a silica-rich Pelean volcano. Such volcanoes have the potential to erupt suddenly, not emitting vast quantities of molten lava, but shooting out less spectacular, but far more devastating, clouds of red‑hot asphyxiating gasses.

Tequila Volcano, overlooking the town where the beverage is distilled, is also in Jalisco. In neighboring Michoacán state, the most noteworthy volcanoes are Jorullo (which last erupted in 1759) and Paricutín, which began life in a farmer’s field in 1943 and ceased activity in 1952, but only after its lava had overwhelmed several small villages.

Closer to Mexico City, the Nevado of Toluca (4680 m) has a drive-in crater and is a favored destination for Mexico City families in winter to take their children to play in the snow. It is Mexico’s fourth highest peak (see table below).

VolcanoStatesHeight (meters)Height (feet)
Pico de OrizabaVeracruz; Puebla5 61018 406
PopocatapetlMéxico; Morelos; Puebla5 50018 045
IztaccihuatlMéxico; Puebla5 22017 126
Nevado of Toluca México 4 68015 354
MalincheTlaxcala; Puebla4 42014 501
Nevado of Colima Jalisco4 26013 976
Cofre de PeroteVeracruz 4 20013 780
TacanáChiapas 4 08013 386
TelapónMéxico 4 06013 320
El AjuscoFederal District3 93012 894
Colima VolcanoJalisco; Colima3 82012 533

Continuing eastwards, we reach several other volcanoes that are among Mexico’s highest volcanic peaks (and are also included in the table).

The most famous volcano in the Volcanic Axis is the still active Popocatepetl (“Popo”), which rises to 5500 meters (18,045 feet). Alongside Popocatepetl is the dormant volcanic peak of Iztaccihuatl (5220 m or 17,126 ft). On a smog-free day, both are clearly visible from Mexico City. The southern suburbs of Mexico City are overshadowed by a smaller active volcano, Ajusco, which reaches 3930 m (12,894 ft).

The Nevado de Toluca volcano

The Pico de Orizaba, a dormant volcano on the border between states of Veracruz and Puebla, is Mexico’s highest mountain. At 5610 m (18,406 ft) it is the third highest peak in North America. By way of contrast, not very far away, in the outskirts of the city of Puebla, is the world’s smallest volcano!

Only a few volcanoes appear to be located outside the Volcanic Axis and therefore in an anomalous location to the general pattern. They include two volcanoes in Chiapas which lie south of the Volcanic Axis: El Chichón (which erupted in 1982) and Tacaná (4080 m).

Related posts:


Mexico’s Volcanic Axis

 Excerpts from Geo-Mexico  Comments Off on Mexico’s Volcanic Axis
Apr 192012
 

Mexico’s active seismic zones have created numerous volcanoes, many of which are still active. Virtually all the country’s active and recently dormant volcanoes are located in a broad belt of high relief which crosses Mexico from west to east: the Volcanic Axis (see map).

volcanic-axisAltitudes in this region vary from a few hundred to several thousand meters. The principal peaks are shown on the map. They include many of Mexico’s most famous mountains, such as Popocatepetl and Iztaccihuatl, near Mexico City; Pico de Orizaba, Mexico’s highest peak; Paricutín, the only completely new volcano in the Americas in recent times; and Colima, considered the most active at present. Many of the volcanoes are surprisingly young. For instance, a study using Carbon‑14 dating on the palaeosols (ancient soils) under 12 volcanoes in the Toluca area yielded ages ranging from 38,600 to 8400 years before present.

It is unclear precisely why this broad belt of Mexico should be so active. Elsewhere in the world all major tectonically active areas have been linked in terms of their location to the margins or meeting‑zones of tectonic plates. Some Mexican geologists believe that Mexico’s Volcanic Axis is a rare example of activity associated with a gently dipping plate margin, one where the edge of the Cocos plate is subsumed, but at only moderate gradient, beneath the North American plate.

Almost all the volcanic activity in this zone has taken place in the last 25 million years, from the upper Oligocene period, through the Miocene and Pliocene and up to Recent. Two distinct periods of activity are recognized by some geologists. The first, in the late Oligocene and early Miocene, produced volcanic rocks often found today tightly folded by later earth movements. The second, responsible for all the major composite cones as well as dozens of ash and cinder cones, started in the Pliocene and continues today.

Erosion has had relatively little time to work on these “new” volcanic peaks, some of which are still developing. As a result, this region includes Mexico’s highest mountains, reaching over 5500 m or 18,000 ft.

Thick, lava-rich volcanic soils make this one of the most fertile areas in North America. Though the relief is very rugged, this area has supported relatively high population densities for hundreds of years, including the current large metropolitan areas of Mexico City, Guadalajara and Puebla. Legacies of previous volcanic activity are found in craters, mud‑volcanoes, geothermal activity, and the numerous hot springs (and spa towns) scattered throughout the Volcanic Axis.

Related posts:

How has the movement of tectonic plates affected Mexico?

 Excerpts from Geo-Mexico  Comments Off on How has the movement of tectonic plates affected Mexico?
Apr 122012
 

In a previous post, we identified the tectonic plates that affect Mexico. In this piece, we look at some of the major impacts of Mexico lying on or close to so many different plates.

To the east of Mexico, in the last 100 million years, outward expansion from the Mid-Atlantic Ridge (a divergent boundary) first pushed South America ever further apart from Africa, and then (slightly more recently) forced the North American plate (and Mexico) away from Eurasia. The Atlantic Ocean continues to widen, expanding the separation between the New World and the Old World, by about 2.5 cm (1 in) each year.

Mexico's position in relation to tectonic plates

Mexico's position in relation to tectonic plates.Map: Geo-Mexico.com; all rights reserved

Meanwhile, to the west of Mexico, an analogous situation is occurring in the Pacific Ocean, where the Cocos plate is being forced eastwards away from the massive Pacific plate, again as a result of mid-ocean activity. The Cocos plate is effectively caught in a gigantic vice, its western edge being forced ever further eastwards while its leading eastern edge smacks into the North American plate.

The junction between the Cocos and North American plates is a classic example of a convergent plate boundary. The collision zone is marked by a deep ocean trench, variously known as the Middle America trench or the Acapulco trench. Off the coast of Chiapas, this trench is a staggering 6662 m (21,857 ft) deep. The trench is formed where the Cocos plate is forced to dive beneath the North American plate.

As the Cocos plate is subducted, its leading edge fractures, breaks and is partly re-melted into the surrounding mantle. Any cracks in the overlying North American plate are exploited by the molten magma, which is under immense pressure, and as the magma is forced to the surface, volcanoes form. The movement of the plates also gives rise to earthquakes. The depth of these earthquakes will vary with distance from the deep ocean trench. Those close to the trench will be relatively shallow, whereas those occurring further away from the trench (where the subducting plate is deeper) will have deeper points of origin.

As the plates move together, sediments, washed by erosion from the continent, collect in the continental shallows before being crushed upwards into fold mountains as the plates continue to come together. A line of fold mountains stretches almost continuously along the west coast of the Americas from the Rocky Mountains in Canada past the Western and Southern Sierra Madres in Mexico to the Andes in South America. Almost all Mexico’s major mountain ranges—including the Western Sierra Madre, the Eastern Sierra Madre and the Southern Sierra Madre—formed as a result of these processes during the Mesozoic Era, from 245 to 65 million years ago.

However, no sooner had they formed than another momentous event shook Mexico. About 65 million years ago, a giant iridium-rich asteroid slammed into the Gulf of Mexico, close to the Yucatán Peninsula, causing the Chicxulub Crater, and probably hastening the demise of the dinosaurs. An estimated 200,000 cubic km of crust was pulverized; most of it was thrown into the air. The resulting dust cloud is thought to have contributed to the extinction of up to 50% of all the species then on Earth. Not only did this event have an enormous impact on all life forms on Earth, it also left a legacy in the Yucatán. The impact crater is about 200 km (125 mi) across. Its outer edge is marked by a ring of sinkholes (locally known as cenotes) and springs where the fractured crust provided easy access to ground water. These locations include the ria (drowned river valley) of Celestún (now a UNESCO Biosphere Reserve), where fresh water springs mingle with salt water to create an especially rich habitat for birdlife.

In the 65 million years since the asteroid impact (the Cenozoic period), the remainder of Mexico has been formed, including many of the plateaus and plains, and the noteworthy Volcanic Axis, which owes its origin to still-on-going tectonic activity at the junction of the North American and Cocos plates.

Related posts:

Mexico’s political system at the state and municipal levels

 Other  Comments Off on Mexico’s political system at the state and municipal levels
Apr 072012
 

In a previous post – Mexico’s political system: the basics – we looked at the country’s federal political system. In this post, we look at how the political system works at the two other levels of government: state and municipal.

According to the Constitution of 1917, powers not granted to the Federal Government are reserved for the states. State constitutions roughly mirror the federal constitution. Each state has a popularly elected governor who serves one six-year term and cannot be re-elected. The popularly elected members of the state chamber of deputies serve three-year terms. Non-sequential re-election is permitted. Governors generally have more power than the chamber of deputies. State governments depend on the Federal government for much of their revenue, some of which they funnel to municipal governments. Each state has a Supreme Court of Justice with judges appointed by the state governor.

States are divided into municipalities. There are currently 2458 municipalities (counting Mexico City’s delegaciones or boroughs as municipios) which vary greatly in size and population. For example, the average population of Oaxaca’s 570 municipalities is about 6000 while the average population of Baja California’s five municipalities is over 500,000. Each municipality elects a new president and local council every three years.

Municipal governments have taxing authority but rely very heavily on financial support from state and federal sources. Municipalities are responsible for a variety of public services, including water and sewerage; street lighting and maintenance, trash collection and disposal, public safety and traffic, supervision of slaughterhouses, and maintenance of parks, gardens and cemeteries. Municipalities are also free to assist state and federal governments in the provision of elementary education, emergency fire and medical services, environmental protection and the maintenance of historical landmarks.

Which tectonic plates affect Mexico?

 Excerpts from Geo-Mexico  Comments Off on Which tectonic plates affect Mexico?
Apr 022012
 

The theory of plate tectonics suggests that the earth’s crust or lithosphere is from 5 to 65 km (3 to 40 mi) thick and divided into about a dozen large tectonic plates, tabular blocks that drift across the Earth in different directions and at various speeds (up to a few centimeters or inches per year), probably as a result of thermal convection currents in the Earth’s molten mantle. Most plates consist of a combination of both ocean floor and continent, though some are entirely ocean floor.

Each tectonic plate is moving relative to other plates. The movements are not independent because the plates smash into and scrape against one another. Areas in the center of tectonic plates, far from the boundaries, have relatively little seismic activity, but the boundaries between plates are seismically very active, creating earthquakes and volcanoes. The level of seismic activity depends on the relative speed and direction of the plates at the boundary.

There are three distinct kinds of boundaries between plates. At divergent boundaries, along mid-ocean ridges, plates are being steadily pushed apart, with new crust being added by volcanic activity to the rear of each plate as it moves. At convergent boundaries, plates collide and parts of the plates either buckle or fracture or are subducted back down into the molten mantle. The third kind of boundary is where plates are neither created nor destroyed but are moving side by side. The resulting friction as they rub against each other can produce large earthquakes.

Almost all of Mexico sits atop the south-west corner of the massive North American plate (see map). Immediately to the south is the much smaller Caribbean plate. The North American plate extends westwards from the Mid-Atlantic Ridge, which runs through Iceland and down the middle of the Atlantic Ocean, to the western edge of North America. In a north-south direction, it extends from close to the North Pole as far south as the Caribbean.

Mexico's position in relation to tectonic plates

Mexico's position in relation to tectonic plates.Map: Geo-Mexico.com; all rights reserved

While most of Mexico rests on the North American plate, it is also influenced by several other plates.

The Baja California Peninsula is on the gigantic Pacific plate, which is moving northwest and under the North American plate. The intersection of these plates under the Gulf of California causes parallel faults which are part of the famous San Andreas Fault system. Thus, the Gulf of California is an area of heavy seismic activity.

The small Rivera plate, between Puerto Vallarta and the southern tip of Baja California, is moving in a southeasterly direction and rubbing against the Pacific plate; it, too, is moving under the North American plate.

The Cocos plate and tiny Orozco plate are ocean crust plates located off the south coast of Mexico. The collision of the Cocos plate and the North American plate has had several far-reaching consequences, including both the disastrous 1985 earthquakes that caused such severe loss of life and damage in Mexico City and the much more recent 2012 earthquake that, fortunately, was far less destructive.

Related posts:

Mar 312012
 

In a few months time, Mexicans go to the polls to elect a new President. Just how does the Mexican political system work? As a build-up to the important federal elections coming shortly, this post looks at the background to Mexico’s political system and provides a quick summary of the federal level of government. A future post will look at the state and municipal levels.

The current political system in Mexico derives from the Constitution of 1917 which emerged from the Mexican Revolution. The Constitution is a sweeping document that captures the ideals of the Revolution, but also reflects three centuries of Spanish colonial rule. The Constitution is “revolutionary” in that it aggressively protects the rights of workers, peasants and their organizations. It guarantees the right to organize, an eight-hour work day, the rights of female and child workers, and the payment of a minimum wage sufficient to satisfy the necessities of life. The colonial influences are evidenced by highly codified civil law, acceptance of heavy state involvement in civic affairs and business, and the relative strength of the executive over other branches of government. Another important influence is Mexico’s 19th century history which included foreign military occupations, loss of half the national territory and several virtual dictatorships.

The government of the United Mexican States has three branches: executive, legislative, and judicial.

The executive branch is by far the most important and most powerful. The President serves a six-year term, may never be re-elected, and appoints the 18 cabinet secretaries who run their respective secretariats or ministries. The full cabinet meets only rarely. Legislation must be signed by the President to become law. Though the legislature may override a veto, the Constitution dictates that laws can only be enacted after being signed by the President. The President has the power to issue basic rules (reglamentos) independent of the legislature. In fact, most Presidents unilaterally issue more Mexican laws than are passed by the legislature.

The legislature consists of a Senate and a Chamber of Deputies. The 128 senators serve the same six-year term as the President and cannot be re-elected. Each state and the Federal District has two senators from the party getting the most votes in that state and one from the party getting the second most votes.

These 96 senators do not represent equal numbers of constituents. Smaller states have greater representation. For example, in the State of Mexico there are about 4.7 million people per senator whereas in Baja California Sur there are only about 170,000 people per senator. The remaining 32 senators are elected by proportional representation based on the percentage of the national vote obtained by each party. These senators do not have geographical constituents.

There are 500 deputies in the Chamber. Geographic districts directly elect 300 deputies; the remaining 200 are elected by proportional representation. A party must win at least 2% of the national vote to get a deputy in the Chamber. They serve three-year terms and cannot be re-elected.

The ban against re-election means that every three years there is an entirely new Chamber of Deputies. Every six years Mexico has a new President and all new legislators. The ban on re-election diminishes the continuity as well as the overall experience and expertise of Mexican government at all levels.

The judiciary is divided into federal courts and state courts. The federal courts have jurisdiction over constitutional issues, most civil cases (contracts, labor issues, banking and commerce) as well as major felonies (bank robberies, kidnapping), except murder. State courts handle murders, divorces and minor felonies. The Supreme Court consists of 26 judges, selected by the President and confirmed by the Senate. Legally, they serve for life but actually submit their resignation to the new President every six years. Below the Supreme Court are four chambers of judges dealing with criminal, civil, labor and administrative issues. There are 16 federal circuit courts and 68 district courts.

Are homicide rates in Mexico increasing? Perhaps, but…

 Other  Comments Off on Are homicide rates in Mexico increasing? Perhaps, but…
Aug 252011
 

This question is far more complicated to answer than might initially appear. To start with there are two primary sources of homicide data in Mexico which provide very different results and vary significantly from state to state and year to year.  The National System of Public Security (SNSP) compiles homicide statistics from police reports and investigations.  The National Institute of Statistics and Geography (INEGI) obtains homicide data from death certificates reported through the Ministry of Health. For 2010, SNSP reported 35,053 homicides in Mexico, while INEGI – Reporta el INEGI más de 24 mil muertes en 2010 – reported 24,374 homicides.

For a very interesting comparison (in Spanish) of trends over time for these two data sources, including a detailed look at the trends in some individual states, see:

For two earlier posts using SNSP data, see:

What factors may explain why the data is so different?

The terminology associated with homicides is very complex. This is equally true in English and Spanish. Even the basic subcategories do not necessarily match closely from the legal system in one country to that in another. Legal definitions and classifications depend in part on subjective decisions by officials concerning such things as the perpetrator’s motive, intent and state of mind.

In general terms, homicide (homicidio) means the deliberate killing of one person by another. A homicide may be either an:

  • intentional homicide or murder (homicidio doloso) or an
  • involuntary homicide, negligent homicide or case of manslaughter (homicidio culposo)

In some jurisdictions, intentional homicides are further divided into such categories as “first degree murder” and “second degree murder”.

The data associated with homicides are at least as complicated as the legal definitions. Statistics originating from police records will never exactly match those coming from death certificates or public records. For instance, some individuals may have been recorded originally as dying from accidents, natural causes or suicide on their death certificates, but then shown later to have been intentionally killed (murdered) and therefore counted in police records as murder victims. There are numerous possible scenarios in which the police data will differ from the data recorded on death certificates.

Differences in terminology, definitions and application may explain some of the differences in the two data sets, but is very unlikely to explain 100% of such significant differences, so care is needed before drawing any conclusions about Mexico’s homicide rate.

What do the figures for homicides suggest?

In 2000, INEGI, Mexico’s National Statistics Agency, recorded 10,743 homicides in Mexico. This number dropped gradually to 8,897 in 2007 before jumping up to 14,006 in 2008, 19,803 in 2009 and leaping  23% in 2010 to 24,374. Current information suggests the number of homicides will be at least as high in 2011.

The SNSP data have become significantly higher than INEGI data in recent years. They also show an increase in the number of homicides in 2010 (compared to 2009), but of only 11%.  Both data sets indicate a rapid increase. This is especially troublesome given that murder rates had declined rather steadily up until the “drugs war” started in earnest in 2007.

If we average the INEGI and SNSP numbers, it suggests that the overall 2010 homicide rate was about 27 per 100,000 population.

How does Mexico’s murder (intentional homicide) rate compare to that in other countries?

Wikipedia’s list of intentional homicide (murder) rates claims that Mexico’s murder rate in 2010 was 15 per 100,000. SNSP data for Mexico show 2010 figures of 18 per 100,000. Either of these figures is very high compared to Canada (1.6 per 100,000), Peru (3.2) or the USA (5). On the other hand, Mexico’s homicide rate is rather low compared to Honduras (78), El Salvador (65), Venezuela (48), South Africa (34) and Brazil (25). In 2007, Mexico’s murder rate was about 8.4 per 100,000, very close to the world average.

How many of Mexico’s murders are drug-war related?

Data released last January by the Mexican government indicated that drug-war deaths increased in 2010 by 5,659 from 9,614 to 15,273. These data suggest that 63% of Mexico’s intentional homicides in 2010 were related to drug violence compared to only 49% in 2009, 28% 2007 and roughly 10% in 2006. In fact, non-drug-war-related intentional homicides in Mexico appear to have declined 11% from 10,189 in 2009 to 9,101 in 2010, less than the total number of homicides in any year from 2000 through 2006.

This brings us back to our original question, “Are homicide rates in Mexico increasing?” Yes, they are increasing, but only as a result of the much publicized “war on drugs”. It is likely that if there was no drugs war, then Mexico’s homicide rate would be continuing to decline, consistent with its long-term trend.

Related posts, relying on data issued by the Office of the President of Mexico:

The troubled rise of the Green Movement in Mexico

 Other  Comments Off on The troubled rise of the Green Movement in Mexico
Aug 012011
 

Two specific events helped stimulate the rapid growth of Mexico’s green movement in the 1980s:

These motivated many citizens to take direct action. Membership in Environmental Non-Governmental Organizations (ENGOs) surged, as “green brigades” aided the victims. Two months after the earthquake, representatives from 300 regional groups met and formed a coalition of green groups focused on issues such as deforestation, pollution, and opposition to nuclear power. The 1992 Rio UN Environmental Summit and opposition to NAFTA (because it neglected environmental issues) provided additional stimulus to the movement.

The number of ENGOs increased from fewer than 30 in 1985 to about 500 by 1997 when about one in twenty Mexicans was a member of an ENGO.  The ENGOs had highly professional staffs and were well funded from Mexican and international sources. Through demonstrations and militant actions they successfully stopped the construction of a half billion dollar tourism complex south of Mexico City and the proposed world’s largest salt mine in Baja California. They also were significant in the passage of new laws for environmental protection, reducing deforestation, protecting wildlife, and establishing protected areas.

Vicente Fox, the PAN/Green Party candidate, won the Presidency in 2000.  His Minister of the Environment, Víctor Lichtinger, brought scores of highly qualified fellow key ENGO leaders into the administration. While this put the nation’s leading environmentalists on the inside, it also essentially “decapitated” and deflated the ENGO movement, especially its more militant members. Despite these key appointments, Fox’s administration gave relatively low priority to environmental issues. When Fox sided with tourism investors, and decided against issuing a detailed analytical report on beach pollution, Lichtinger and many of his senior staff resigned. They mostly moved to international or academic positions and consequently did not rejuvenate the leadership of the ENGOs they had left.

Green party logo

Green party logo

For the 2006 election, the Green Party formed an alliance with PRI and came in a weak third. The party, which has suffered from despotism, bribery and violation of election laws, managed to elect 22 diputados in the 2009 election. The Calderón Presidency has obtained good environmental marks for its leadership in global warming; however its comprehensive tree-planting program has received some criticism. Current ENGO activity is focused less on high profile mass mobilizations and protests, and more on specific issues such as legislative  lobbying, public awareness, climate change, energy issues, water, deforestation, biodiversity, recycling and local tree=planting and clean-up campaigns.

Main source: Jordi Díez, “The Rise and Fall of Mexico’s Green Movement”, European Review of Latin American and Caribbean Studies 85, October 2008, 81-99.

Mexico’s environmental issues are analyzed in many chapters of Geo-Mexico: the geography and dynamics of modern Mexico, including chapter 30. Explore the book using Amazon.com’s Look Inside feature and buy your copy today!

Mexico’s Pemex: the government cash cow that environmentalists love to hate

 Excerpts from Geo-Mexico  Comments Off on Mexico’s Pemex: the government cash cow that environmentalists love to hate
Jul 252011
 

Petroleos Mexicanos (Pemex), the giant, state-owned petroleum company, is a symbol of national pride with revenues of over $100 billion in 2008. However, it is cash poor because most of its revenue goes to the government, covering 40% of the national budget. Pemex is $40 billion in debt and its maintenance budget is insufficient to keep its old infrastructure operating safely. About a third of Pemex’s 50,000 km of pipeline is over 30 years old and susceptible to failure.

Environmentalists love to hate Pemex because it has inflicted enormous environmental damage. The June 1979 blowout at the Ixtoc-I drilling rig in the Bay of Campeche resulted in the world’s second largest ever unintentional oil spill: over 450,000 tons, surpassed only by BP’s Deepwater Horizon, but more than ten times the size of the 1989 Exxon Valdez disaster. In November 1984 a series of explosions at a Pemex storage facility in San Juan Ixhuatepec in northern Mexico City started major fires killing about 500 people.

A massive gasoline leak into Guadalajara’s sewers in 1992 resulted in a series of explosions that resulted in over 200 deaths. In recent years numerous smaller, but still fatal, explosions and pipeline failures flooding rivers with oil have brought new attention to Pemex’s environmental damage and failing infrastructure.

cover of "como destruir el paraiso"

It has long been recognized that environmental damage is particularly severe near the conglomeration of Pemex facilities in southern Veracruz near the mouth of the Coatzacoalcos River. The river suffers from chronic heavy petroleum pollution, receiving massive doses periodically when pipelines break. Possibly the only beneficial outcome of the decades of widespread damage caused by Pemex in its principal areas of operation in Veracruz, Tabasco and Campeche was that it prompted the publication in 1983 of Cómo destruir el paraíso (How to destroy Paradise), a book which gave an immense boost to Mexico’s then fledgling environmental movement.

Federal environmental agencies have had only limited success in forcing Pemex to take corrective actions. Pemex recognizes the problems and applies each year for more maintenance funds from the government. The government, however, sets a higher priority on funding exploration since Mexico’s oil reserves are running out. Pemex is fundamental to the Mexican economy but needs investment in maintenance and must become more accountable for its environmental impacts.

Mexico’s environmental issues are analyzed in many chapters of Geo-Mexico: the geography and dynamics of modern Mexico, including chapter 30. Explore the book using Amazon.com’s Look Inside feature and buy your copy today!

How will reduced out-migration impact Mexico’s total population?

 Updates to Geo-Mexico  Comments Off on How will reduced out-migration impact Mexico’s total population?
Jul 192011
 

As described in an earlier post –Is massive Mexican migration to the USA a thing of the past?– we examined a 6 July 2011 New York Times article which indicated that Mexican migration to the USA had slowed to barely a trickle. If this is correct, Mexico’s population will be considerably higher in future years. This post estimates what this impact will be.

In another post –Projecting Mexico’s population: when, if ever, will it stop growing? – we incorporated the results of Mexico’s 2010 census and 2008 migration estimates into the most recent official population projection available from the Mexican Government’s CONAPO (Spanish acronym for National Population Commission). This analysis indicated that Mexico’s population would peak at 140.5 million in 2043, rather than the 130.3 million indicated in the older CONAPO projection.

If net migration becomes zero in the future, as suggested in the New York Times article, Mexico’s population will peak at 149.3 million in 2051. If net migration in future years is between the 2008 estimate of 203,000/year and zero, say 100,000/year, then the Mexican population will peak at 144.9 million in 2049. Clearly, the variation in these projections of almost nine million (149.3 verses 140.5) is quite significant. Given these different projections, our current thinking is that Mexico’s population will probably peak at around 145 million about mid-century.

Though population projections based on birth and deaths rates tend to be fairly accurate, net migration projections are far more precarious. Actual net migration between the two countries will depend on a wide range of future socio-economic variables for both countries. The most obvious of these variables will be fertility rates, growth of the working age population, education opportunities, economic growth, trade regulations and trends, job availability, unemployment rates, and personal preferences of both workers and retired people. There undoubtedly will be surprises such as technology changes or climate change. Some of these may have very profound impacts on migration, and therefore on total population levels.

Migration between Mexico and the USA is the focus of chapters 26 and 27 of Geo-Mexico: the geography and dynamics of modern Mexico. Explore the book using Amazon.com’s Look Inside feature; buy your copy today!

The spacing of central places in Mexico

 Excerpts from Geo-Mexico  Comments Off on The spacing of central places in Mexico
Jul 162011
 

Central place theory may work quite well in Mexico in terms of the relative numbers of settlements of different size, but the theory also suggests that those places on the same level of the urban hierarchy should form a distinctive spatial pattern and be roughly equidistant from one another. In essence, this means that each of these central places will be at the center of an approximately equally sized market area, or sphere of influence, well positioned to serve everyone who lives within its limits.

The application of central place theory to Uruapan, Michoacán

The application of central place theory to Uruapan, Michoacán. Credit: Tony Burton / Geo-Mexico; all rights reserved

The map shows the settlements in the western part of the state of Michoacán. The largest city by far is Uruapan (250,000 inhabitants in 2008). Around Uruapan are six fairly large neighboring towns or cities. Each of these settlements has its own corresponding market area. However, even though these six places are roughly equidistant from Uruapan, they turn out to be very different in size. For example, Zamora (240,000) has more than four times the population of Pátzcuaro (53,000). Zamora is bigger because in addition to providing services to a larger, more prosperous, surrounding market area, it also has some manufacturing and is on a railroad line and the original highway between Mexico City and Guadalajara.

In addition, there is no observable regularity in the pattern of settlements of the two smaller sizes—“other towns” and “urban localities”—shown on the map. This is clearly in contradiction to central place theory, but should not really be a surprise. The theory assumes, for the sake of simplicity, that large areas will not have any significant differences in relief or soil fertility and that transport costs will be directly proportional to distance. It also assumes that rural areas have equal population densities and that their residents have similar consumer tastes and purchasing power. In practice, these assumptions are not valid, and some of the anomalies in the pattern of settlements shown on the map can be easily explained. For instance, the areas immediately north of Apatzingán and east of Nueva Italia are very mountainous, far less favorable for farming and settlement than the area north of Uruapan.

The very idea that settlements will be equidistant from one another begs a very important question, pertinent to our earlier discussion of the categories of rural settlements. Should we measure distance only in a spatial sense, in kilometers, or might it be more worthwhile to consider it in terms of the time or monetary cost required to make a particular journey, taking into account the terrain and transportation network?

In summary, central place theory does a good job of explaining the number of central places at each level and the types of services they provide. At the same time, departures from the idealized shape and size of market areas predicted by the theory help to reveal the complexities of Mexico’s physical, human and socio-economic geography.

Related posts: