Search Results : jalisco

The changing geography of drug trafficking routes in Mexico

 Mexico's geography in the Press  Comments Off on The changing geography of drug trafficking routes in Mexico
Feb 262011
 

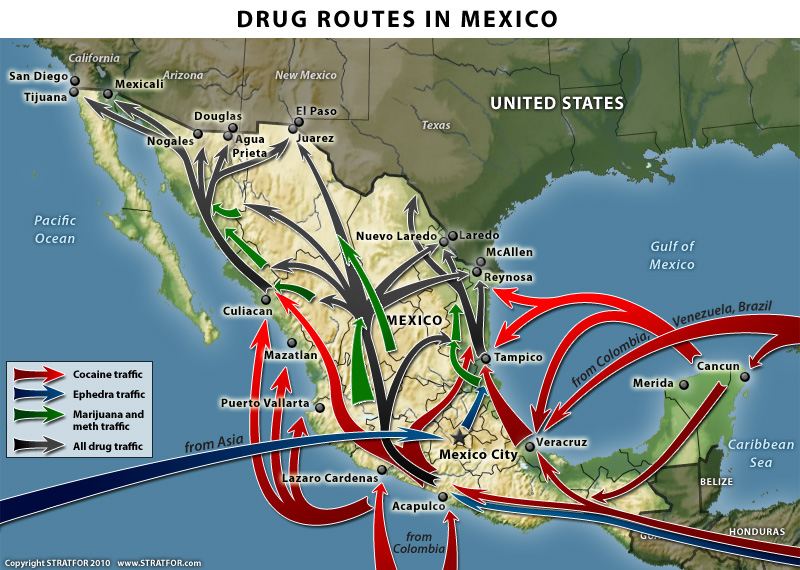
Last year, we reproduced an earlier version of this Stratfor map in The geography of drug trafficking in Mexico. The recently released new version, shown below, shows several changes from the earlier version.

Drug routes through Mexico

Drug routes in Mexico. Copyright Stratfor. Click map for enlarged version.

Map © Copyright 2010 Strategic Forecasting Inc, STRATFOR www.stratfor.com. This map is republished with permission of STRATFOR.

The main changes are that the new map:

  • does not show the territories controlled by each of the major drug cartels. As we have noted previously, the boundaries between cartel territories are hotly disputed and in a constant state of flux.
  • shows more marijuana traffic originating from Jalisco and Michoacán states.
  • labels the importing of ephedra from Asia as coming “from China”
  • adds a new route for ephedra trafficking from Central America through Guatemala and along Mexico’s Pacific Coast towards Acapulco.
  • strengthens the arrows showing a much larger movement of “all drug traffic” northwards from central Mexico through Chihuahua state and towards the border city of Ciudad Juárez, with branches of this flow extending not just to the Pacific Coast (as in the old map) but also to the Gulf Coast.

What do these changes mean?

First, it is apparent that the overall pattern of drug trafficking routes is more complex than originally thought. Shifting alliances between trafficking groups means that the “map” is being constantly redrawn to reflect the changing relative strengths of the different cartels and drug gangs.

These shifts in routes, and in the zones at the margins of each cartel’s territory mean that the focus of drug-related violence in Mexico is not limited to fixed locations, but that virtually anywhere in the country could find itself “in the wrong place at the wrong time” at some point in the future.

This is quite different to the pattern of drug-related violence 30 or 40 years ago, when most of the problems were concentrated in a relatively small number of generally isolated areas where the drugs were actually grown.

To read more posts about the geography of narcotic drugs in Mexico, use the “drugs” tag in the navigation bar on the left hand side of each page.

Other relevant link

Geo-Mexico: the geography and dynamics of modern Mexico discusses drug trafficking in several chapters.  A text box in chapter 20 looks at the drug trafficking business and efforts to control it.  Buy your copy today to have a handy reference guide to all major aspects of Mexico’s geography!

Cold weather wreaks havoc on crops in Sinaloa, Mexico

 Mexico's geography in the Press  Comments Off on Cold weather wreaks havoc on crops in Sinaloa, Mexico
Feb 212011
 

Corn production has been the core of Mexican agriculture throughout its history, and continues to be very important. Production has increased by more than 40% since 2000. Currently corn is grown on about half of all agricultural land. However, corn is a rather low value crop and accounts for only about 14% of total crop value.

Corn, for both human and livestock consumption, is grown virtually everywhere in Mexico and is the leading crop in 17 of the 32 states. The leader in volume of corn produced is Sinaloa with 28% of the national total. Other major corn states are Jalisco (12%), State of Mexico (6%), Michoacán, Guanajuato and Guerrero (5% each).

The unusually cold weather in early February 2011 hit farming areas in northern Mexico particularly hard. Farmers in Sinaloa, the “Bread Basket of Mexico,” report that 300,000 hectares (750,000 acres) of corn were destroyed after unusually cold temperatures in the first few weeks of the year. A further 300,000 hectares suffered some damage. Sinaloa has 470,000 hectares of farmland devoted to the white corn used to make tortillas; 90% of this area has been damaged. Heriberto Felix Guerra, federal Secretary for Social Development (SEDESOL) called the weather-related losses the worst disaster in Sinaloa’s history. The economic loss could exceed three billion dollars.

The federal Agriculture Secretariat is rushing urgent aid to farmers, including tax breaks and low-interest loans for seed, in the hopes that many of them can replant their corn crop while there is still time. As of today, more than 130,000 hectares of corn in Sinaloa have already been replanted. The aim is to reseed between 200,000 and 300,000 ha (500,000-750,000 acres) of corn, for an eventual harvest (in Sinaloa) of 3 million metric tons of corn. The reseeding must be completed by 10 March as, after that date, there are too few “growing days” to guarantee a harvest. Average yields in Sinaloa for white corn are expected to fall from their usual 10 tons/ha to around 7 tons/ha this year.

Mexico has an annual shortfall in corn production and always has to import some corn (mainly from the USA and South Africa) to meet total domestic demand. This year, the government is considering raising its usual import quotas to ensure ample supplies of corn (and tortillas) for the coming year. Corn prices have already shot up; Mexico’s imports are going to cost a lot more than in recent years.

Citrus orchards, tomato crops and other vegetables were also decimated. Tomatoes are by far the most important horticultural crop in Sinaloa, but other crops affected include green beans, squash and chiles. It will be another 6 weeks to 2 months before another tomato harvest is possible. The price of tomatoes also rose immediately and could double, at least temporarily, within the next few weeks.

The Mexican tomato crop is mainly the larger Roma variety which is widely used in the fast food industry. Already at least one fast-food chain in the USA is adding tomato slices to hamburgers only on request; the smaller tomatoes used in salads are not affected by the recent cold snap.

Previous related posts:

Feb 192011
 

Tomatoes are one of the many native Mexican plants that have become essential ingredients in the cuisine of many countries. Mexico is the 10th largest tomato producer in the world, after China, USA, India, Turkey, Egypt, Italy, Iran, Brazil and Spain (FAO 2008).

Mexico produces both red tomatoes (tomate or jitomate, depending on the region) which have high yields and account for about 75% of total tomato production, and green tomatoes (tomate verde) which have a lower yield and account for the remaining 25% of production.

The statistics in this post apply to the production and export of red tomatoes only.

The main varieties of red tomatoes in Mexico are:

  • vine-ripe large rounds
  • cherry tomatoes
  • Roma tomatoes, which now account for 54% of all tomato plantings in Mexico, as demand for them has increased at the expense of other kinds
  • greenhouse tomatoes (the collective name for several other varieties)

Greenhouses

The single most significant trend in tomato growing in Mexico is the increasing volume of production coming from greenhouse (including shade house) cultivation. Greenhouse cultivation still represents only a small portion of total tomato production in Mexico, but results in greatly improved yields.

Mexico has around 3,200 hectares of horticultural greenhouses in total. An earlier post analyzed the essential characteristics and advantages of the production of horticultural products in greenhouses.

The major advantages for tomato production are:

  • helps to raise yields
  • enables producers to move away from seasonal production and grow tomatoes virtually the entire year
  • ensures a higher quality and consistency of product
  • facilitates better food safety
  • helps to ensure that production and packing plants meet or exceed international standards

Rising yields

Yields are rising. Open field yields have risen from 23 metric tons/ha in 1990 to 28 mt/ha in 2000 and to 39 mt/ha in 2010. The highest open field yields are about 45 mt/h in Baja California and Sinaloa, due in part to their efficient pest and disease control protocols.

Greenhouse cultivation of tomatoes gets much higher yields, but also requires more capital investment and more expensive inputs of labor, fertilizers and pesticides. Open field cultivation of tomatoes in Sinaloa and Baja California costs between $3,800 and $6,000/ha. Greenhouse and shade house production of tomatoes can cost up to $22,000/ha. (All figures in US dollars.) The costs associated with many imported inputs (agrochemicals, seeds and fertilizers) are high; they are also dependent on the peso/dollar exchange rate.

Greenhouse yields in Mexico are generally about 150-200 mt/ha. Tomato growers in the USA and Canada using greenhouses achieve yields of up to 450mt/ha, so Mexican producers still have plenty of room for continued improvement.

The largest area of greenhouse tomato cultivation is in Spain (20,000 hectares). By comparison, the USA has only around 350 ha of greenhouse tomatoes, Canada has 650 ha and Mexico 730 ha.

Area cultivated and volume of production

The total area (greenhouse and open field) devoted to tomato cultivation in Mexico has decreased in recent years, from 85,000 ha in 1990 to about 60,000 in 2010.

Tomato production in Mexico for the 2010/11 season is forecast to reach 2.2 million metric tons.

Seasonality

There are two major seasons:

1. In the winter season (October-May), growers in Sinaloa are the main producers and exporters of fresh tomatoes. Michoacán, Jalisco, and Baja California Sur also produce significant amounts in the winter season. Sinaloa growers have adopted very modern cultivation methods, selecting varieties with an improved and extended shelf life, employing highly efficient drip irrigation, and using plastic mulch to maintain their high yields. Sinaloa has 15,000 hectares devoted to tomatoes, of which 1,340 hectares are using greenhouses or shade houses.

2. During the summer season (May-October), growers in Baja California are the main producers and exporters of fresh tomatoes, along with growers in Michoacán, Jalisco, and Morelos.
Tomatoes on a stamp

Mexico Exports: Tomatoes

Domestic consumption and the export market

The final consumption figure for the domestic market depends largely on the volume of tomato exports (primarily to the USA), since domestic consumption is essentially restricted to those tomatoes that do not enter the export flow. Volumes of exports, and price/ton depend on numerous factors beyond the control of farmers in Mexico, including, for example, the seasonal weather in Florida which will help determine the volume of tomatoes produced in the USA.

The USA imports tomatoes from both Canada and Mexico. Mexico’s share of USA tomato imports has risen rapidly since 2000 on account of their lower costs. Mexican tomatoes are less expensive for USA buyers than their Dutch or Canadian counterparts, due to Mexico’s cheaper labor rates, lower transport costs, and their modern cultivation and packing systems.

Mexico’s 1.1 million tons a year of tomato exports are worth 1.1 billion dollars. Mexico does import some tomatoes, but the annual value of imports rarely exceeds 65 million dollars.

Potential risks faced by Mexico’s tomato growers

  • extreme heat may make tomatoes ripen earlier than usual, as happened in Sinaloa in December 2009
  • the switch from open field tomato production to protected production (in greenhouses or shade houses) requires an expensive investment in infrastructure and technology.
  • international prices each year are a major determinant of how many hectares of tomatoes are planted the following year

Note on the first GM tomato

The first GM tomato to be commercially cultivated was the Flavor Saver from the Calgene company, planted in 1995 in Mexico, California and Florida. It was marketed as the MacGregor tomato. It was primarily developed because it did not spoil as quickly as previous varieties of tomato. MacGregor tomatoes last at least 18 days without spoiling, from the time they are picked. Conveniently, consumers also preferred their taste to then-existing varieties. Developing the first GM tomato cost Calgene 25 million dollars and took 5 years.

Main source:

Flores, D and Ford, M. Tomato Annual: area planted down but production up. USDA Foreign Agricultural Service GAIN (Global Agricultural Information Network) Report, January 2010

Feb 162011
 

The commercial greenhouse production of horticultural crops in Mexico started in the 1950s, with floriculture (flower-growing) operations. It then expanded to include some vegetables in the 1980s. During the 1990s, larger, more modern greenhouses were introduced specializing in the growing of vegetables for export markets.

In 1991, Mexico had only 51 hectares of vegetable production in greenhouses. The signing of NAFTA in 1994 stimulated increased investment in Mexico from Israel, Holland, and Spain in greenhouse systems designed to boost vegetable production for the US market.

The area of greenhouses has risen rapidly since then to about 2,400 hectares in 2009, almost double the area recorded for 2005, and including 1,000 hectares devoted to flowers.

What are the advantages of production using greenhouses?

  • possible to control the environment
  • enables a higher quality of product, suitable for international markets
  • improves food safety
  • allows growers to have a tighter control on water quality
  • enables farmers to supply winter markets when fresh food prices are at a premium
  • avoids or offsets weather-related problems, such as cold spells or heavy rain
  • allows farmers to perfect crop timing to match times of highest prices
  • avoids some open-field issues such as weeds and insect pests
  • takes advantage of Mexico’s long days and many hours of strong sunlight

What are the disadvantages of production using greenhouses?

  • construction costs
  • costs to install necessary infrastructure, such as water supply
  • cost of energy required to heat greenhouse in the event that sunshine is insufficient
  • nearby residents may object to the unsightly view of hectares of greenhouses

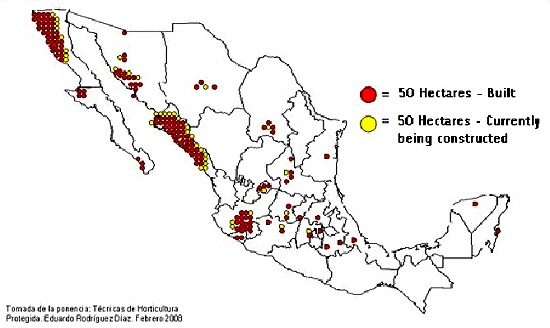
Protected horticultural areas in Mexico

Protected agricultural areas in Mexico (greenhouses and shade houses), 2007. Source: Mexican Association of Protected Horticulture

Where are most of Mexico’s greenhouses located?

Vegetable greenhouse production is highly developed in five states (see map):

  • Sinaloa (26.3% of Mexico’s total production of greenhouse vegetables)
  • Baja California Sur (13.5%) -NB this state’s protected area has increased sharply since 2007, the date of the map
  • Baja California (9.5%)
  • Jalisco (7.4%)
  • Sonora (6.9%).

Combined, these five represent 84% of the total greenhouse production of vegetables.

By area planted, the major crops produced in greenhouses in Mexico are:

  • tomatoes (60% of the total)
  • cucumbers (20%)
  • chiles (10%)

One clear trend is that the area of all these crops is expanding very rapidly. For instance, from 2007 to 2008, the area devoted to the greenhouse production of tomatoes rose 19%, while chiles and cucumbers rose 35% and 29% respectively.

95% of Mexico’s greenhouses are plastic, rather than glass, mainly because the extra insulation afforded by glass is not required in most parts of Mexico given the climate. Many greenhouses are now made in Mexico, but others are imported from Israel, Canada, the Netherlands, Spain, France and the USA. Many of the greenhouses are high-roofed, between 4 and 5 meters tall.

A basic greenhouse structure covering 1 hectare (2.4 acres) costs about $160,000, excluding the cost of any irrigation system. Because financing is difficult to obtain in Mexico, many producers rely on relatively low-cost plastic greenhouses, which do not usually have any heating systems. Some newer models have hot water or gas heating systems which guarantee that crops can be timed to coincide with peak demand during the US winter.

In an effort to hasten the adoption of improved horticultural technology, the Agriculture Secretariat (SAGARPA) has started a shared-risk fund to encourage greenhouse installation, provided it is to grow crops other than tomatoes, including herbs, chiles and lettuce.

Besides initial costs, another major constraint on the expansion of greenhouse systems in Mexico is distance from the main markets north of the border. From some areas, reaching markets in California requires a 36-hour truck ride. Any delay means that the crop will not arrive in optimum condition.

Another limitation which restricts the universal adoption of greenhouses is that they generally need a good supply of water. This is not always easy (or cheap) to obtain, especially in arid areas such as Baja California.

Finally, as with most farmers, greenhouse operators in Mexico face competition from growers in other countries, and also have to contend with market volatility (whether real or perceived).

Sources:

Lopez, J. and K. Shwedel. 2001. The Mexican greenhouse vegetable industry. Industry Note 032-2001, 5 pp.

Cantliffe, D and Vansickle, J. Mexican Competition: Now from the Greenhouse. http://hos.ufl.edu/protectedag/pdf/MexicanGHindustry.pdf [accessed 22 January 2011]

Flores, D and Ford, M. Greenhouse and Shade House Production to Continue Increasing. USDA GAIN report, 22 April 2010. [accessed via link at http://www.freshplaza.com/news_detail.asp?id=62580; accessed 27 January 2011]

The rates of drug war deaths vary enormously in Mexico’s states

 Updates to Geo-Mexico  Comments Off on The rates of drug war deaths vary enormously in Mexico’s states
Jan 292011
 

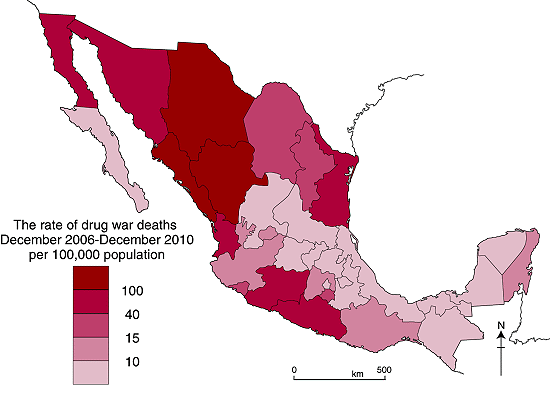
Despite what some media reports might suggest, not all parts of Mexico are plagued with serious drug war violence. A previous post – Deaths from war on drugs have increased rapidly since 2006 – discussed which states accounted for the most drug war deaths during the last four years and noted that these states were mostly in northern and western Mexico. The data on drug war deaths include deaths of drug cartel members, law enforcement personnel, and innocent by-standers.

A more accurate way to compare states is to incorporate population to determine the rates of drug war deaths. The table above, and the map below, were compiled using the recently released data on deaths and the preliminary results of the 2010 census. There are some obvious methodological issues associated with combining drug war death figures for a four-year period with a population “snap shot” taken in mid-2010, but we believe these issues are minor and will not have any significant effect on the broad patterns of drug war deaths that the analysis reveals.

Drug war death rates, by state, December 2006-December 2010

The national average rate is 30.81 deaths per 100,000 population. It is not surprising that the State of Chihuahua, which led the country with 10,135 deaths, had the highest rate, almost 300 deaths per 100,000 population. The rate for Chihuahua is almost ten times the rate for the country as a whole. The rates for the other leading drug war states are significantly smaller, but way above the national average.

The four most populous states, Mexico, Federal District, Veracruz and Jalisco, are centrally located and have death rates ranging from half the national average for Jalisco down to about a fifth for Veracruz. Interestingly, for these four states the rates decline from west to east. This pattern does hold when less populous intervening states are included. Two of these, Querétaro and Puebla have about the lowest rates in the country, about one-fifteenth the national average.  Yucatán also has a very low rate. The drug war death rates for Tlaxcala, Puebla and Yucatán are less than one half of one percent of the rate in Chihuahua. Clearly, some parts of the country are far more affected by drug wars than others.

Previous post in this mini-series:

Related posts about the geography of drug trafficking and drug cartels in Mexico:

Other relevant link

Geo-Mexico: the geography and dynamics of modern Mexico discusses drug trafficking in several chapters. A text box on page 148 looks at the drug trafficking business and efforts to control it. Buy your copy today to have a handy reference guide to all major aspects of Mexico’s geography!

Population change in the Guadalajara Metropolitan Area

 Updates to Geo-Mexico  Comments Off on Population change in the Guadalajara Metropolitan Area
Jan 252011
 

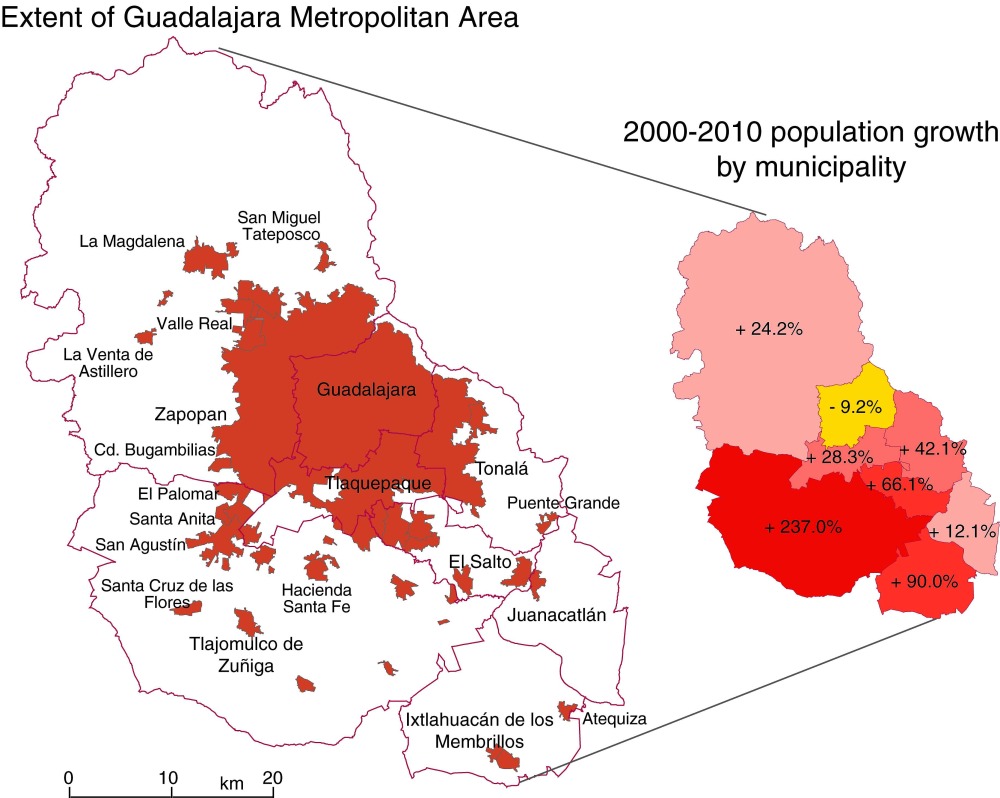
The preliminary results of Mexico’s 2010 population census reveal that the population residing in the Guadalajara Metropolitan Area (GMA) increased from 3.7 million in 2000 to 4.4 million in 2010. The census results also show clearly that the GMA is continuing to experience the effects of suburbanization and counter-urbanization.

Suburbanization is the gradual spread of the urban area into the surrounding rural areas. The built-up area of Guadalajara is spreading mainly to the south and west. The north-eastern part of the city is unable to spread beyond its existing extent because it is hemmed in by the precipitous canyon of the River Santiago, often referred to as La Barranca de los Oblatos (Oblates‘ Canyon).

Counter-urbanization is the movement of city dwellers into smaller settlements in the surrounding countryside. With time, some of these smaller settlements are eventually engulfed by the spreading city. The precise boundaries of large metropolitan areas such as the GMA are therefore subject to almost constant change. The map below shows the population change for Guadalajara and its surrounding municipalities for the period 2000-2010.

Guadalajara Metropolitan Area
Population change in the Guadalajara Metropolitan Area, 2000-2010. Click to enlarge.

Note, first, that the population of Guadalajara proper (the municipality of that name) has actually declined significantly since 2000, from 1,647,720 to 1,494,134.

The city is not bounded by the municipal boundary, but spreads into several adjoining municipalities (see map), all of which have experienced population growth between 2000 and 2010. The municipality of Tlaquepaque was already “built up”, even prior to 2000, and its population has risen only slowly since that date. The slowest rate of growth (excluding the “negative growth” of Guadalajara) is in Zapopan; this is a complete change from 30 years ago when Zapopan was growing very rapidly as Guadalajara expanded westwards.

In the 1980s and 1990s, Guadalajara also spread into Tonalá and El Salto. El Salto, relatively close to Guadalajara’s international airport, and close to the main Guadalajara-Mexico City highway, is the heart of a major industrial corridor.  Its main focus in recent years has been on high-tech firms; the region is often referred to as “Mexico’s Silicon Valley”. Firms with manufacturing and/or assembly plants in or close to El Salto include Hewlett-Packard, IBM, General Electric, Intel, Hitachi, Siemens, Flextronics and Solectron. The El Salto area has seen moderate growth over the last ten years.

By far the most dramatic rates of growth for 2000-2010 occurred in Ixtlahuacán de los Membrillos. and in Tlajomulco de Zuñiga, which more than tripled its population in just ten years, from 123,220 to 416,552. Tlajomulco is a very old settlement indeed, with considerable historical importance. The spread of Guadalajara’s suburbs into the northern part of Tlajomulco has been astonishingly rapid, and represents a classic case of the process of suburbanization. Meanwhile, the population of the long-established settlement of Tlajomulco (further south in the eponymous municipality) has also risen rapidly as some urban dwellers choose, in the process of counter-urbanization, to live slightly outside the main urban sprawl of Guadalajara. The counter-urban movement is strongest in the settlements relatively close to the city, but now extends at least 50 km to the south, to the villages on the northern shore of Lake Chapala.

What will 2010-2020 bring? There are few signs that the building boom along the southern edge of Guadalajara Metropolitan Area is going to come to a halt any time soon. The state of Jalisco plans to construct an “outer ring road” south of the city. The planned route passes very close to the settlement of Tlajomulco. It is surely only a question of time before Tlajomulco, and various other small towns and villages, are swallowed up by the continuing expansion of Mexico’s second largest city.

Two major aqueducts in the Lerma-Chapala basin

 Mexico's geography in the Press  Comments Off on Two major aqueducts in the Lerma-Chapala basin
Jan 152011
 

Two major new aqueducts will help to ensure reliable water supplies for Guadalajara and León, two rapidly growing cities in the Lerma-Chapala basin.

SIAPA (Sistema Intermunicipal de Agua Potable y Alcantarillado) is the acronym for the water supply system for the city of Guadalajara, Mexico’s second largest metropolitan area (population: 4.4 million). About 60% of Guadalajara’s potable water comes from Lake Chapala, the country’s largest natural lake, via an aqueduct. According to SIAPA Director José Luis Hernández Amaya, this existing aqueduct, built more than 20 years ago, is now inadequate. SIAPA now has construction permits in place to build a second aqueduct supplying water to the city from the lake. The plans for the second aqueduct have been approved by both state and federal regulatory bodies (the Comisión Estatal del Agua and the Comisión Nacional del Agua (Conagua) respectively).

All parties agree that boosting the amount of available water is essential for a city growing as rapidly as Guadalajara. The new aqueduct, likely to cost 2,000 million pesos, will enable the city to undertake maintenance as needed on the pumping stations and channels of both systems. Undertaking maintenance on the existing system without opening a parallel channel would involve cutting off the water supply for up to 60% of Guadalajara’s population for several days.

A new aqueduct is also planned for the city of León. According to recent press reports, the El Zapotillo dam on the Río Verde is about 21% complete. The resulting reservoir will guarantee adequate water supply for León (population: 1.6 million), and reduce its dependence on groundwater abstraction. Tenders are now being accepted for the construction of a 139-km-long aqueduct from El Zapotillo to join León’s potable water system, together with two pumping stations and a water purification plant.

The new reservoir and aqueduct should ensure that León’s water demands are met for between 25 and 30 years. In addition to León, several other municipalities will also benefit from an improved water supply, including Jalostotitlán, San Miguel el Alto, Encarnación de Díaz, San Juan de los Lagos and Lagos de Moreno.

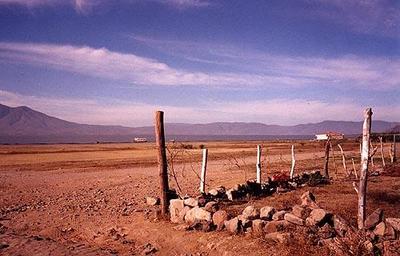
Lake Chapala in 2002

Lake Chapala in 2002, more like a desert than a lake. The lake has since recovered.

Neither plan is without its critics. Activists at Lake Chapala are concerned that supplying more water from the lake to Guadalajara will return the lake to the precarious state it was in during the 1990s. Opponents to El Zapatillo claim that the main demand for water in León is from the new industrial estates and leather tanning plants, and that supplying them with more water will only lead to further serious contamination and even more wastage of the valuable resource.

Rivers, reservoirs and water-related issues are discussed in chapters 6 and 7 of Geo-Mexico: the geography and dynamics of modern Mexico. Ask your library to buy a copy of this handy reference guide to all aspects of Mexico’s geography today! Better yet, order your own copy…

Jan 102011
 

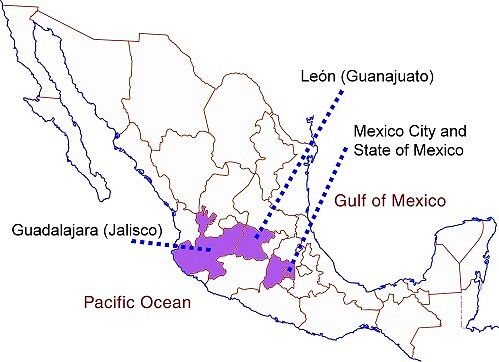
We saw in an earlier post – Mexico’s shoe (footwear) manufacturing industry: regional clustering – that Mexico’s shoe manufacturing is concentrated in three major areas: León (Guanajuato), Guadalajara (Jalisco) and in/around Mexico City.

Shoes are also an important international trade item. Latin America’s largest international footwear trade show is SAPICA (Salón de la Piel y el Calzado), which is held in León twice a year. Each time, it attracts 12,000 buyers from the USA, Canada, Europe, Japan, and Central and South America.

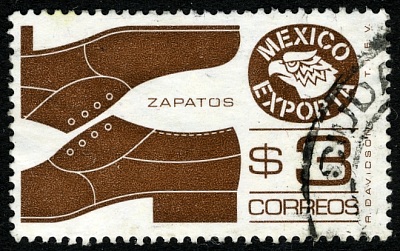
Mexico exports: shoes

Mexico exports: shoes

Exports

  • Export volume: 15 million pairs/yr
  • Value of exports: $250 million (dollars). Exports have risen steadily since 2006, despite the global economic difficulties.
  • Export destinations, by volume: USA 82%, Brazil 5%, Guatemala 2%, Japan 2% and Canada 2%.
  • Export destinations, by value: USA 84%, Japan 4%, Canada 2%, France 1% and Brazil 1%.

Imports

  • Import volume: 45 million pairs/yr
  • Value of imports: $450 million; this figure is rising at 15-20%/yr
  • Sources of imports, by volume: Vietnam 39%, Indonesia 21%, China 11%, Brazil 7%, Malaysia 5% and Thailand 5%.
  • Sources of imports, by value: Vietnam 43%, Indonesia 16%, China 14%, Italy 7% and Spain 6%.

Q. What can you deduce about Mexico’s international shoe imports and exports by comparing the percentages for trade by volume and trade by value? (eg. which countries supply more expensive shoes?)

The threat from China

At first sight, these figures do not suggest that Mexican manufacturers have much to worry about from Chinese shoe manufacturers. However, it is believed that many of the shoes entering Mexico from Vietnam and Indonesia actually originate in China. In addition, some Chinese shoes are thought to be repackaged in the USA for eventual export to Mexico.

Shoe manufacturers’ representatives in Mexico opposed China’s entry into the World Trade Organization (WTO) since they feared it would unleash a flood of cheap Chinese imports into the country. In an effort to help protect national manufacturers, the Mexican government has, for most of the past 20 years, levied a compensatory 35% tariff on shoes originating in China.

Challenges faced by Mexico’s shoe industry

  • Mexico’s shoe industry faces periodic shortages of some raw materials. In addition, the sector’s supply chains and delivery systems need strengthening.
  • The improvement of product quality may require further investment in technology and research.
  • As tariff barriers are lifted, Mexico’s shoe manufacturers will face greatly increased competition from overseas.

Source of statistics: CICEG (Guanajuato Shoe Manufacturers Association) Situación de la industria del calzado en México.

Related posts:

Mexico’s economic geography is analyzed in chapters 14–20 of Geo-Mexico: the geography and dynamics of modern Mexico. Buy your copy of this invaluable reference guide today!

Jan 052011
 

Mexico’s footwear industry is heavily concentrated in three main locations. Manufacturing is focused on the city of León in the state of Guanajuato. Factories and workshops in León account for about 68% of all shoes made in Mexico. The two other important manufacturing areas for footwear are Guadalajara (Jalisco) where about 18% of the national production originates, and Mexico City (together with surrounding parts of the State of Mexico), responsible for 12%.

How has this concentration come about?

León, in Guanajuato, is the center of one of the world’s most complete leather and footwear clusters. The area is a leading supplier and exporter of footwear, saddles and hats.

Footwear has been made in Guanajuato since 1645. The earliest association of shoe makers dates back to 1808. The sector is dominated today by firms with majority Mexican capital. Several of the foreign firms which manufactured shoes here prior to the second world war, changed the focus of their production lines in the early 1940s to specialize in supplying military footwear, leaving the making of consumer footwear to firms with national capital.

Footwear industry in Mexico

Concentration of shoe industry in Mexico.

The advantages of concentration

1. Local raw materials. Local inputs of leather and synthetics reduce the transportation costs (and time) for obtaining raw materials

2. Shared suppliers. Supporting the leather and footwear firms are local suppliers which offer machinery and equipment for tanneries, chemicals, leathers and skins, synthetic materials, dyes and textiles, as well as more specialized shoe-related items such as lasts, soles and heels, accessories and fittings. Shared information and machinery Because the shoe firms are grouped together in a cluster, ideas and information and even specialized machinery can all be shared.

3. Labor. This area has long specialized in footwear and leather products, so all firms benefit from the skilled local labor force.

4. Linkages. Both vertical and horizontal linkages between companies are important in the shoe industry. Vertical linkages occur when one company controls many or all stages in the production line. For instance, a company may make its own accessories and fittings to attach to the shoes it makes, or it may tan its own leather.  Horizontal linkages exist where one company is supplied with components (heels, soles) made by another company.

5. Economies of scale.

6. Educational infrastructure. The León area has a variety of educational, training and research centers all supporting the leather and footwear sector. This increases the chances of technological innovations, and the speed of their adoption.

The major advantages of León as an industrial location:

The position of León is key to its success. It is located in central Mexico, close to the major urban areas of Mexico City, Querétaro and Guadalajara. On a broader scale, it is close to the major export markets of the USA, Canada and Central America.

Market proximity is enhanced by an excellent communications network, including good road and rail links, easy access to several major airports, and to seaports such as Manzanillo.

The basic statistics (2009-2010):

  • Number of footwear-related firms: about 8000, half of them in Guanajuato.
  • Size of firms: 56% micro (fewer than 10 employees), 33% small (10-50 employees).
  • Employment: the footwear sector provides 140,000 direct jobs, and twice as many indirect jobs, for a total of 420,000.
  • Mexico’s largest shoe maker: Emyco, whose 4,500 workers make 6 million pairs of shoes, boots and sandals (various brands) every year. This firm alone introduces 100 new models every three months.
  • Production volume: 250 million pairs/yr, about 1.6% of world total.
  • Domestic market: 285 million pairs/yr (average of 2.5 pairs/person/yr)

The domestic market is focused on low-cost shoes, with a few exceptions, such as the market for “cowboy” boots. The manufacture of hand-crafted, high-priced cowboy boots is dominated by smaller firms such as Botas Je-Ver, Botas Jaca and Rancho-Boots, each of which employs 50-200 workers. Some cowboy boots are made from exotic hides, such as crocodile, cayman, armadillo, iguana, ostrich and snake. They are a much-prized status symbol among the upper echelons of Mexico’s drug cartels!

In future posts, we will examine Mexico’s imports and exports of shoes, and see if it is possible to identify any patterns to the distribution of shoe retailers in some of Mexico’s major cities.

Source of statistics: CICEG (Guanajuato Shoe Manufacturers Association) Situación de la industria del calzado en México.

Related posts:

Mexico’s economic geography is analyzed in chapters 14–20 of Geo-Mexico: the geography and dynamics of modern Mexico. Buy your copy of this invaluable reference guide today!

Dec 182010
 

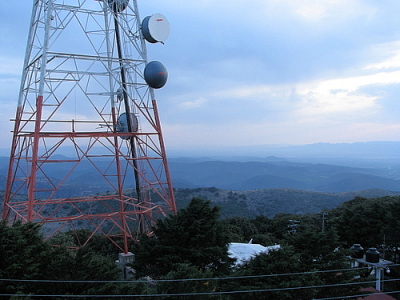
One of Mexico’s best kept travel secrets for people driving their own vehicle is the multitude of road signs all beginning with the word “microondas” (literally “microwaves”). Even visitors with good Spanish and a bilingual dictionary in their glove compartment may puzzle over the meaning of this frequently occurring sign, which invariably seems to lead onto a cobblestone track going, so far as one can tell, absolutely nowhere! There is no distant church tower, no sign of habitation, just a radio mast on the distant skyline. And that (rather than microwave ovens) is precisely what the sign refers to: a short-wave communications post!

One of the numerous benefits for the geographer is that virtually any microondas station offers a short, usually interesting side-trip, ideal for a brief respite from the demands of high speed highway driving. The well maintained, cobblestone tracks that provide access to the communications towers serve not only engineers, but also enterprising tourists. The access roads may follow devious routes but they eventually reach the gates of a fenced enclosure, invariably situated on the highest point for several miles in any direction. While there is no guarantee of an uninterrupted view, most microondas stations afford tremendous vistas over the surrounding countryside.

Microondas at top of Cerro de los Caballos. Photo: Gabriel Chaparro Tre….

View from the Microondas atop Cerro de los Caballos. Photo: Gabriel Chaparro Tre….

Very few vehicles use these excellent side roads, so they are usually safe and convenient places to stop, take a rest, stretch your legs and enjoy a picnic. As the tracks wind upwards, they often traverse successive vegetation zones, going from oak woodland up into pine forest if the mountain is high enough, for instance. This provides botanists and birders a range of habitats and transition zones worth exploring. Of course, some microondas sit on top of small mounds surrounded by a seemingly limitless flat and monotonous plain, home only to an infinite number of cacti. But others, the jewels of their kind, are in the midst of tropical rainforest looking out over canyons where spider monkeys can be seen leaping from branch to branch.

In the volcanic central areas of Mexico, microondas stations are commonly perched on crater rims, making many volcanoes fall in the “drive-in” category, including the Volcán Nevado de Toluca (Xinantécatl).  Full descriptions of the scenic wonders to be encountered on drives up, for example, Ceboruco volcano or Tequila volcano (the former in Nayarit state, the latter in Jalisco) merit a book unto themselves. To anyone who has never seen the legacies of past vulcanicity at close quarters, what more awesome and eye-opening introduction could there possibly be?

Needless to say, though you’re never far from the highway, you mustn’t expect to find any tourist amenities at microondas, not even “microwaved” fast-food. But don’t let that put you off visiting Mexican-style microwaves.

So, next time you spy “microondas” on a road sign (or, if you’re reading this in the depths of northern winter, the next time you press a button on your microwave!), remember – a short detour along one of Mexico’s best-kept travel secrets might well lead you to discover your own favorite stopping place. Someday, somewhere, someone should produce a comprehensive guide to the microondas of Mexico…

Mexico’s volcanic landscapes are discussed in chapters 2 and 3 of Geo-Mexico: the geography and dynamics of modern Mexico. Buy a copy as a seasonal gift today!

How important are remittances to Mexico’s economy?

 Updates to Geo-Mexico  Comments Off on How important are remittances to Mexico’s economy?
Nov 202010
 

There are millions of Mexican workers in the USA who send a sizable portion of their wages back to their families in Mexico. On a per person basis, Mexico receives more worker remittances than any other major country in the world.

States receiving the most remittances (highest value)

The ten states receiving the most remittances (by value). All rights reserved.

An estimated 20% of Mexican residents regularly receive some financial support from workers abroad. Such remittances are the mainstay of the economies of many Mexican communities, such as many rural areas in Durango, Zacatecas, Guanajuato, Jalisco and Michoacán. Studies suggest that the funds sent as remittances are mostly spent on housing, food, clothing and durable consumer goods. A growing portion is being invested in education and small businesses. The corollary is that only a small percentage goes towards savings.

In 2008, remittances flowing back to Mexico exceeded $25 billion.The value of remittances fell slightly in 2009, according to World Bank figures, but are forecast to increase again this year. Only India and China, both with far higher populations than Mexico, have larger sums of remittances entering their economies.

According to figures published in The Economist (13-19 November 2010), remittances in Mexico are equivalent to 2.5% of the nation’s GDP. Mexico’s degree of reliance on remittances is greatly exceeded by the comparable figures of 22.4% of GDP for Lebanon, 11.8% for Bangladesh, 11.7% in the Philippines, 7.0% in Vietnam, 6.0% in Pakistan and 3.9% for India. (In China, remittances account for only 1.0% of GDP).

Related posts on this bog:

Migration between Mexico and the USA is the focus of chapter 25 of Geo-Mexico: the geography and dynamics of modern Mexico. Ask your library to buy a copy of this handy reference guide to all aspects of Mexico’s geography today! Better yet, order your own copy…

Oct 122010
 

Q. Mexico is one of the six most biologically diverse countries on the planet.  But which states in Mexico have the greatest biodiversity?

A. In general, the southern states (which receive the highest amounts of rainfall) have the greatest biodiversity: Chiapas, Oaxaca, and Veracruz.

The three most biodiverse states in Mexico

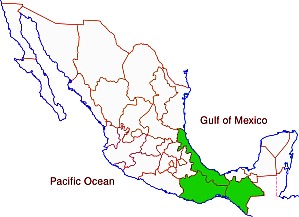
The three most biodiverse states in Mexico

To answer this question in more detail, it is useful to look at different types of plants and animals.

Mammal species are fairly well distributed throughout Mexico. Three of the wettest states lead in number of mammal species.  Chiapas has 205 different species followed by Oaxaca (194) and Veracruz (190). Interestingly, the next highest rated states are in central and northern Mexico: Jalisco (173), Michoacán (163), San Luis Potosí (152), Tamaulipas (145), Puebla (144), Durango (141) and Sonora (139). All states have over 70 mammal species, except for the relatively small states of Aguascalientes (40), Tlaxcala (50) and Guanajuato (65). Mexico as a whole has an impressive 901 mammal species; this figure places it ahead of all other countries.

Mexico is a bird watchers paradise. Veracruz and Oaxaca lead with 635 and 634 different bird species. Chiapas is third with 565 bird species followed by Sonora (445), Jalisco (438), San Luis Potosí (438), Tamaulipas (435) and Michoacán (429). Tlaxcala (86) and Aguascalientes (88) have the fewest number of bird species.

Mexico’s 808 different reptile species places it second, behind only Australia. Relative wet states lead in number of reptile species: Oaxaca (258), Chiapas (224), Veracruz (214) and Guerrero (158). However, the more arid states also have relatively large numbers of reptile species: Sonora (137), Chihuahua (118), Baja California (80) and Baja California Sur (68). Aguascalientes has only 17 reptile species.

Amphibians are very abundant in the wet southeastern states. Chiapas leads with117 amphibian species in followed by Veracruz (109), Oaxaca (106) and Hidalgo (66). Not surprisingly, there are very few amphibian species in desert states. Baja California Sur has only five species while Baja California has 12.

Mexico ranks fourth in the world in number of flowering plant species, behind only Brazil, Colombia and China. Veracruz is the clear leader with 4,907 species, followed by Chiapas (3,833), Oaxaca (3,388) and Jalisco (2,752). States with the fewest species are Aguascalientes (467), Tlaxcala (457) and Baja California Sur (484).

Mexico is also among the world leaders in number gymnosperm (nonflowering plants – mostly conifers and other evergreens) species.  Mexico has more species of pine trees than any other country. Veracruz leads with 31 species, followed closely by Nuevo León (30), Durango (29), Oaxaca (28), Hidalgo (27) and Chihuahua (26). Quintana Roo and Campeche have only one species while Colima and Yucatán have only two.

Ferns are also an important part of Mexico’s biodiversity. Chiapas leads with 693 fern species, followed by Oaxaca (669), Veracruz (534), Guerrero (374) and Puebla (297). States on the Yucatán Peninsula have relatively few fern species: Yucatán (25), Campeche (29) and Quintana Roo (39).

Source for the statistics in this post: Semarnat, El ambiente en números 2010, tabla 21: “Riqueza de grupos de species selecionadas, 2008” (CONABIO) (pdf document).

Several of our previous posts have discussed Mexico’s very wide range of climates, ecosystems and species diversity:

Chapter 5 of Geo-Mexico: the geography and dynamics of modern Mexico focuses on Mexico’s ecosystems and biodiversity.  Chapter 30 analyzes environmental issues and trends including current environmental threats and efforts to protect the environment.  Buy your copy today to have a handy reference guide to all major aspects of Mexico’s geography!

Homicide rates are declining in many Mexican states

 Updates to Geo-Mexico  Comments Off on Homicide rates are declining in many Mexican states
Sep 252010
 

Data from the Mexican National Public Security System (SNSP) indicate that Mexico’s homicide rate has declined by 23% from 37 (homicides per 100,000 population) in 1997 to 29 in 2009. It declined in 20 of Mexico’s 32 states.

The states with the homicide rates below 20 and their change since 1997 are shown below. All of the states listed except two experienced impressive declines since 1997. The two exceptions, Yucatán and Nuevo León, had the lowest homicide rates in the country in 1997. The homicide rates in the majority of these states even declined from 2007 to 2009 when the national homicide rate increased by 20%.

StateHomicide rate per 100,000 population, 2009Change, 1997-2009 (%)
Yucatán11+11
Campeche13–66
Baja California Sur14–59
Veracruz15–39
Zacatecas16–40
Nuevo León16+79
Hidalgo16–39
Federal District16–25
Querétaro17 –57
Colima18–55
Jalisco19–65
México19–63
San Luis Potosí19–11
ALL MEXICO29–23

Most of these states are not heavily affected by Mexico’s drug war violence. While these states have low homicide rates for Mexico, they are not particularly low from an international perspective.  They are about two times the rate in the USA, but about one quarter of those in Colombia.

Sep 062010
 

Bike riding is quite a common recreational activity in Mexico, as well as being many people’s chosen means of transport to work.

In recent years, an increasing number of cities have started regular bike festivals or other events. The Festival de Bicicleta in Xalapa, the state capital of Vercaruz, is just one example.

Back in 1972, in Mexico City, famous Belgian cyclist Eddy Merckx, considered by many to be the greatest cyclist in the history of the sport, smashed the world one-hour distance record by pedaling 49.431 km (30.715 miles). He simultaneously established new 10 km (6.2 miles) and 20 km records by covering 10 km in 11 minutes 53.2 secs and 20 km in 24 minutes 6.8 secs. One curiosity of this achievement is that contemporary ads for Windsor bikes purport to claim that he was riding a Windsor bike when he smashed the record, whereas he was actually riding an Italian bike! Merckx’s distance record stood for more than a decade before being broken, also in Mexico City, by Francesco Moser.

Mexico City is catching up with the craze for bike riding, too. It sees bikes as one way to reduce air pollution. About 30 km ( miles) of downtown streets, including the 8-lane Avenida Reforma, are closed to powered vehicles on Sunday mornings, to provide unhindered access for pedal bikes, walkers, and wheelchairs.

Earlier this year, the city began a bike rental system, Ecobici. More than 1,000 bikes were distributed between 85 specially-designed bike stations, spaced around the city center. Users purchase swipe cards which allow them to access a bike. After the trip, the bikes can be returned to any of the stations. City officials anticipate 24,000 riders using the system by the end of the year.

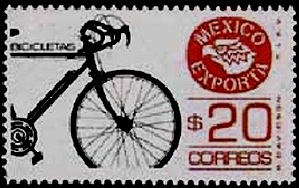
Stamp of Bike exports

As the postage stamp suggests, Mexico exports bikes, mainly to the USA. The export market has declined, however, in the past decade as several manufacturers who used to assemble bikes in Mexico have moved their operations to China. Firms which have relocated their operations away from Mexico include Huffy (formerly in Nuevo Laredo), Windzy (Monterrey), Brunswick (Ojinaga) and SRAM.

The website of the National Association of Bicycle Manufacturers claims that its 14 member companies produce about 3 million bikes a year and employ, between them, 4,000 workers.

The 14 bike manufacturers listed are:

  • Bicicletas Cinelli – Santa Catarina, Nuevo León
  • Nahel – Durango, Durango
  • Goray – Torreón, Coahuila
  • Grupo Veloci – Zapopan, Jalisco
  • Rebimo de Guadalajara – Zapopan, Jalisco
  • Biciclo – San Luis Potosí
  • Bicicletas Mercurio, Mérida, Yucatá and San Luis Potosí (they acquired the famous Acer-Mex Windsor brand in 2001)
  • Bimex – Mexico City
  • BR – Mexico City
  • Magistroni – Mexico City
  • Benotto (primarily a distributor) – Mexico City
  • Grupo Oriental – Mexico City
  • Bicicletas Ozeki – Atizapan de Zaragoza, State of México
  • Bicileyca – Yauhquemehcan, Tlaxcala

Q. Is there any pattern to the distribution of bike manufacturers in Mexico? Try plotting the locations mentioned on a map of Mexico to see if any pattern emerges.

Q. What factors do you think bicycle manufacturers must take into account when deciding where to locate?

Mexico’s manufacturing industry is discussed in chapter 16 of  Geo-Mexico: the geography and dynamics of modern Mexico. Mexico’s transportation system is discussed in chapter 17, and its exports in chapter 20.

Ask your library to buy a copy of this handy reference guide to all aspects of Mexico’s geography today! Better yet, order your own copy…

Mexico’s top 13 natural wonders

 Other  Comments Off on Mexico’s top 13 natural wonders
Aug 242010
 

According to the 1.5 million votes cast in a Televisión Azteca survey in 2007 (published in the always interesting glossy magazine mexicanísimo), the top 13 natural wonders in Mexico are (in no particular order):

  • The Copper Canyon region (Chihuahua)
  • The El Cielo Biosphere Reserve (Sierra Madre Occidental, Tamaulipas)
  • The Sumidero Canyon (Chiapas)
  • Cuatro Ciénegas oasis (Chihuahuan desert)
  • El Arrecifal coral reef ecological park (Veracruz)
  • El Pinacate desert (Sonora)
  • The Monarch Butterfly reserves (Michoacán)
  • The agave landscapes surrounding Tequila (Jalisco)
  • The Centla wetlands (Tabasco)
  • The Peña de Bernal monolith (Querétaro)
  • The Basalt Prisms of San Miguel Regla (Hidalgo)
  • The Sótano de las Golondrinas sinkhole (San Luis Potosí)
  • Xel-Há marine park (Quintana Roo)
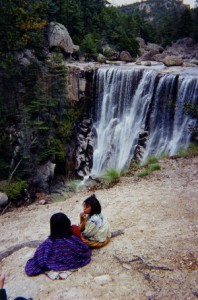
Tarahumar woman and child, by waterfall in the Copper Canyon

Tarahumar woman and child, by waterfall in the Copper Canyon. Photo: Tony Burton. All rights reserved.

Also ranked highly were

  • Cerro de la Silla (Nuevo León)
  • Estero de Palo Verde (Colima)
  • Loltún caverns (Yucatán)
  • Mexcaltitán Island (Nayarit)

We will describe each of these geographical treasures in more detail in future posts.

How many of these places have you visited?

What other places do you think should be on this list?

If you have enjoyed this post, you might also enjoy Geo-Mexico: the geography and dynamics of modern Mexico.

Buy your copy today!

Mexico’s long connection with the Philippines – exploration, seafaring and geopolitics

 Other  Comments Off on Mexico’s long connection with the Philippines – exploration, seafaring and geopolitics
Aug 232010
 

In 1559, King Philip II of Spain ordered a fleet to be prepared to sail west from New Spain (Mexico) to the Philippines. Barra de Navidad, on the shores of Jalisco, was one of the centers of New Spain’s maritime activity at the time. It offered a sandy beach in a well-protected bay; with tall forests inland to provide the necessary timber. Barra de Navidad echoed to the sounds of hammering and sawing, as the Spanish fleet was readied.

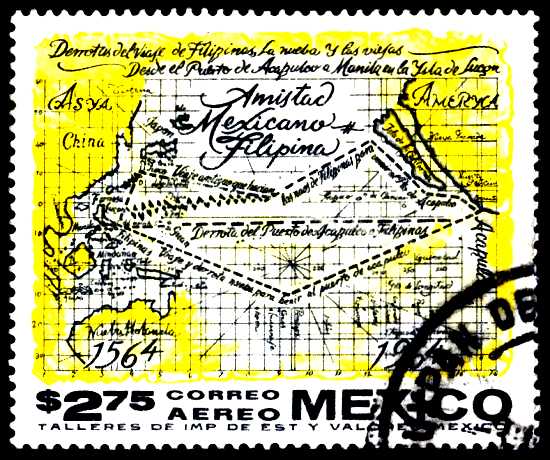
Mexican postage stamp commemorates 400 years of Mexico-Philippines friendship

Mexican postage stamp commemorating 400 years of Mexico-Philippines friendship

All western Mexico was mobilized to support the venture. Roads were built to ferry supplies from the city of Guadalajara to the Barra de Navidad boatyards. To this day, the main Guadalajara-Barra de Navidad road is known as The Philippines Way. Food, planks, sails and rigging – all had to be acquired and transported to the port. Every village had to support the effort, which was not without its dangers. For example, the Indians from Ameca complained of “many killed in the transport of rigging to Puerto de la Navidad where they are building boats to go to China.”

The expedition finally set sail at 3:00am on 21 November 1564, marking the start of more than 400 years of friendly contact between Mexico and the Philippines.

The expedition’s commander, López de Legazpi, fearing a mutiny, did not reveal their true destination to his sailors until the boats were well under way; no previous expedition had ever managed to find its way back across the Pacific Ocean. The expedition landed in the Philippines in March 1565. López de Legazpi remained there, putting his 17-year-old grandson in charge of finding the way back. In one of the most amazing feats of sailing of all time, his grandson was successful, but when the expedition reached Acapulco in October the crew was too exhausted to drop anchor. The return voyage had cost more than 350,000 gold pesos, and is commemorated today by a simple monument in Barra de Navidad’s small plaza.

The map on the stamp issued in 1964 to celebrate 400 years of friendship between Mexico and Philippines shows the expedition’s routes across the Pacific. The southern line marks the outward route, the northern line the route home.

The Spanish authorities quickly decided that bringing Asian goods from their colony in the Philippines back to Spain by crossing the Pacific, transshipping the cargo across Mexico and then sailing from Veracruz to Spain was preferable (more secure) to any alternative. Barra de Navidad soon became a regular port-of-call for Spanish sailors plying the so-called China route between Acapulco and Manila. To enable easier communication between Mexico City and Acapulco, a Camino Real (Royal Road) for pack mules was built between Mexico City and Acapulco. (A road suitable for wheeled vehicles between these cities was not completed until well into the 20th century.)

Demonstrating strong complementarity, for 250 years Spanish galleons carried Mexican silver to Manila and returned with spices, silk, porcelain, lacquer ware and other exotic goods from the Orient. These “China galleons” displaced 2000 tons and were the largest seafaring vessels of their time in the world.

But the lure of easy treasure drew pirates such as Englishman Francis Drake. In 1579, Drake sacked the small port of Huatulco, now a premier multi-million dollar tourist resort in the state of Oaxaca, and attacked the Manila galleon off the coast of California, exposing the vulnerability of Spanish sea traffic. For the next forty years, all the west coast ports, including Barra de Navidad, saw more pirates and corsairs than was good for them. Then, slowly but surely, the center of colonial operations moved further north into Sinaloa and Baja California.

Related Post

The development and characteristics of Mexico’s transportation network are analyzed in chapter 17 of Geo-Mexico: the geography and dynamics of modern Mexico. Buy your copy of this invaluable reference guide today!

Aug 092010
 

The Bracero program started in 1942 as a way to alleviate the severe US labor shortage during the second world war. It gave selected Mexicans renewable six-month visas to work temporarily on US farms. Most workers came from Michoacán, Jalisco, and Guanajuato. Many US farmers became very dependent on the productive and relatively cheap Mexican labor.

Los BracerosMany Mexican workers also entered the USA without visas and easily found well-paying jobs in agriculture and other sectors. Numerous US industries began to depend on these undocumented workers. The US government and public accepted this reality; they were preoccupied fighting a war.

The Bracero Program was considered such a success that it continued long after the war ended. It was finally repealed in 1964, largely as a result of pressure from labor unions, who felt it held down farm wages, and Latino groups which felt it impeded the upward mobility of US Hispanics.

An estimated 4.5 million Mexican Bracero workers legally entered the USA between 1942 and 1964. At its height in the late 1950s, more than 500,000 workers migrated each year. Most were temporary migrants who returned to Mexico within a year. Migration to the USA became an integral part of the socio-economic fabric of many rural communities in west central Mexico. In many cases, families and villages became trans-national. Workers divided their time between work in the USA and their families in Mexico.

The Bracero program set the stage for the continued high volume of Mexican labor migration to the USA. Closure of the Bracero program had minimal impact on migration, which continued to grow steadily through the 1960’s and 1970’s before accelerating rapidly after 1980.

For more information about the Bracero program: The Bracero Archive

For previous posts about remittances, the funds sent home by migrant workers, see:

Migration between Mexico and the USA is the focus of chapter 25 of Geo-Mexico: the geography and dynamics of modern Mexico. Ask your library to buy a copy of this handy reference guide to all aspects of Mexico’s geography today! Better yet, order your own copy…

Review of “One Hundred and One Beautiful Small Towns in Mexico”.

 Books and resources  Comments Off on Review of “One Hundred and One Beautiful Small Towns in Mexico”.
Jul 302010
 

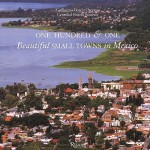
In an earlier post, we listed the towns included in One Hundred and One Beautiful Small Towns in Mexico, by Guillermo García Oropeza and Cristóbal García Sánchez (Rizzoli International Publications, 2008; 280 pp.). Here we offer a short review of the book.

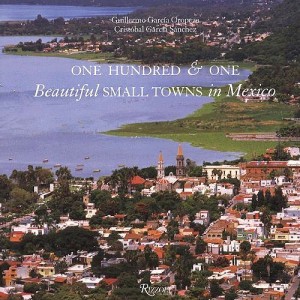
Cover of 101 Beautiful Small Towns in MexicoThis is a large format book, with many magnificent photographs. A fascinating range of places is included, even though the criteria used for their selection are nowhere explained. The selection offers lots of interest for anyone curious about Mexico’s geography.

For example, a stunning aerial view of Mexcaltitán (Nayarit) shows the cross-and-concentric-circle street pattern of “Mexico’s Venice”, surrounded by muddy brown shrimp-bearing swamps.

Curiously, the list of places included in the book on the contents pages adopts the affected style of using no capital letters whatsoever for any of the town names.

Each place is afforded at least a double page spread, and the back of the book has helpful lists of tourist offices, and selected hotels and restaurants.

Despite the title, some of the locations are more to do with the natural environment than with settlement. For instance, the town of Cuatro Ciénegas is a somewhat unprepossessing place whereas the desert oases of Cuatro Ciénegas,on which the book entry focuses, are an amazing natural zoological laboratory of crystalline water and extraordinary biodiversity. Similarly, Cacahuamilpa Caverns hardly qualify as a town!

The San Ignacio entry focuses on difficult to reach cave paintings. The village itself has few claims to fame beyond its colonial mission church.

The Paricutín double-page spread is named after the volcano which devoured several small settlements including Parícutin (for the name of the original village, the accent is on the second syllable; for the volcano it is on the last syllable). The photos included here actually show (as the captions make clear) the towns of Angahuan, and the upper facade of the church of San Juan Parangaricutiro, overwhelmed by the volcano’s lava.

A couple of places are given names that might not be very familiar to their residents. Casas Nuevas (Chihuahua) is actually Nuevo Casas Grandes (the real Casas Nuevas is an entirely different place which had only 13 inhabitants at the time of the 2000 census) and Mineral del Monte (Hidalgo) is more usually known as Real del Monte.

In southern Mexico, Santa María del Tule gets an entry. Santa María would not be worthy of mention, except for the fact that it is home to what is arguably the world’s largest tree, now thankfully restored to good health after decades of neglect.

In the Yucatán, three entries ignore the main thrust of the book, and focus instead on significant routes, one linking henequen (sisal) haciendas, one combining relatively minor archaeological sites which share distinctive Puuc architecture, and one going from one friary (monastery) to another. These are all interesting trips, but are entirely unexpected in a book specifically about towns. Some judicious editing might have removed some of the inaccuracies such as describing hemp (sisal) as “in the agave… or cactus, family”. The family name for agaves is Agavaceae which includes the genus Agave. In any event, agaves are biologically distinct to all members of the Cactaceae family; confusing agaves with cacti is an unexpected blunder.

The chosen towns quite rightly include some long-abandoned sites such as Teotihuacan, “City of the Gods”, which was once a city of 200,000 or so, the fascinating Mayan sites of Palenque and Chichen Itza, and Mitla and Monte Alban, both in Oaxaca.

The cover photo of the town of Chapala in Jalisco, much favored by American and Canadian retirees in recent years, unfortunately dates from a time when the lake level was relatively low. The green areas in the lake are floating masses of the introduced aquatic weed water hyacinth.

Despite being written by a Mexican historian, there are numerous minor historical inaccuracies in the text, though these should not detract from the enjoyment of the average reader.

For instance, in the Chapala entry, illustrated by the same photo used on the cover, it should be Septimus Crowe (not Crow), and the “navigation company with two small steam ships” had nothing to do with Christian Schjetnam. The steamships predated his arrival in Chapala by many years. Schjetnam did however, introduce two small sail yachts to the area, perhaps explaining the confusion. The description of President Díaz’s interest in Chapala appears to imply that he was first acquainted with the lake when he visited “a political crony” in 1904. Actually, Díaz was certainly personally familiar with Lake Chapala from long before this.

The entry for Santa Rosalia repeats the long-held but unproven idea that the main church was designed by Frenchman Gustave Eiffel (of Eiffel Tower fame). The town does have other Eiffel connections, and the church may indeed have been brought lock, stock and barrel from the 1889 Paris World Exhibition. However, research by Angela Gardner strongly suggests that the original designer was probably not Eiffel but was far more likely to have been Brazilian Bibiano Duclos, who graduated from the same Parisian academy as Eiffel. Gardner proved that Duclos took out a patent on prefabricated buildings, whereas she could find no evidence that Eiffel had ever designed a prefabricated building of any kind. Regardless of who designed it, it is certainly a unique design in the context of Mexico, and well worth seeing.

And really, surely this is the main point of this book. It was presumably never intended to be a reliable geographical (or historical) primer, but rather an enticing selection of seductive places, many of which will be unfamiliar to any but the most traveled reader. The variety of places included is breathtaking; few countries on earth can possibly match it. As such, One Hundred and One Beautiful Small Towns in Mexico is a resounding success.

This beautifully illustrated book should certainly tempt readers to venture into new parts of Mexico in search of these and other memorable places. Enjoy your travels!

– – – –

Mexico’s cities and towns are analyzed in chapters 21, 22 and 23 of Geo-Mexico: the geography and dynamics of modern Mexico. Buy your copy today!!

Jul 242010
 

According to the book One Hundred and One Beautiful Small Towns in Mexico, by Guillermo García Oropeza and Cristóbal García Sánchez (Rizzoli International Publications, 2008; 280 pp), these places all merit inclusion in the list of the 101 Beautiful Small Towns in Mexico.

Cover of 101 Beautiful Small Towns in MexicoWe will review the book more formally in a future post, since it offers some insights into Mexico’s geography, but for now take a look at the list below, and see if you agree.

Our own list of the most beautiful small towns would certainly include most of these, though we can think of some equally excellent choices which are not included.

Are there other towns that would be on your list? If so, let’s hear about them!

BAJA CALIFORNIA

  • San Felipe
  • Valle de Guadalupe

BAJA CALIFORNIA SUR

  • Loreto
  • Mulegé
  • San Ignacio
  • San Jóse del Cabo
  • Santa Rosalía
  • Todos Santos

CAMPECHE

  • Campeche
  • Edzná

CHIAPAS

  • Comitlán de Domínguez
  • Chiapa de Corzo
  • Palenque
  • San Cristóbal de las Casas
  • Yaxchilán
  • Bonampak
  • Zinacantán
  • San Juan Chamula

CHIHUAHUA

  • Batopilas
  • Creel
  • Hidalgo del Parral
  • Nuevas Casas [Nuevo Casaas Grandes]
  • Mata Ortíz
  • Cuarenta Casas

COAHUILA

  • Cuatro Ciénegas
  • Parras

COLIMA

  • Cómala

FEDERAL DISTRICT

  • Coyoacán

GUANAJUATO

  • Atotonilco
  • Dolores Hidalgo
  • Guanajuato
  • San Miguel De Allende
  • Yuriria

GUERRERO

  • Cacahuamilpa
  • Taxco

HIDALGO

  • El Chico
  • Huasca
  • Mineral del Monte [Real del Monte]
  • Tula

JALISCO

  • Chapala
  • Ajijic
  • Lagos de Moreno
  • Mazamitla
  • Puerto Vallaría
  • San Sebastián del Oeste
  • Tapalpa
  • Tequila
  • Tlaquepaque

MEXICO STATE

  • Malinalco
  • Teotihuacán
  • Acolman
  • Tepotzotlán
  • Valle De Bravo

MICHOACÁN

  • Angangueo
  • Cuitzeo
  • Paricutín
  • Angahuan
  • Santiago Nurío
  • Paracho
  • Pátzcuaro
  • Santa Clara del Cobre
  • Zirahuén
  • Tlalpujahua
  • Tzintzuntzan

MORELOS

  • Cuernavaca
  • Tepoztlán
  • Tétela del Volcán
  • Xochicalco
  • Yecapixtia

NAYARIT

  • Mexcaltitán

NUEVO LEÓN

  • Bustamante
  • Villa de García

OAXACA

  • Cuilapan
  • Arrasóla
  • Ixtlán De Juárez
  • Mitla
  • Monte Albán
  • Ocotlán
  • San Bartólo Coyotepec
  • Santa María del Tule
  • Tlacochahauya
  • Tlacolula
  • Dianzú
  • Yanhuitlán

PUEBLA

  • Cuetzalan
  • Cholula
  • Huejotzingo
  • Tonantzintia
  • San Francisco Acatepec

QUERÉTARO

  • Bernal
  • Jalpan

QUINTANA ROO

  • Bacalar
  • Cozumel
  • Holbox
  • Isla Mujeres
  • Playa del Carmen
  • Tulum

SAN LUIS POTOSÍ

  • Real de Catorce

SINALOA

  • Cósala

SONORA

  • Alamos
  • Magdalena de Kino

TLAXCALA

  • Tlaxcala

YUCATAN

  • Chichen Itza
  • Izamal
  • Uxmal
  • Valladolid

VERACRUZ

  • Coatepec
  • Los Tuxtlas
  • Papantia
  • Tlacotalpan

ZACATECAS

  • Guadalupe
  • Jerez
  • Sombrerete

Mexico’s cities and towns are analyzed in chapters 21, 22 and 23 of Geo-Mexico: the geography and dynamics of modern Mexico. Buy your copy today!!

The 10 states in Mexico receiving the most remittances in total

 Maps, Teaching ideas  Comments Off on The 10 states in Mexico receiving the most remittances in total
Jul 162010
 

The table shows the 10 states which receive the highest total remittances.

RankStateRemittances ($ millions), 2005
1Michoacán2,595
2Guanajuato1,715
3Jalisco1,693
4State of México1,675
5Puebla1,174
6Veracruz1,155
7Federal District1,452
8Oaxaca1,002
9Guerrero957
10Hidalgo718
States receiving the most remittances (highest value)

States receiving the most remittances (highest value). Click to enlarge. All rights reserved.

The data show very clearly that all the states receiving high total amounts of remittances are in the southern half of Mexico.

(a) What factors might explain this pattern?

(b) Compare this map with a map of the states with highest per person remittances. Why are some states only shown on one of the maps, and not on the other?

(c) Find a table showing the total population of each state in Mexico. To what extent do the total population figures for each state help to explain whether or not they are in the top 10 states for receiving remittances?

“Migration to the USA” is the title of chapter 26 of Geo-Mexico: the geography and dynamics of modern Mexico. This chapter provides a good introduction to the geography, history and impacts of migration and remittances. Buy your copy today!

Absolute distance, relative distance and the vagaries of air travel within Mexico

 Excerpts from Geo-Mexico  Comments Off on Absolute distance, relative distance and the vagaries of air travel within Mexico
Jul 152010
 

In an earlier post we looked at the importance of Mexico City airport in the national network of airports. In this post, we focus our attention more on the network, and much less on any individual airport.

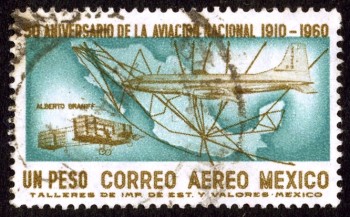
Alberto Braniff's biplane, modern jet and Mexico's airport network in 1960

Air travel greatly distorts the map of Mexico and the world. In terms of travel time on public transport, Mexico City’s airport is closer to Guadalajara, in the state of Jalisco, than to some areas in the Mexico City Metropolitan Area!

Similarly, Guadalajara is closer to Hong Hong by air—21 hours for the 13,000 km—than to some communities only 200 km away in northern Jalisco which require a trek of over 24 hours by bus, taxi and foot.

Business executives fly 2300 km from Tijuana to Mexico City, work for six hours in the city, and fly back the same day. Commuting to the same office takes longer for some Metro area residents who live only 50 km away, but have to contend with traffic congestion.

Air travel, coupled with  familiarity, significantly influences our perceptions of distance. A Guadalajara traveling executive perceives Mexico City as being closer to his home than slum areas within 20 km of his house. Downtown Mexico City seems much closer to a person who commutes there daily from 40 km away than to a neighbor who works locally and only goes downtown once a year.

Transportation systems greatly affect our perception of distance. Depending on connections, air travel is not always the quickest means of transport.

The straight line distance from Mazatlán to Durango is 245 km. The fastest air connection goes through Mexico City and involves flying over 1500 km. It takes seven hours, longer than the inter-city bus! A direct flight would take about 45 minutes. When an expressway connects the two cities, the drive will take less than three hours. Though the straight line distance between them is about the same as that between Querétero and Mexico City, the travel and perceived distance is far greater. This example demonstrates how existing transportation systems affect our perceptions of distance.

“Distance” can also be looked at in terms of costs. In Geo-Mexico, we look at the distinction between absolute distance measured in kilometers and relative distance in terms of cost. We include a graph plotting distance against the price of one-way economy-class direct flights from Mexico City to 28 cities for a random mid-week day in April 2009. The graph shows that there is very little connection between flying distance (or flight times) and ticket price (For statistically inclined readers, rs = 0.14).  Rather than discussing this further here, we suggest you consider purchasing a copy of the book for a more in-depth analysis!

This is an excerpt from chapter 17 of Geo-Mexico: the geography and dynamics of modern Mexico. which discusses transportation systems, including air travel and the national network of airports.

Mexico has 32 states, divided into 2,456 municipalities

 Excerpts from Geo-Mexico, Updates to Geo-Mexico  Comments Off on Mexico has 32 states, divided into 2,456 municipalities
Jul 102010
 

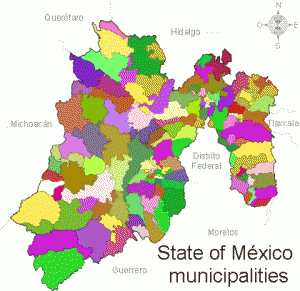
Mexico’s 32 states are divided into municipios (municipalities). There are 2456 municipalities which vary greatly in size and population. For example, the average population of Oaxaca’s 570 municipalities is about 6000 while the average population of Baja California’s five  municipalities is over 500,000. Each municipality elects a new president and local council every three years (except for Coahuila where four-year terms now apply).

State of Mexico municipalitiesMunicipal governments have taxing authority but rely very heavily on financial support from state and federal sources.

Municipalities are responsible for a variety of public services, including water and sewerage; street lighting and maintenance, trash collection and disposal, public safety and traffic, supervision of slaughterhouses, and maintenance of parks, gardens and cemeteries.

Municipalities are also free to assist state and federal governments in the provision of elementary education, emergency fire and medical services, environmental protection and the maintenance of historical landmarks.

Municipalities are therefore akin to  counties in the USA.

Here are a selection of other facts about Mexico’s municipalities:

  • The state with the most municipalities is Oaxaca:  570; at the other extreme, the states of Baja California and Baja California Sur each have only 5 municipalities.
  • Excluding the equivalent territorial divisions of the Federal District (known as delegaciones), the largest municipalities in terms of population are Ecatepec de Morelos (in Mexico State) and Guadalajara (Jalisco). Each is home to about 1.7 million people.
  • The least populated municipality is Santa Magdalena Jicotlán (Oaxaca) which has just 102 inhabitants.
  • Only about 450 municipalities have fewer men than women. The most male-dominated municipality is Aquiles Serdán (Chihuahua) which has 1.6 men for every woman.
  • The most female-dominated municipality is San Miguel Tulancingo (Oaxaca) with 1.5 women for every man.
  • The municipality of Tulum (Quintana Roo) is one of the youngest in the country; its first council was elected in 2009.
  • The most crowded municipality in terms of people per dwelling is San Simón Zahuatlán (Oaxaca):  9.1 persons per household. The national average is 4.2. The least crowded municipality is  Santiago Nejapilla (Oaxaca) where the average occupancy is 2.7 per home.
  • The largest municipality in area is Ensenada (Baja California), 53,304 square kilometers; the smallest used to be San Lorenzo Axocomanitla (Tlaxcala), 4.34 square kilometers, but is now Santa Cruz Amilpas (Oaxaca) which is only 1 square kilometer in area.

The 2010 census, carried out in June, will necessitate revising some of these numbers when the results are released in due course.

Many Mexican place names were changed following Mexican Independence (1821)

 Other  Comments Off on Many Mexican place names were changed following Mexican Independence (1821)
Jun 102010
 

This is the fourth and final part of our series of guest blogs by Fatimah Araneta.

Fatimah Araneta grew up in Mexico City. After gaining a Masters in City Planning at Berkeley, California, she opted to eschew city life and direct her energy and attention to living in tune with what’s left of Mother Earth before it all gets paved over and criss-crossed with cabled and non-cabled networks. She lives “off the grid” in the shadow of the volcano she prefers to call Chicnautécatl.

Part 4 – Many Mexican place names were changed following Mexican Independence (1821)

Finally, we come to what León-Portilla calls the fourth layer in a place name: the part applied during Mexico’s independent era. The purpose usually was to deliberately erase names that were too Castilian for the newly-born nation’s taste, as in the case of the state of Jalisco, which used to be Nueva Galicia, or Tamaulipas, which was formerly called Nuevo Santander. Both Jalisco and Tamaulipas are prehispanic names.

Sometimes the new place name was to honor a war hero. Today’s Ciudad Hidalgo used to be Tajimaroa; Ciudad Juárez’s old name was El Paso del Norte (today the city to the north of the border from Ciudad Juárez retains part of that name: El Paso, Texas).

And coming back to the domains of the Nevado/Xinantécatl/Chicnautécatl, there is a small city about an hour’s drive to the west of the volcano with a place name history of its own. Nine hundred years ago it was a densely populated area, the focus of pilgrimages and of commerce, a place where produce, goods, news and ceremonies were exchanged between the people of the altiplano (the higher, cooler plains) and those of tierra caliente (the warmer lowlands). The Nahuatl name for it was Temascaltepec, “Place of the Hot Vapor Baths”.

Valle de Bravo

Valle de Bravo. Photo: Fatimah Araneta. All rights reserved.

Since it was contained in an ample valley, the Spaniards began to call it Valle de Temascaltepec. During the war for independence, the hero Nicolás Bravo and his army passed nearby, on their way from Chilpancingo to what is the state of Morelos today. Admittedly, none of them actually spent not even a night in Valle de Temascaltepec, but the proximity of their famously brave passage was enough for the the town to decide one day to drop the Temascaltepec and change its name to Valle de Bravo[1].

In view of all this one can only conclude that there is a great deal in a name, especially in a place name in Mexico, and that to wholly or partially modify a place name is to risk losing an important part of the memory of its past.

This concludes our mini-series on Mexican place names.

Bibliography

GARCÍA MARTÍNEZ, Bernardo, Los Nombres del Nevado de Toluca, in Arqueología Mexicana, Vol.VIII, no.43, pp.24-26, May-June 2000.

LEÓN-PORTILLA, Miguel, Toponimia e Identidad, in Arqueología Mexicana, Vol.XVII, no.100, pp. 28-33, November-December 2009.

SIERRA CARRILLO, Dora, San Miguel Arcángel en los Rituales Agrícolas, in Arqueología Mexicana, Vol.XII, no.68, pp74-79, July-August 2004.


[1] The dropped name was quickly claimed by a neighboring town, Real de Abajo, “Lower Mine”. It is one of twin towns located in an area of silver and gold mines (reales, in Spanish). The other town is called Real de Arriba, and still conserves that name. Real de Abajo must have felt uncomfortable all its life with its lowlier designation and quickly adopted the more elegant Temascaltepec to make up for its previous existence in the shadow of the “Upper Mine”.


Click on the word “placenames” or the “placenames” tag for more articles about Mexico’s place names.

How big is Lake Chapala?

 Other  Comments Off on How big is Lake Chapala?
Jun 012010
 

“How big is Lake Chapala?”

There is no single answer to this question.  It all depends on the reference point in time.

The extent of the former Lake Jalisco (click image to enlarge map)

Some geologists suggest that 40,000 years ago, the Lake’s surface area was seven times its current size and its volume about 200 times greater.  At that time, the Lake towered almost 700 feet above what is now Guadalajara and stretched nearly to Aguascalientes (see map).  The decline of this massive ancient lake resulted from sedimentation, tectonic faulting and the cutting of a fantastic drainage gorge by the Rio Santiago  (see Jack Leyden’s “The geology and geography of Lake Chapala and western Mexico”, on MexConnect.com)

In recent history, the size of the Lake has continued to change dramatically.  In the 19th century, the Lake stretched almost 20 kilometers farther east.  Construction of an 80 kilometer dike and drainage system in 1908 attempted to capture a large portion of the lake for agricultural use.  Through a series of successive floods, partially attributed to the Poncitlán Dam on the Rio Santiago, the lake recaptured the land.  However, the dikes were re-constructed and the land eventually converted to permanent farmland, only occasionally disrupted by flooding.  Environmentalists argue that this has destroyed an important ecological role of this once important marshland.

The size of Lake Chapala has fluctuated significantly in recent decades; from extreme lows in 1954-56, 1992 and 2003 to highs in the 1960-70s and 2005-06.  These dramatic low to high changes can increase the Lake level by 8 meters, its volume by a whopping 800% and its surface area by 100%.   Fortunately, the Lake is at a relatively high level as we approach the 2010 rainy season.

Obviously, answering the question, “How big is Lake Chapala?” is very time sensitive.   In November 2009, Lake Chapala was about 75 by 25 kilometers with a surface area of 1150 square kilometers and a volume of 5.5 billion cubic meters (bcm).

Lake Chapala is sometimes called the largest lake in Mexico, but even this can be questioned.  It is the largest in terms of surface area. But with its shallow depth it is not the largest in terms of volume. The amount of water it holds, even when full to maximum capacity, is only 8.1 bcm.  It trails three reservoirs behind hydroelectric dams: La Angostura (10.7 bcm), Malpaso (9.6 bcm) and Infiernillo (9.3 bcm). But we must remember that the volume of all Mexico’s lakes and reservoirs varies enormously from season to season and year to year.

What about the future?  All lakes are destined to disappear because they all eventually fill completely with sediment.  In the not too distant geologic future, Lake Chapala will be gone.  Speaking of the future, geologic fault systems aligned with Lake Chapala, working with nearby fault systems, will eventually create a large Pacific island from a big chunk of western Mexico containing Puerto Vallarta and Manzanillo.

These topics are discussed in greater detail in previous Geo-Mexico.com posts:

Aguascalientes’ geopolitical romance and long road to Statehood

 Excerpts from Geo-Mexico  Comments Off on Aguascalientes’ geopolitical romance and long road to Statehood
May 312010
 

How did the State of Aguascalientes come to be so small, and sandwiched between much larger states?

Aguascalientes coat-of-arms

The area that is now the State of Aguascalientes was caught between the colonial jurisdictions of Jalisco and Zacatecas.  Prior to the Mexican Revolution it was considered part of Zacatecas, but after the War of Independence, in 1821 it gained status as its own political entity. This lasted only a few years. In 1824 it became part of the State of Zacatecas.

A decade later, in 1835, Zacatecas rebelled against the Federal Government.  General Santa Anna and his army squashed the rebellion, ransacked the City of Zacatecas and seized large quantities of the state’s silver. As payback for the rebellion, the Mexican Legislature separated the agriculturally-rich Aguascalientes Territory from the State of Zacatecas.

The more romantic version is that, “the independence of Aguascalientes was sealed with a kiss, as the locals are invariably quick to point out.”  (Tony Burton, Western Mexico: A Traveler’s Treasury). While quelling the Zacatecan rebels, General Santa Anna met the beautiful Doña María Luisa Villa, the wife of the Aguascalientes’ mayor. Santa Anna was very attracted to her and promised her anything for a kiss. He got the kiss and fulfilled her promise by making Aguascalientes an independent territory under the governorship of her husband, Pedro García Rojas. Hence, the lips on the state’s coat-of-arms!

Detail from Aguascalientes coat-of-arms (Note the lips!)

But Aguascalientes’ independence did not last long. In 1847, the national legislature revoked its independence and put it back into the State of Zacatecas. However, a few years later in 1853, Aguascalientes regained independent status. Finally, under the new Mexican Constitution of 1857, Aguascalientes became Mexico’s 24th state, with the colonial city of Aguascalientes as its capital.

Aguascalientes is a rather small state. Among Mexican states it ranks in the lower 20% in both areal size and population (about 1.2 million).  Most of the population (over 900,000) lives in the industrial Aguascalientes Metropolitan Area.  Locals claim that the Aguascalientes Nissan plant is the largest outside of Japan.

The evolution of Mexico’s political boundaries is discussed in chapter 9 of Geo-Mexico: the geography and dynamics of modern Mexico.

The origin of tequila

 Other  Comments Off on The origin of tequila
May 292010
 

Mexico’s favorite “tipple” has a long and fascinating history. Historians have debated for years precisely when the spirit was first distilled, and precisely where this took place.

“Mexico Exporta” – tequila

John Pint, writing in MexConnect, has written a great article about the area around the town of Tequila (Jalisco), the heartland of tequila production. He presents a strong case that the nearby town of Amatitan has a longer history of tequila making than Tequila, and explored the backcountry for the remains of what is reputed to be the first place where tequila was distilled by native people, finding ruins of early ovens which may predate the  Spanish conquest. The article includes a fine series of photos.

John Pint’s article on MexConnect.

Tequila gets several mentions in Geo-Mexico: the geography and dynamics of modern Mexico. Tequila volcano is included on the map of Mexico’s major volcanoes in chapter 2, while the importance of tequila (the spirit) and other “agricultural” exports is examined in chapter 20.

Related posts:

Western Mexico, Mexico’s Catholic heartland

 Excerpts from Geo-Mexico  Comments Off on Western Mexico, Mexico’s Catholic heartland
May 202010
 

As mentioned in an earlier post, Mexico is a predominately Catholic country. In 1980, 96% of Mexicans said they were Catholics; this dropped to 88% in 2000 and is estimated at about 80% in 2010. However, Catholicism seems to be maintaining its strength in Western Mexico.

Tzintzuntzan monastery and church. Artist: Mark Eager. All rights reserved.

In 2000, 96% of those in Guanajuato and Aguascalientes professed to be Catholic, followed closely by Jalisco, Querétaro, Zacatecas and Michoacán with 95%. Colima (93%) and Nayarit (92%) were not far behind.

The 1917 Constitution which followed the Mexican Revolution placed severe restrictions on the Catholic Church. It forbade churches from participating in primary and secondary education, it denied legal standing to religious marriages, and denied the right of church personnel to criticize the government or wear religious attire in public. These laws began to be rigorously enforced in 1926, stimulating the Cristero Rebellion by 50,000 armed devout Catholics in Western Mexico. This three year war cost 80,000 lives and reduced the number of priests in Mexico from 4,500 to only 334. Many Catholic leaders and followers immigrated to the USA.

Gradually, the severe restrictions were virtually all rescinded. In 1992 the government re-established diplomatic relations with the Vatican after over a century of estrangement. The last two Presidents of Mexico have come from the pro-Catholic PAN political party.

The geography of Mexico’s religions is discussed in chapter 11 of Geo-Mexico: the geography and dynamics of modern Mexico.

The 10 states of Mexico which have the longest coastline

 Other, Teaching ideas  Comments Off on The 10 states of Mexico which have the longest coastline
May 132010
 

Here are the ten states of Mexico which have the longest coastlines. Note that these figures are those published by the National Statistics and Geography Information Institute (INEGI). We discussed the impossibility of ever measuring a coastline accurately in a previous post:

How long is Mexico’s coastline?

RankStateLength of coast (km)
1Baja California Sur2,131
2Baja California1,493
3Sonora1,209
4Quintana Roo1,176
5Veracruz720
6Sinaloa622
7Oaxaca568
8Guerrero522
9Tamaulipas433
10Campeche425

Only seven other states have a marine coast. They are Jalisco, Yucatán, Nayarit, Chiapas, Michoacán, Tabasco and Colima.

The remaining 15 states (counting the Federal District as a state) are land-locked.

Q. What are the likely impacts on economic activity of either (a) having a coastline or (b) being landlocked?

The importance of Mexico City’s International Airport

 Excerpts from Geo-Mexico, Updates to Geo-Mexico  Comments Off on The importance of Mexico City’s International Airport
Apr 132010
 

Mexico City’s Benito Juárez international Airport handled 26.2 million passenger movements last year, making it the world’s 43rd busiest terminal, according to the Airports Council International. In terms of flights, Mexico City airport was the world’s 30th busiest, with 366,000 take-offs and landings. For freight, it was the 48th largest in the world, with 376,000 tons of cargo going through it last year. The Airports Council International is a non-profit organization which serves as the “voice of the world’s airports”.

The numbers make Mexico City airport the most important in Latin America. The on-going modernization of Terminal 1 will expand the airport’s capacity to 32 million passenger movements a year. The airport has parking spaces for 6,514 vehicles, and is served by a metro line, city bus lines, and 1,485 licensed taxis (belonging to 7 different companies). The terminal is also served by 8 mid-distance bus lines, offering regular service to the cities of Córdoba, Cuernavaca, Pachuca, Puebla, Querétaro, Tlaxcala and Toluca.

Nationwide, of the roughly 50 million air passengers each year, about half are domestic and half international. Commercial air service started in Mexico in the 1920s. The main route was Mexico City–Tuxpan–Tampico–Brownsville, Texas. By the 1930s, flights were available to Los Angeles, Cuba, Guatemala and El Salvador. Jet services to USA and European cities started in the 1960s. The routes have expanded steadily and now connect Mexico’s 29 national and 57 international airports.

Mexico City’s airport accounts for about 35% of the national total number of passenger movements, followed by Cancún (10.5%),  Guadalajara (almost 9%), Monterrey (7.4%), Tijuana (5.3%) and Puerto Vallarta (Jalisco) and San José del Cabo (Baja California Sur) each with 3.6%.

International comparisons

Mexico averages about 370 air passenger movements per year per 1000 population, compared to 2430 for the USA, 1400 for Canada, 202 for Brazil and 179 for Argentina. While air travel is growing, it remains a distant third behind automobile and bus travel.

Mexico’s transportation systems, including airports, are discussed in chapter 17 of Geo-Mexico: the geography and dynamics of modern Mexico.

The 10 largest states in Mexico in terms of population

 Other, Teaching ideas  Comments Off on The 10 largest states in Mexico in terms of population
Apr 062010
 

This table shows the ten states in Mexico which have the largest populations. The total population was 112,322,757 in 2010, according to the preliminary results of the 2010 census. These figures may change slightly when the final results of the census are made available.

RankStatePopulation (2010 census)
1State of México15,174,272
2Federal District8,873,017
3Veracruz7,638,378
4Jalisco7,350,355
5Puebla5,779,007
6Guanajuato5,485,971
7Chiapas4,793,406
8Nuevo León4,643,321
9Michoacán4,348,485
10Oaxaca3,801,871

Q. Find these ten states on a map of Mexico [printable map of Mexico in pdf format]. Do the states with the most people also have the largest land areas?