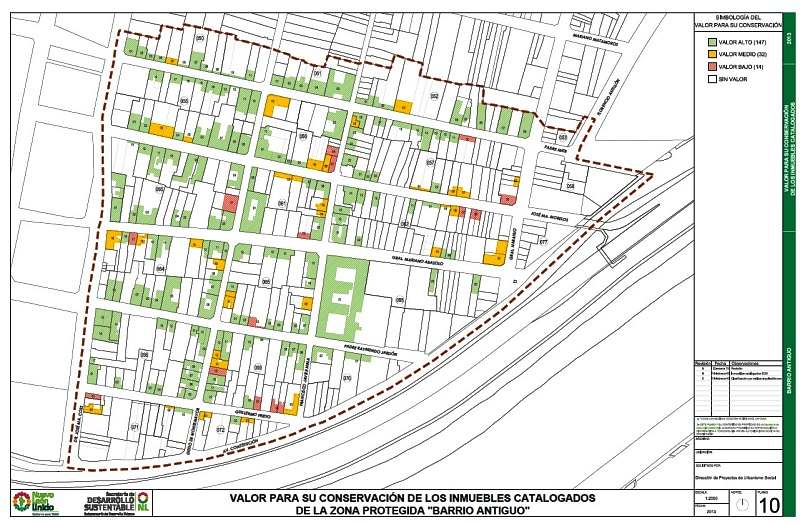
A series of historical maps of the city of Monterrey was published earlier this year in the city’s online Catalog of Buildings of Historic and Artistic Importance in Barro Antiguo, The maps, dated 1765, 1791, 1846, 1865, 1922, 1933 and 1947 respectively, offer a good basis for considering the urban growth of Monterrey, the industrial powerhouse of northern Mexico.
In chapter 22 of Geo-Mexico, the geography and dynamics of modern Mexico, we explained why, “Monterrey does not fit the general Latin American urban model as well as Mexico City or Guadalajara. First, it never really existed as a colonial city. Secondly, its development was more heavily dependent on industry. Thirdly, its relative wealth and progressive leadership in some ways make it more similar to a North American city than a Latin American city. It fits the model only in that it developed a definite high status sector in contrast to lower status industrial sectors, and eventually became spatially fragmented.”
But just how did Monterrey develop as a city? In each of the following historical maps of Monterrey, Barrio Antiguo (16 blocks in size in the present-day city) is marked by a red quarter-circle, which is an easy way to check each map’s orientation and scale. Monterrey was founded in 1596. The earliest map in our series, for 1765, shows that, even by that date, Monterrey was still a relatively small settlement situated between a (seasonally dry) “stream formed by various springs” (to the top of the map, north) and the seasonally-dry “Monterrey River” (now called the Santa Catarina River). The Barrio Antiguo is shown as mostly an empty area, with only one major construction.
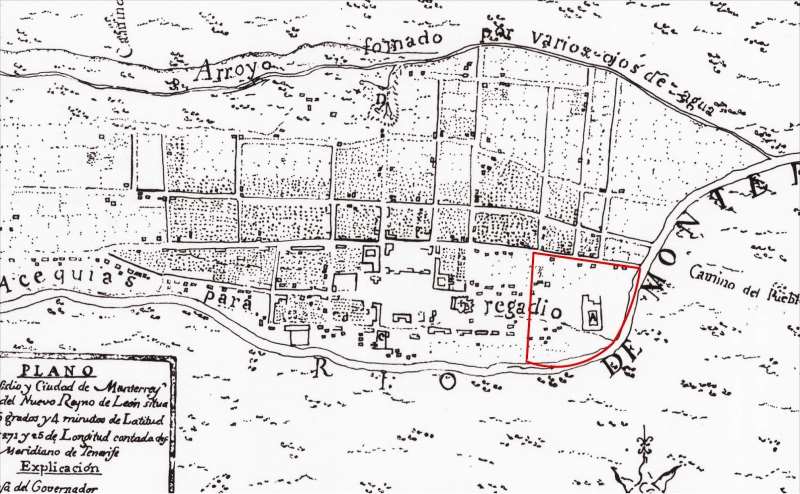
Monterrey 1765
Very little has changed by 1791 (see map below: note that this map is oriented south-upwards), though the Barrio Antiguo has now been developed, and is shows as having several streets in a clear grid pattern:
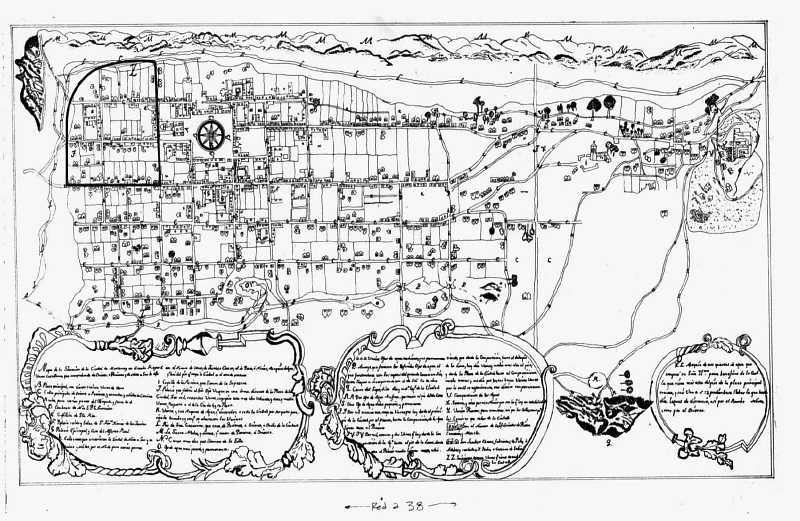
Monterrey in 1791
The grid pattern for Barrio Antiguo is equally evident in the details of the map in 1846:
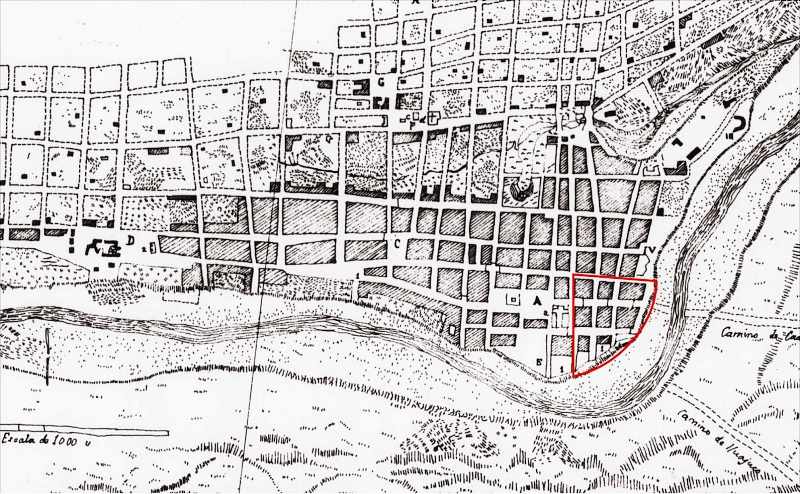
Monterrey in 1846
As of 1846, no development is shown on the south bank of the Santa Catarina River, though tracks are shown heading east and south-east respectively from the city. The next map, for 1865, shows that the city is beginning to expand to the south. A substantial settlement is developing on the south bank, more of less opposite the Barrio Antiguo. Note, though, that this map shows only part of the city:
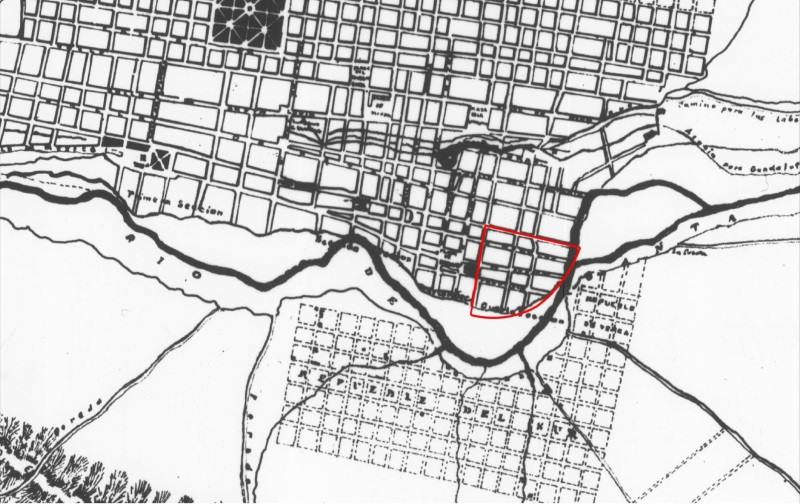
Monterrey in 1865
Clearly, Monterrey only emerged as a real city after the colonial period which ended in 1821. The relatively small city did not experience real growth until late in the 19th century when it became connected by railroad and started to attract industrial development.
Early in the 20th century, investors built the then largest iron and steel works in Latin America a few kilometers east of the city center. Many related industries located nearby. These industries and the railroad, which ran east–west about four kilometers (2.5 mi) north of the city center, stimulated early industrial development in these directions. Developers established low income housing tracts for industrial and other workers on the east, north and west periphery of the city. Neighborhoods for the wealthier classes were developed south of the city center.
By 1933, Monterrey has grown significantly in area, especially towards the north:
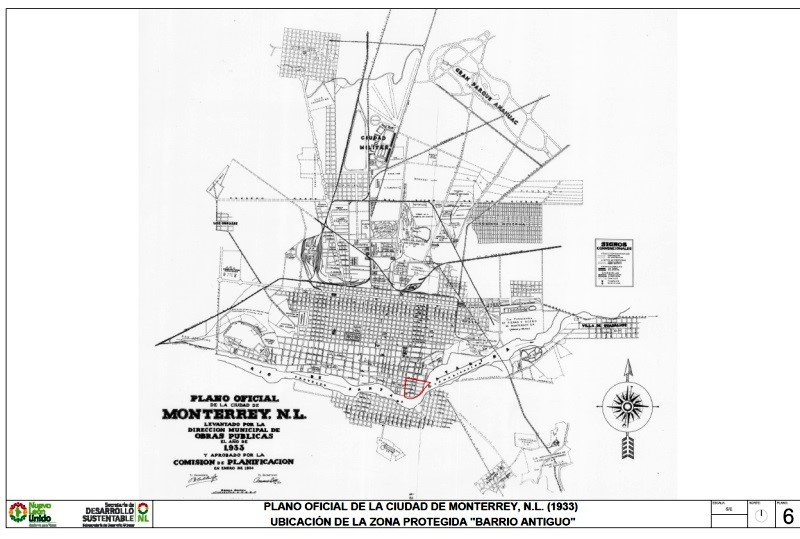
The city of Monterrey in 1933
Between 1933 and 1947, the city continues to expand, with many areas being infilled with residences:
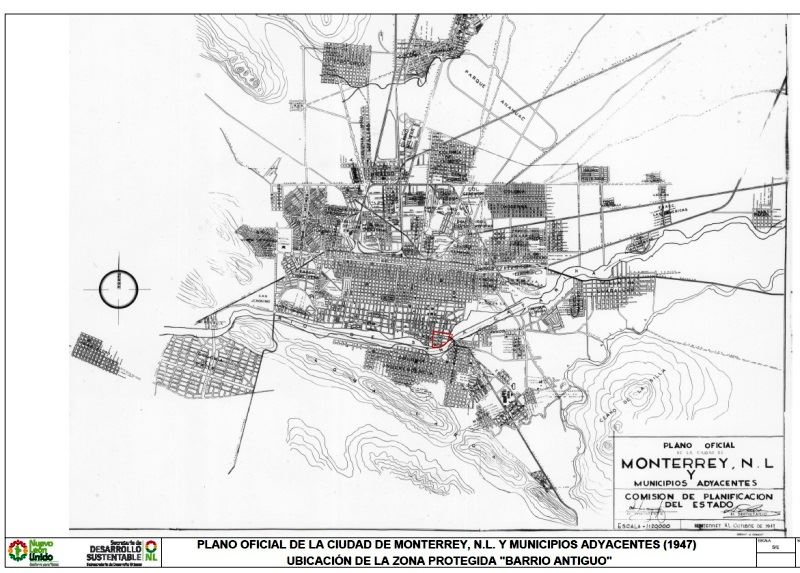
The city of Monterrey in 1947
The city experienced another surge of industrialization and immigration in the 1950s and 1960s. Industrial development continued after 1970 when the national government implemented policies to shift development away from Mexico City. Monterrey became a major producer of steel, metal fabrication, cement, beverages, petrochemicals, food, telecommunications, auto parts, glass, and house furnishings. It also developed into a major financial center and one of the wealthiest and most progressive cities in the country.
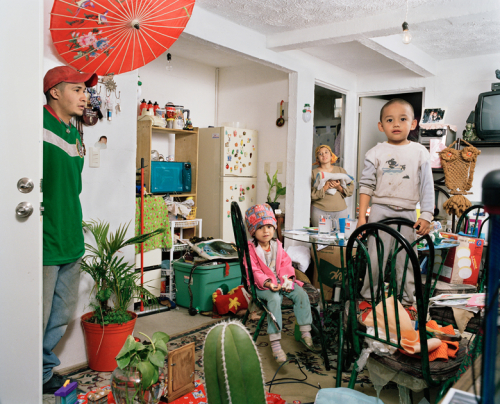
Low income housing became a serious problem after the 1960s as the inner city tenements became extremely crowded. The government was not sympathetic to irregular housing schemes, so low income groups established numerous illegal squatter settlements on vacant land near the industrial zone. Government made a few efforts to remove these, but most survived and eventually became regularized.
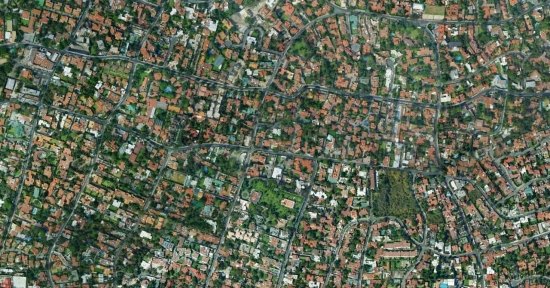
The high status sector expanded south-west into San Pedro Garza García, which became one of the wealthiest municipalities in Mexico. The high overall income and wages in the city meant that many workers could afford home ownership and private automobiles. As a result, many gated communities (large and small) and suburban shopping malls were built around the urban periphery. The urban area became relatively fragmented with many low income residential zones located near high income areas.
Source of the maps used in this post:
Other posts about the urban geography of Mexico’s cities:
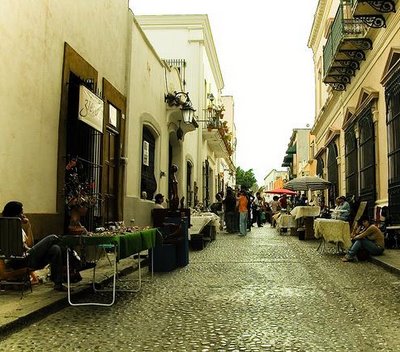
- The urban regeneration of Barrio Antiguo in Monterrey
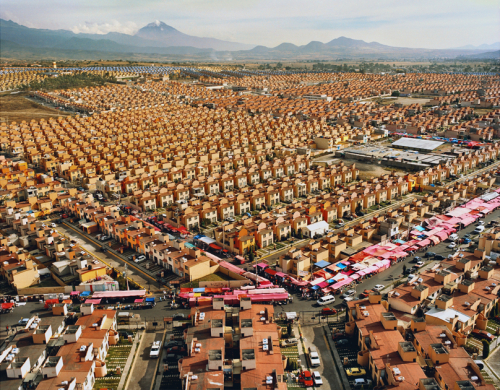
- Suburbia in Mexico: Alejandro Cartagena’s images of Monterrey
- Mexico’s changing urban landscape: the rapid rise of low-income subdivisions
- Santa Fe, a case study of a real estate development on Mexico City’s periphery
- A case study of low-income housing on the urban periphery
- Vecindades, Mexico City’s inner-city slums
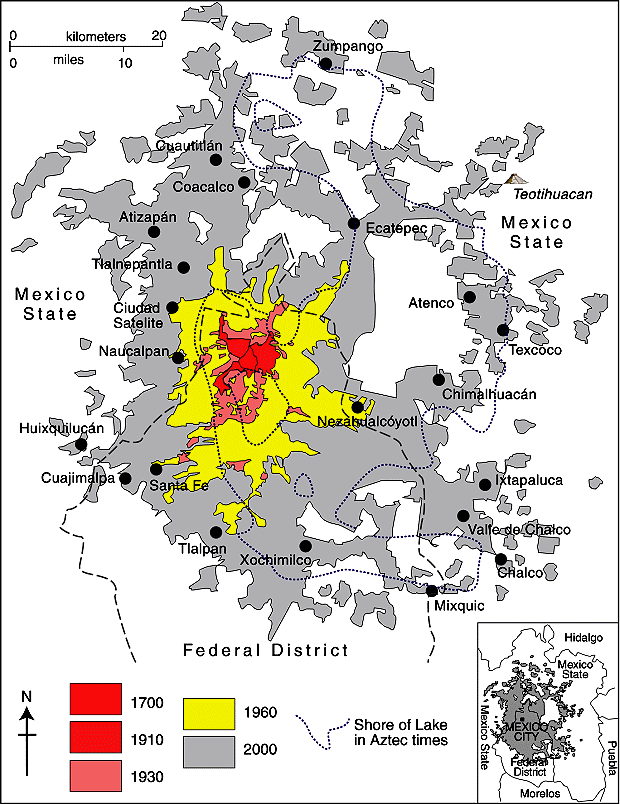
- Nezahualcoyotl, an irregular settlement which grew into a monster
- Informal settlements or “colonias populares” in Mexico’s cities


