Los ninis are young people (aged 15-29) that “ni trabaja, ni estudia” (neither work nor study). They have become the focus of much press attention in the past few years, often accompanied by the phrase “Mexico’s lost generation”.
According to a recent OECD report, “Education at Glance 2015”, two out of every ten Mexicans in the 15-29 age group neither studied nor worked in 2013, the latest year for which there is data. The report found that 22.3% of Mexican in that age category were ninis, a slight decrease compared to 25.0% in 2011. After population increase is taken into account, Mexico has about 200,000 fewer ninis than in 2011.
Mexico’s percentage of ninis is above the average for all 34 OECD member countries, and is the fifth highest among OECD members, after Turkey (31.3%), Greece (28.5 %), Spain (26.8 %) and Italy (26.1 %). Very few of Mexico’s 7.3 million ninis (only 3.8%) are technically “unemployed”; most ninis have not actively sought work and are therefore considered “inactive”.
In Mexico, most ninis are female. For example, in the 20-24 age group, around 10% of males are ninis, compared to 40% of females.
The figure of 7.3 million will no doubt again be disputed by Mexico’s Secretariats of Education (SE) and of Labor and Social Welfare. In 2011, the Secretariats issued a joint rebuttal of the OECD figure, and claimed that 78% of those reported by OECD as ninis were young married women, with children, who dedicated themselves to home-making. The Secretariats emphasized that the figures revealed a gender inequality in access to educational and economic opportunities, linked to cultural patterns where many young women still saw marriage and motherhood as their preferred or only option.
The table shows the number of tourists (national and international) visiting Cancún, Quintana Roo, Mexico, 2000-2013.
Cancún by Arthur Gonoretzky (Flickr)
From 2000 until 2011, tourist numbers fluctuated between 2.8 and 3.3 million. Since 2011, tourist numbers have risen sharply, to 3.6 million in 2012, 4.1 million in 2013 and a preliminary estimate of 4.3 million for 2014.
Year
Number of tourists
Year
Number of tourists
2000
3 043 000
2008
3 265 591
2001
2 986 000
2009
2 878 811
2002
2 826 000
2010
3 015 690
2003
n/a
2011
3 115 177
2004
n/a
2012
3 642 449
2005
3 072 000
2013
4 093 942
2006
n/a
2014
4 300 000 (estimate)
2007
3 004 802
2015
?
Cancún currently has more than 3000 condominium units and more than 35,000 hotel rooms. According to the first draft of the Programa de Desarrollo Urbano del Centro de Población Cancún 2014-2030, the city could have as many as 46,000 hotel rooms by 2030.
This projection is well below the earlier estimate, made in 2013, of 64,000 rooms by 2030, but the new figure is claimed to be more in line with planned improvements to local water supply. The development of Cancún has often been criticized for paying insufficient attention to considerations of urban density, water supply and environmental impacts.
Geologists have discovered that some strange things are happening off the southern coast of the Baja California Peninsula.
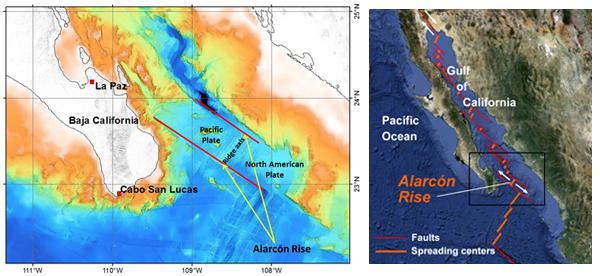
In essence, while most of Mexico rests on the North American plate, the Baja California Peninsula is on the gigantic Pacific plate. The Pacific plate is moving slowly northwest and the pressures in the zone where these two plates intersect, under the Sea of Cortés (Gulf of California), has caused a complex series of parallel faults which (further north) link to the California’s San Andreas Fault system. Thus, the Sea of Cortés is an area of heavy seismic activity.
Location of the Alarcón Rise. Credit: (c) 2012 MBARI
The Alarcón Rise (see map) is a 50km (30 mi) long “bump” under the Sea of Cortés. New seafloor is being continuously created along the Alarcón Rise as undersea magma rises to the surface and cools to become lava. As the plates continue to move, this lave is then carried away to either side of the Alarcón Rise, allowing fresh lava to take its place, and so on. The rate of sea-floor spreading here is a relatively slow 5 cm (2 in) a year.
The Alarcón Rise has been studied in considerable detail by geologists attached to the Monterey Bay Aquarium Research Institute (MBARI) in California. Using a sonar-mapping robot, they discovered new deep-sea hydrothermal vents.
In most zones of sea-floor spreading, the lavas are relatively low in silica and therefore free-flowing. Such lavas are known, on account of their chemistry, as “basic” lavas. (Lavas higher in silica, known collectively as acid lavas, tend to be more viscous and flow less easily. Acid lava volcanoes tend to erupt far more explosively than basic lava volcanoes.)
The curiosity of the Alarcón Rise is that while the vast majority of lava flows along the ridge are basic (basalt) lavas, those associated with at least one volcano are clearly acidic, not basic.
Researchers used a remote-control vehicle to collect samples and explore the volcano, which is 2375 m (7800 ft) below the surface. Samples of the lava show that it is primarily rhyolite with some dacite, with a silica content of up to 77%, the highest of any rock ever found along a mid-ocean ridge, according to Brian Dreyer, a geochemist at the University of California, Santa Cruz. The volcano with acid lava forms a small dome, about 50 meters (165 ft) in height and covers an area of about 1200 meters by 500 meters (4000 feet by 1640 feet). The dome is probably several thousand years old.
The lavas solidified quickly to form angular chunky blocks, some of which then rolled down the sides of the rise to form talus (scree). The individual blocks can be as large as cars or small houses.
The findings suggest that this particular volcano could give rise to hazardous eruptions. It is only 100 km (60 mi) from land and very close to the major tourist areas fringing the coast of Baja California Sur. Any major explosive eruption from this volcano could also cause a tsunami with the potential to devastate settlements on both coasts of the Sea of Cortés (Gulf of California).
Geologists are still working on trying to fully explain this apparent anomaly in lava composition. They have already discarded several ideas, and their current hypothesis is that the magma source was at some point contaminated by seawater, resulting in an unusually high concentration of volatiles such as water, sulfur and chlorine.
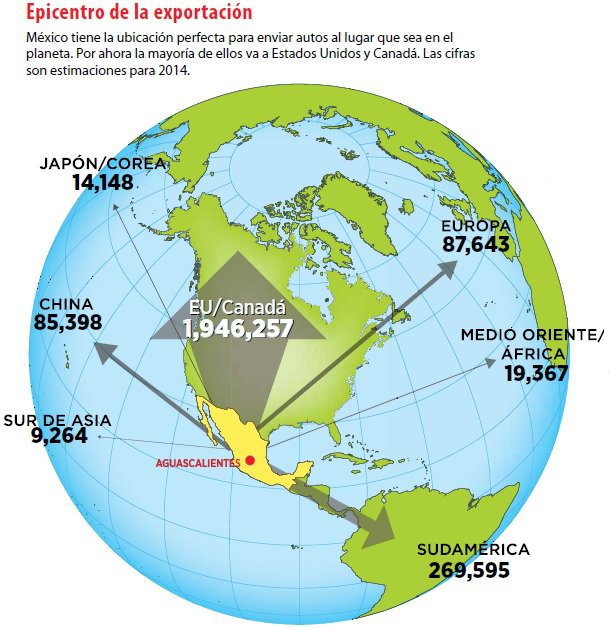
Mexico is one of the world’s “Top Ten” countries for vehicle production and for vehicle exports. In 2014, it has overtaken Brazil to become the world’s 7th largest vehicle producer and fourth largest exporter. 80% of Mexico’s production of around 3.3 million vehicles in 2014 were made for export. The trade surplus generated by the automotive sector exceeded 47 billion dollars in 2014.
Mexico’s vehicle exports in 2014. Credit: Forbes, México.
The industry attracts large amounts of Foreign Direct Investment (FDI). Vehicle assembly plants provide around 65,000 jobs, with a further 85,000 employed in distributorships nationwide and a whopping 450,000 employed in the autoparts sector.
The autoparts sector along produces items worth $80 billion/year, but Mexico also has to import components made elsewhere worth a further $35 billion. Clearly, this offers some opportunities for additional investment aimed at import substitution. Most of the opportunities are likely to be for Tier 2 companies. It is customary to divide the autoparts sector into three distinct parts: OEM, Tier 1 and Tier 2. OEM (Original equipment manufacturer) refers to companies that make a final product for the consumer marketplace (eg Volkswagen). Tier 1 companies are direct suppliers of components to OEMs, and Tier 2 companies are the key suppliers of parts or raw materials to Tier 1 suppliers.
Total production in 2014 topped the 3 million barrier, and the Mexican Automotive Industry Association (AMIA) believes production could reach 4 million units by 2015 and 5 million by 2020.According to AMIA, the best selling models on the domestic market are the Aveo (GM), Jetta (VW), Versa and Tsuru (both Nissan).
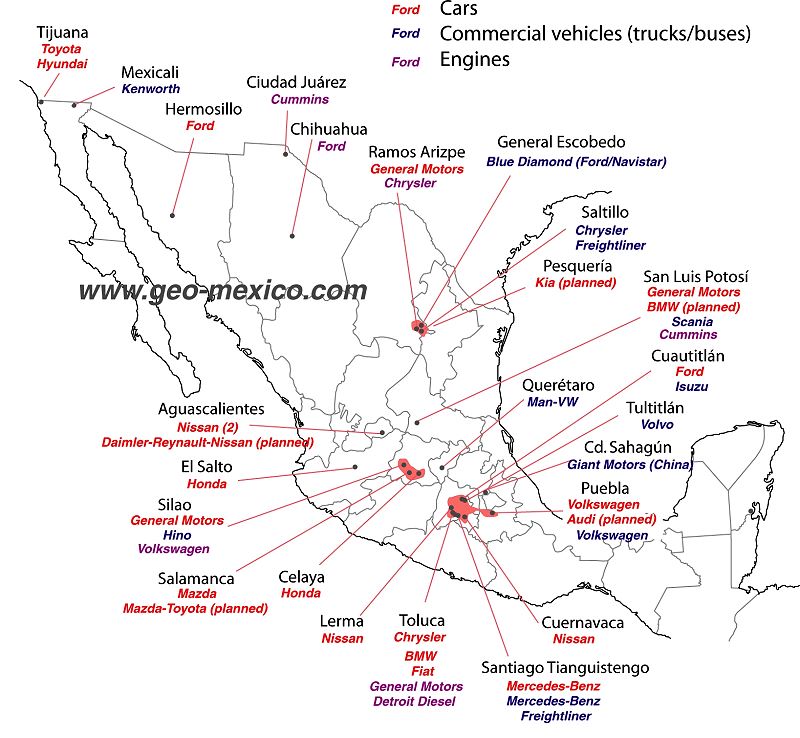
There are about 30 vehicle assembly plants in Mexico, manufacturing many brands of cars and trucks (see map). In addition, there are 1200 firms specializing in making parts for vehicles.
Vehicle manufacturing firms that have announced or confirmed major new investments during 2014 include:
Chrysler – 1.25 billion dollars to expand its assembly plant in Saltillo and manufacture a new line of Tigershark engines.
Nissan – to open its second plant in Aguascalientes.
Mazda – an additional 120 million dollars for its plant in Salamanca (Guanajuato), where it will manufacture several Mazda models as well as one Toyota model.
GM – investments worth 690 million dollars, divided between its plants in Silao (Guanajuato), San Luis Potosí and Toluca (State of México).
Audi – about to open a 1.3-billion-dollar plant in San Jose Chiapa, near Puebla.
VW – 700 million dollars investment to adapt production lines in Puebla to produce its redesigned Golf hatchback.
Kia – plans to build a $1 billion vehicle assembly plant at Pesquería in the state of Nuevo Leon (scheduled to open in 2016) to produce up to 300,000 vehicles a year. The new plant is expected to generate a further 1.5 billion dollars in investment from firms seeking to join Kia’s supply chain.
Vehicle assembly plants in Mexico, 2014. Credit: Tony Burton/Geo-Mexico; all rights reserved.
As the map shows, certain areas of Mexico have attracted more investment in vehicle assembly plants than other areas. The two largest existing concentrations are focused on Toluca in the State of México, and on Saltillo-Ramos Arizpe in northern Mexico. However, the fastest growing cluster is in the central state of Guanajuato.
Virtual visit to the Chrysler plant in Saltillo (video, no commentary):
Preventing, diagnosing and treating dengue fever is a major public health issue in many parts of the world, including central America and Mexico. The disease is transmitted by mosquitoes. Infected patients develop a sudden high fever, usually accompanied by generalized body pain and a skin rash. The pain can be very severe, hence the disease’s common name of breakbone fever.
Several species of mosquito can transmit dengue, but female Aedes aegypti mosquitoes are the main transmitter of dengue in Mexico. These mosquitoes bite during the day, mostly in the period two hours either side of dawn and dusk. The mosquito bites an infected person and ingests blood with the dengue virus, which incubates in the mosquito for a period of 8 to 12 days. After that the mosquito can begin to transmit the virus by biting other people. From 5-7 days later any newly infected person is likely to have symptoms.
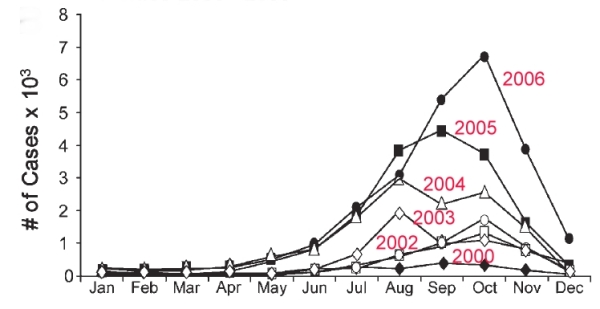
The graph below shows the monthly number of dengue cases in Mexico from 2000 to 2006. It is clear that most cases are reported between July and November, with very few cases occurring between December and May. This can be explained by Mexico’s climate. Almost of all of Mexico receives most of its rainfall between June and October. The mosquitoes that spread dengue need stagnant water to breed. There are far more small pools of water available for mosquito breeding in and immediately after the annual rainy season. Eliminating potential locations where water can collect and stagnate is an important element of dengue prevention programs.
Monthly incidence of dengue cases in Mexico, 2000-2006. Source: San Martín, Brathwaite et al (2014).
The graph also shows that the number of cases of dengue was increasing rapidly between 2000 and 2006. Indeed, numbers continued to rise until 2013 when more than 50,000 cases were reported for the year (an average of more than 4000/month). At first sight, this suggests that dengue prevention programs have not been very successful, but in fact the rise echoes what was happening worldwide. One possible, at least partial, explanation may be that changes in climate have allowed dengue mosquitoes to thrive in environments where they were previously scarce. People in such areas are unprepared for dengue; they may not have instituted prevention programs, and may have been slow to receive correct diagnosis. The migration of people affected by dengue from one region to another may also have helped the disease spread, provided there were host mosquitoes in the destination region.
The good news is that the number of dengue cases in Mexico in 2014 has fallen from its 2013 level by about 50%, so the dengue epidemic may finally be on the wane. As of 24 November 2014, 28,109 cases had been reported for the year, an average nationwide rate of 23.47 cases/100,000 people. Dengue is fatal in a relatively small number of cases, with 33 deaths reported in Mexico so far this year..
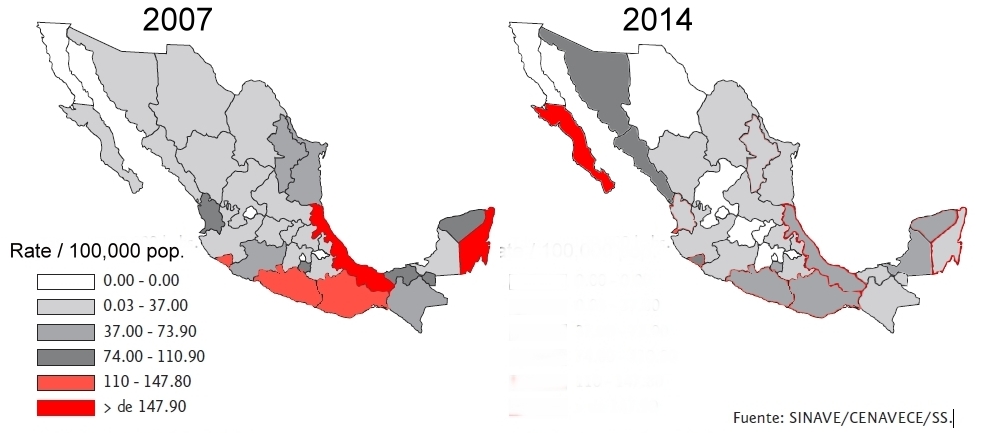
The total number of cases may finally be on the decline, but the figures for 2014, when looked at state by state, suggest that the spatial pattern of dengue cases in Mexico is changing. The two maps below compare the rate of cases per 100,000 people on a state-by-state basis for 2007 and 2014. (The color-coded key is identical for both maps).
Rates of dengue by state, 2007 and 2014. Rates are cases / 100,000 population
In 2007, the highest rates of dengue were found in the states of Veracruz and Quintana Roo, with Oaxaca, Guerrero and Colima comprising the next category. (Those five states are the ones colored red on the 2007 map). At the other extreme, no cases were recorded in 2007 in the state of Baja California, or in several tiny states including Aguascalientes.
The pattern shown on the 2014 map is quite different. In general, rates of dengue at the state level have not increased in Mexico, but decreased. However, there is a clear shift in emphasis towards the north-west, where several states had much higher rates in 2014 than in 2007. The extreme example is Baja California Sur, where the rate for 2014 (up to 24 November) was a whopping 549.9 cases / 100,000 people, more than five times the rate registered in any other state. Equally apparent is the belt of low-rate states (from Chihuahua to the State of México) down the center of the country from the U.S. border to Mexico City. These states are at relatively high elevation where fewer mosquitoes are found.
The states of Baja California Sur, Veracruz, Sinaloa, Sonora and Guerrero account for 55% of the 28,109 confirmed cases of dengue fever reported in Mexico as of 24 November 2014.
Mexico’s Health Secretariat publishes maps of each state showing which municipalities have reported cases of dengue. These maps are updated weekly. The link is to a pdf document with maps for 2014 up to 24 November.
There is some good news. In 2015, Mexico will be the first nation in the world to get a new dengue vaccine, developed by French company Sanofi Pasteur. The company hopes to have manufactured more than 40 million doses by the first half of 2015, and has decided to introduce it first in Mexico, with the first vaccinations likely to be offered to the public late next year or early in 2016. In trials, the vaccine proved 60.8% efficient in preventing the disease.
Reference for graph:
José Luis San Martín, J.L., Brathwaite, O., Zambrano B, et al (2014): “The Epidemiology of Dengue in the Americas Over the Last Three Decades: A Worrisome Reality”; Am. J. Trop. Med. Hyg., 82(1), 2010, pp. 128–135
For the fourth year running, Mexico was the world’s leading beer exporter in 2013, with beer exports reaching a record 2.2 billion dollars, a rise of 4.2% compared to 2012, and well ahead of both the Netherlands ($2.0 billion) and Belgium ($1.6 billion).
Mexico has become the leading supplier of beer to the USA and now accounts for almost 50% of that country’s beer imports. It is also the leading supplier to Australia, Chile, Guatemala, Argentina and New Zealand, as well as the third leading supplier to Canada and the fourth largest to China and Japan.
The two major beer producers in Mexico are Grupo Modelo and Cervecería Cuauhtémoc Moctezuma.
The leading export brand is Corona which reaches 180 countries around the world. Over the past decade, Mexico’s beer industry has grown at 2.5%/year and analysts expect this rate to quicken, predicting output will rise from 71 million hectoliters this year to 82 million in 2020.
In the USA, quite a few Mexican beers will be consumed this Thanksgiving Day… Happy Thanksgiving to all!
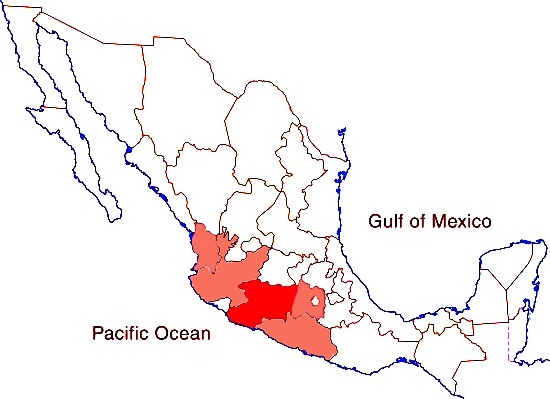
Mexico is the world’s largest producer and exporter of avocados. The avocado harvest for the 2013/14 season was close to 1.5 million metric tons, a new record. More than 90% of Mexico’s avocados are grown in the state of Michoacán, where 12% of all agricultural land is currently under avocado orchards.
Avocado-growing states
Mexico produces about 1.5 million metric tons of avocados a year, on 170,000 hectares in 27 states. The principal producing states are Michoacán 1.2 million tons, Jalisco 87,000; State of México 56,000; Nayarit 34,000; Morelos 27,000; Guerrero 14,000.
Avocado exports have risen sharply and, in the first half of 2014, totaled 353,000 metric tons, worth 800 million dollars, 29% higher than for the same period a year earlier. The most important markets for Mexican avocados are the U.S., Japan, Canada, Central America and Europe, but demand for avocados in Asia, especially China, is rising very quickly. Exports to China rose 724% for the period to 1,260 metric tons, worth 3 million dollars.
Exports to the USA of avocados were worth 651 million dollars, 31% higher than a year ago; exports to Japan reached 62 million dollars, up 29%; and to Canada 41 million dollars, up 33%.
Updates to Geo-MexicoComments Off on Mexico’s annual GDP/person now stands at $16,463
Sep292014
Recent World Bank figures reveal that Mexico’s GDP/person in 2013 reached $16,463 a year, an increase in GDP/person of 1.8% since 2012. (All figures in US dollars). Mexico’s 2013 GDP/capita is well above the Latin America and Caribbean average of $14,978.
The GDP figures are based on purchasing power parity (PPP) which overcomes gross distortions resulting from differences in exchange rates. For example, a haircut of the exact same quality might cost $15 in the USA, $5 in Mexico and $1 in China. Using the PPP approach, this same haircut would count as a $15 contribution to the GDP of each of the three countries.
Mexico’s GDP/person has grown at an average rate of 4.5%/year since 1991, according to the World Bank. Back in 1991, the GDP/person averaged $6,320.
Mexico’s GDP/person has risen quite sharply since 2008, when the comparable figure was $14,810, though its world rank (#80) is essentially unchanged. The figures suggest that economic growth has outstripped population growth over the past five years, making Mexicans better off (on average), and able to afford more goods and services, now than they were then.
Since 1991, Mexico’s GDP/person has declined in only three years:
1994-1995 – decline of 10% due to world economic crisis
2000-2001 – decline of 0.2%
2008-2009 – decline of 2.2% due to world economic crisis
These figures suggest that Mexico’s economy has become more resilient when there is any slump in global markets.
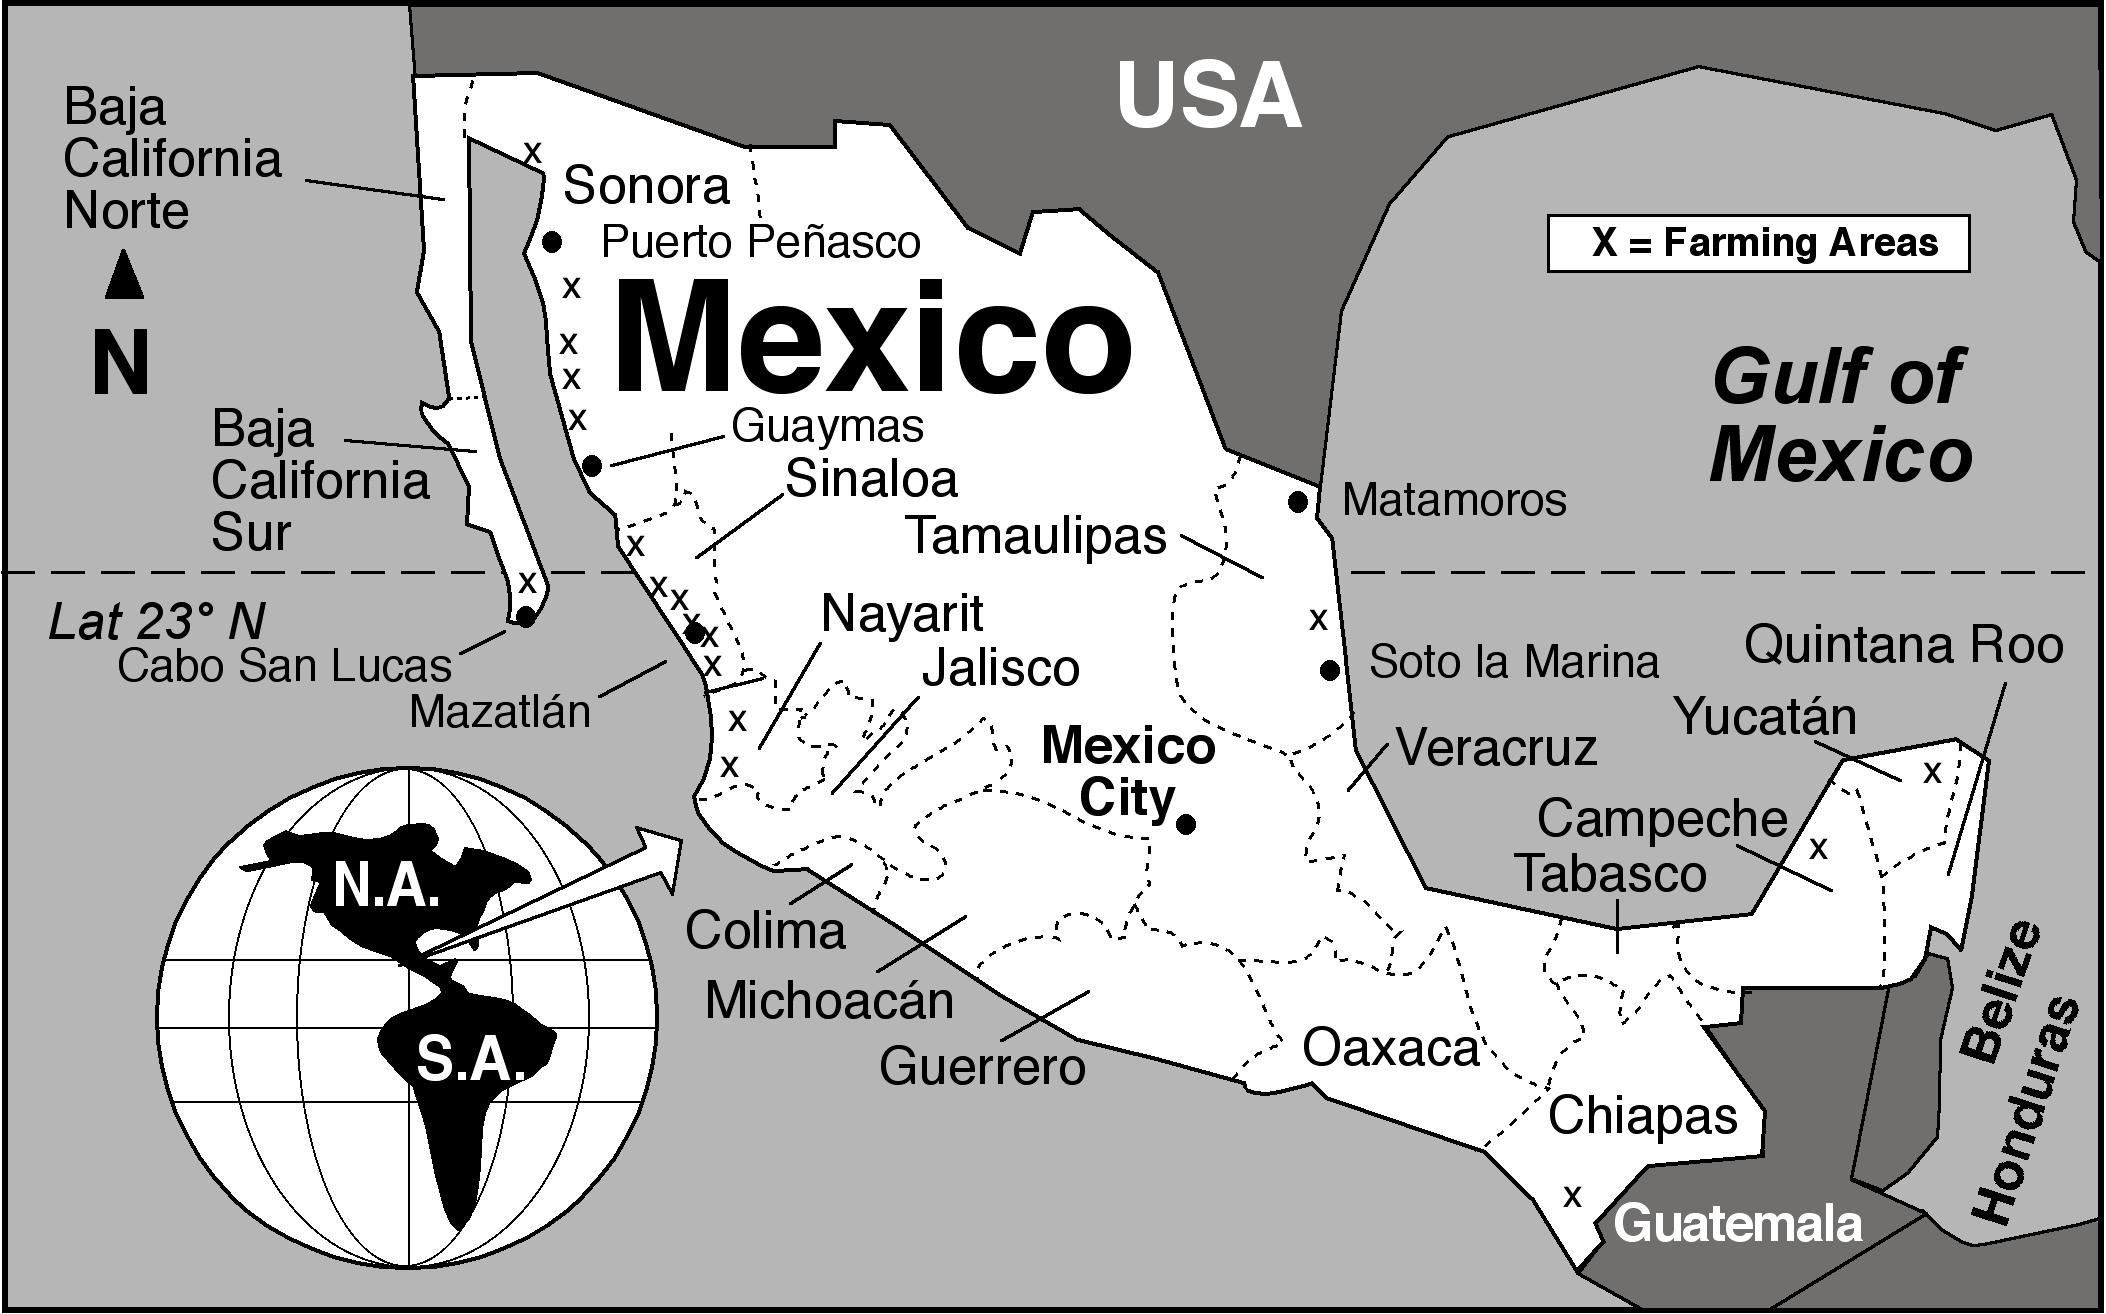
Mexico’s total shrimp production in 2007 was 178,000 tons. This total masks a significant trend in shrimping. The high-seas catch has declined since 1990 and less than a third of the total catch now comes from the 2100-vessel specialist shrimping fleet based in the port of Mazatlán. On the other hand, production of fish-farmed (“cultivated”) shrimp has risen sharply over the past 20 years and now accounts for almost 70% of total national production. In the past 24 months, fish-farmed shrimp have been hit by a serious disease, which has caused high mortality and a drop in production.
The main shrimp producing states are Sinaloa (520 shrimp farms; 35,000 hectares of shrimp ponds; 40% of cultivated shrimp production), Nayarit and Sonora (see map).
Credit: Shrimp News International
Wild shrimp
Catches of wild shrimp have been in decline. Shrimp fishermen are worried about the overfishing of shrimp stocks in shallow coastal waters, allegedly due to clandestine fishing by non-authorized boats. Pollution of coastal waters from agricultural chemicals is also a major concern. According to Adolfo Gracia Gasca, a researcher at UNAM’s Instituto de Ciencias del Mar y Limnología (ICMyL), only two species of wild shrimp are NOT overexploited: the brown shrimp in the Gulf of Mexico, and the brown shrimp in the Pacific.
Among the many wild shrimp populations that have collapsed are the white and pink shrimps of the Gulf of Mexico. Catches of pink shrimp in the Gulf of Mexico declined from 10,000-12,000 metric tons a year in the 1980s to around 500 metric tons in recent years. Catches of white shrimp in the same area over the same period fell from 1,600 metric tons/year to less than 200 tons/year. The major problem has been the failure to enforce a closed season for shrimping during their main reproductive periods. On the Pacific coast (including the Sea of Cortés), shrimping resumed on 5 September 2014.
The Shrimp Trade
Shrimp exports are worth $360 million a year. Shrimp imports have risen sharply in the past two years as disease has reduced domestic production. Indeed, Mexico is currently having to import more frozen shrimp than it exports.
Mexico’s shrimp exports in the first half of 2014 were worth US $91.4 million, slightly down from 2013, while imports shot up 935% to $106.6 million. Mexico is importing shrimp from Ecuador, Honduras, Guatemala, Nicaragua and Belize.
Cultivated shrimp
As a consequence of Early Mortality Syndrome (EMS), the production of farmed shrimp dropped sharply between 2012 and 2013, but is expected to recover in 2015. EMS first appeared in 2009 in the southern part of China, and then spread to Vietnam, Malaysia and Thailand. According to SAGARPA, the disease shows up in the first 20 to 30 days of life of the shrimp, and especially affects tiger (Penaeus monodon) and white (Litopenaeus vannamei) shrimp. The disease adversely impacted thousands of producers, with shrimp mortality rates as high as 98%.
The strain of EMS found in Mexico is very similar (but not identical) to the Asian strain. It is unclear how it arrived in Mexico and whether or not it was transferred across the Pacific.
The National Aquaculture and Fishing Commission (Comision Nacional de Acuacultura y Pesca—CONAPESCA) sets the closed season for fishing and shrimping. In general, the closed season is timed to coincide with the shirmp’s summer breeding season.
What is being done about EMS?
Among the strategies being adopted to combat the adverse impact of EMS are research, provision of financing and limits on shrimp imports from infected regions.
In June 2013, a breakthrough in EMS research was reported, when investigators attached to Kinki University and the National Research Institute of Aquaculture in Japan showed that the disease repeatedly manifests itself in ponds where the pH levels are between 8.5 and 8.8.
Shrimp farmers have needed emergency financing to help them restock shrimp ponds. In 2013, fish farmers in Sinaloa received $75 million to help with shrimp production and exports.
In April 2013, Mexico’s Agriculture, Fisheries and Food Secretariat (SAGARPA) ordered the temporary suspension of shrimp imports originating from China, Vietnam, Malaysia and Thailand. The suspension included all tiger and white shrimp, whether live, raw, cooked, dehydrated or “in any presentation”. However, this strategy was criticized by international experts as “counterproductive”, given that there is no evidence for EMS being spread via dead shrimp.
Pemex, Mexico’s state-owned oil giant, will start drilling the first of two deep exploratory wells in Mexico City later this month to investigate an aquifer deep below the city that is believed to hold vast quantities of potable quality water. For further background, please see our previous post on this topic:
The test wells are part of a $30 million multi-agency study now underway that incorporates experts from the Water System of Mexico City (SACM), the National Water Commission (CONAGUA), the engineering and geology departments of the National Autonomous University of Mexico (UNAM), and Pemex, which is providing the technology to drill the wells.
Later this month, Pemex will start drilling the first 2000-meter-deep test well in the Magdalena Mixhuca Sports City area, in the eastern part of Mexico City. Each well will cost an estimated $7.6 million to complete.
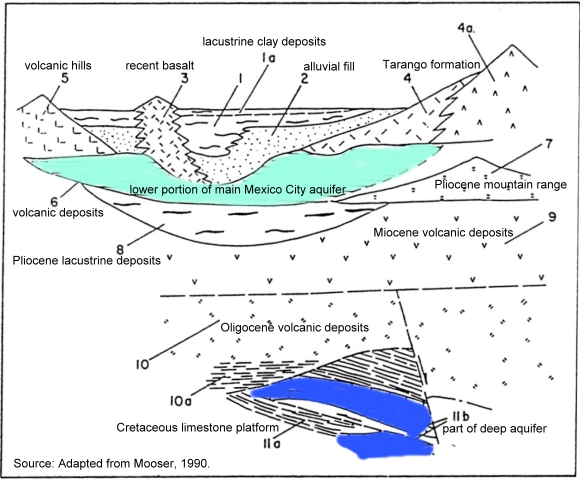
Schematic stratigraphy of the southern portion of the Basin of Mexico. Source: Adapted from Mooser, 1990.
Ramón Aguirre, the CEO of SACM, says that the two test wells will target two different zones, increasing the chances of demonstrating the value of the aquifer as a viable source of water for Mexico City. In particular, Aguirre expects the wells to help confirm that there is an impermeable cap of clay separating the deep aquifer from the principal aquifer in the area (from which water is already extracted). An impermeable layer would mean that water could be safely removed from the deep aquifer without leading to downward drainage of water from the aquifer above. It is expected to take about two years for the initial studies to be completed.
In its National Water Plan, CONAGUA has warned that population growth in the Valley of Mexico could result in serious water shortages by 2030, reducing annual availability from about 4,230 cubic meters/person to less than 1,000 cubic meters/person.
The major aquifer currently used lies at a depth of between 60 and 400 meters and is heavily over-utilized. There are about 630 wells in the Federal District alone; all are overexploited and have an average life expectancy of 30 years. Current extraction from the aquifer is around 17,000 liters/second, while its natural recharge capacity is only 8000-9000 liters/second. It is believed that the deep aquifer could be capable of supplying approximately 5000 liters/second.
Updates to Geo-MexicoComments Off on How fast are mangroves disappearing in Mexico?
Sep012014
It is surprisingly difficult to give a single, definitive response to this seemingly simple question, so in 2008, Arturo Ruiz-Luna and a group of researchers set out to answer the question once and for all, by taking a close look at the available data and its reliability.
The first challenge is to define precisely what counts as “an area of mangroves”. Since the edges of any one type of vegetation tend to merge gradually into the next, the boundaries between types are often not clear or discrete. The second challenge is to find comparable maps or records of the extent of mangroves in former times. In many cases, earlier maps were based on simple aerial photography as opposed to the more sophisticated satellite imagery available today. Equally, studies relying on different technology may produce quite different results.
Ruiz-Luna and his colleagues concluded that there was a high degree of uncertainty over the true extent of mangrove cover in Mexico and over the rates of mangrove depletion. The unreliability stemmed from the very different estimates of mangrove cover given in earlier studies.
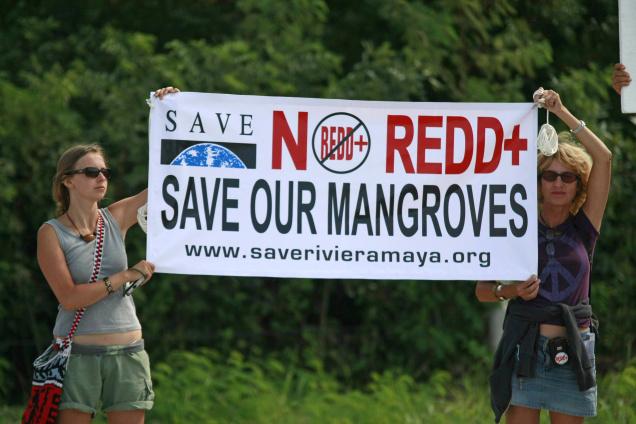
Opposition to the destruction of mangroves, Cancún climate summit, 2010
They found that the earliest estimate of the extent of mangroves in Mexico, made in 1973, was 700,000 ha (1.7 million acres). From 1980-1991, a figure of 660,000 ha was widely quoted. This is thought to have been derived from the previous figure using a linear regression to include estimated deforestation rates.
On the other hand, a study in 1992, based on 1:3,800,000 scale maps, arrived at an areal extent of 932,800 ha. A 1993 government estimate, based on satellite imagery and supporting ground survey, came up with a figure of 721,554 ha. A 1994 estimate, also using satellite data, arrived at a similar figure.
Since 2000, estimates vary from a low of 440,000 ha (based on deforestation rates and linear regression) to a high of 955,866 (almost all of it mangrove, with a small area of secondary mangrove succession).
According to Ruiz-Luna and his co-authors, it is therefore likely that the true value of the extent of mangroves lies somewhere between 600,000 and 900,000 ha, with the authors plumping for 800,000 ha as a reasonable estimate.
Why are mangroves lost?
Mangrove habitats are lost due to damage (deforestation) from logging and land use changes. Examples of land use changes adversely affecting the extent of mangroves are:
the conversion of mangroves to harbors, as in Manzanillo (Colima)
mangroves being converted for hotels and tourist use (Cancún)
mangrove swamps being reassigned for aquaculture (San Blas)
The loss of mangroves can also result from changes to hydrological systems on the landward side of the mangroves. For example, when an artificial channel was opened in the 1970s in Cuautla (Nayarit) to connect the Marismas Nacionales with the sea, the channel was originally about 50m wide. It is now about 600m wide in the middle, and more than 1000m wide at its mouth, due to damage caused by the river flow, and from the greater exposure of mangroves to higher salinity water, as well as increased mangrove mortality from storms and hurricanes.
While there are some small-scale projects to replant mangroves in some tourist area, this is unlikely to be a good substitute for the original mature mangrove ecosystem. This is why Geo-Mexico is happy to help publicize public protests against mangrove destruction, such as the one pictured above which took place at the Cancún climate summit in 2010.
Reference:
Arturo Ruiz-Luna, Joanna Acosta-Velázquez, César A. Berlanga-Robles. 2008. “On the reliability of the data of the extent of mangroves: A case study in Mexico.” Ocean and Coastal Management 51 (2008) 342-351.
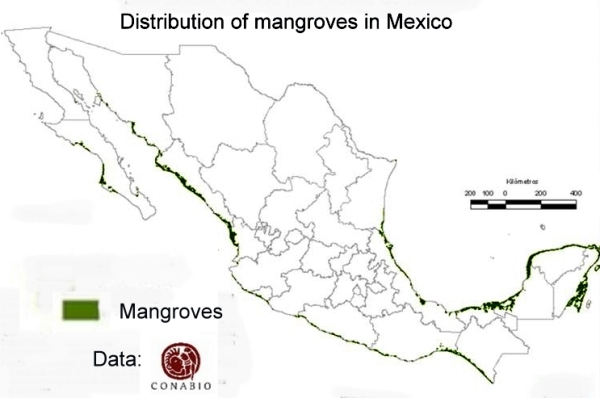
The National Commission for the Knowledge and Use of Biodiversity (Comisión Nacional para el Conocimiento y Uso de la Biodiversidad, CONABIO), has identified 81 distinct areas in Mexico that have mangroves with “biological significance and in need of varying degrees of ecological rehabilitation” (see summary map). These regions are distributed as follows:
10 on the northern Pacific Coast
6 on the central Pacific Coast
13 on the southern Pacific Coast
27 on the Gulf of Mexico and
25 on the Yucatán Peninsula.
A national inventory has now been compiled by CONABIO. All areas have been surveyed and preliminary descriptions published including details of their location, size, physical characteristics, socioeconomic conditions, local uses of mangrove, biological details, including vegetation structure, and an assessment of local impacts and risks, management and existing conservation measures.
The areas of mangroves have been mapped at a scale of 1:50,000 and satellite photos from 2005-2006 have been used in conjunction with fieldwork to calculate the areas of mangroves. The final map is believed to be more than 90% accurate, a reasonable baseline for future comparisons. CONABIO is planning to resurvey the mangrove areas every 5 years following the same methodology.
According to preliminary comparisons with previous attempts to quantify the extent of mangroves in Mexico (the subject of a future post), the loss of mangroves was greatest in the period 1970-1980, and in 2000-2005, but then diminished in the period 2005-2010.
Between 2005 and 2010, the states where mangrove loss remained high (as a percentage of the total area of mangroves in the state) included Chiapas, Baja Californa Sur and Sonora. However, the states losing the largest areas of mangroves in absolute terms were Quintana Roo, Campeche and Nayarit. Jalisco has the unfortunate distinction of being the state where coastal mangrove loss was highest (in terms of the proportion of its total coastline length bordered by mangroves).
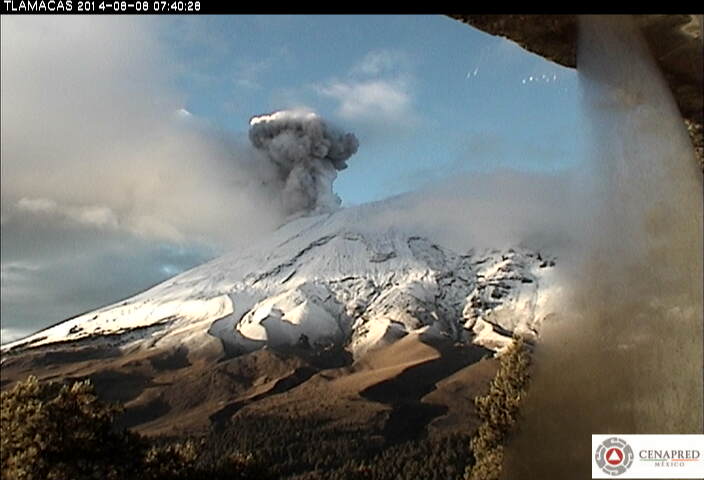
Popocatepetl Volcano, near Mexico City continues to be very active, with smoke and ashes belching up to 1000 meters above the crater rim. Mexico’s National Disaster Prevention Agency Cenapred, reports that the volcano had 82 “low intensity” exhalations on 7 August 2014, four of which contained “explosive material”.
Popocatapetl, 8 August 2014. Credit: Cenapred.
The agency also reported that many mionr tremors hd been recorded, including one harmonic tremor lasting 56 minutes. Geologists believe that the volcano is currently destroying dome number 50 even as dome number 51 begins to form. Dome #51 is currently about 70 meters in diameter. Renewed explosions, together with some ash fall is predicted for the coming days.
The Volcanic Traffic Light remains at Yellow Phase 2.
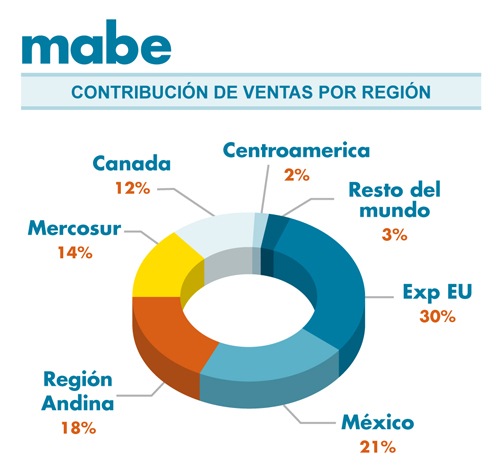
Mabe is one of Mexico’s largest multinational companies (2013 sales: $3.3 billion) with a total workforce of 21,000. The company designs, produces, and distributes domestic appliances (stoves, refrigerators, etc) to more than 70 countries.
The company was founded in 1946, in Mexico City, by two Spanish immigrants: Egon Mabardi and Francisco Berrondo. It started by making kitchen furniture but quickly added gas ranges and refrigerators. By 1960, Mabe had already become Mexico’s single largest exporter of home appliances.
It continued to expand via an aggressive series of acquisitions, including the purchase of companies in Venezuela, Ecuador, Colombia, Brazil, Peru, Argentina and Canada.
To boost its presence in the USA and Canada, in 1986 Mabe created a joint venture with General Electric to produce appliances for the US market.
Mabe sales, by region
GE held a 48% minority stake in the new venture and hoped to gain access to Mexico’s low cost labor pool, while Mabe was able to use GE’s existing distribution network to gain wider access to markets throughout the USA. Within a decade, two out of every three gas ranges and refrigerators imported into the USA were designed and manufactured by Mabe in Mexico. Almost all (95%) of the ranges and refrigerators sold as General Electric brands were designed in Mabe’s San Luis Potosi plant, the biggest kitchens plant in the world.
The implementation of NAFTA in 1994 led to further opportunities for Mabe. Since NAFTA, Mexico has become the leading supplier of household appliances, such as stoves, refrigerators, dryers and washing machines to the USA and Canada. In 2005, Mabe continued its expansion by acquiring Canadian firm Camco.
NAFTA also led to the firms competitors, including Whirlpool, Electrolux, Samsung and LG all establishing factories in Mexico.
The company, which is still headquartered in Mexico City, is a major purchaser of steel on the North American market, consuming steel worth around $500,000 each year. Its products include microwaves, washing machines and dryers, wine storage systems, air conditioning, motor-compressors, plastic injection and die-casting machinery.
It has about 15 manufacturing facilities in Latin America. The company’s factories in Mexico –located in Mexico City, Coahuila, Guanajuato, Nuevo León, Querétaro and San Luis Potosí– account for half its total output. In addition, refrigerators and ranges are manufactured in Colombia; freezers, refrigerators and ranges in Ecuador, and refrigerators, washing machines and ranges in Argentina and Brazil.
Mabe’s business practices incorporate a degree of “glocalization” in which the company’s designs are modified to be specific to particular regions, based on the consumer preferences and tastes in each country or region.
In 2014, Mabe announced that it was spending $80 million to repatriate its only Canadian plant from Montreal to Ramos Arizpe, Coahuila. The plant makes washing machines, driers and dishwashers. Together with Mabe’s existing plant in Ramos Arizpe, the two plants have the capacity to turn out about one million washing machines annually.
As presented in a previous post, 2.8% of Mexicans (3.3 million) live in severe poverty based on a June 2014 Multidimensional Poverty Index (MPI) developed by the Oxford (University) Poverty & Human Development Initiative (OPHI)[1]. The previous post explained the MPI measure of poverty and discussed how Mexico compared to the 108 countries in the study. This post looks into the details of MPI poverty within Mexico. Poverty in Mexico is mostly a rural problem. According to the study, roughly 8.5% of rural residents are severely poor (2.3 million) compared to only 1.1% of people in urban areas (1.0 million).
As indicated in the previous post, the MPI is based on ten separate indicators; two for education, two for health and six for standard of living. In all cases, people in urban areas scored better on all the indicators than those in rural areas. In rural areas several key MPI indicators contribute the most to poverty: insufficient schooling (19.3%), malnutrition (14.1%), children not attending school (12.9%), use of an unhealthy cooking fuel (12.9%) and unacceptable sanitation (11.7%) [2].
As expected the poorer more rural southern states had the highest MPI poverty levels. Oaxaca had the most living in poverty (11.1%) followed by Guerrero (10.6%) and Chiapas (8.3). Poverty was also high in San Luis Potosí (6.7%), Puebla (5.3%), Veracruz (4.6%), Campeche (4.2%), and Hidalgo (3.4%). These states all have significant indigenous populations. Though the study did not access severe poverty among indigenous groups, available information suggests that those groups suffer by far the highest levels of severe poverty. States with lowest MPI levels are Nuevo León (0.2%), Federal District (0.4%), Baja California (0.4%), Baja California Sur (0.4%), Durango (0.7%), Morelos (1.0%), Colima (1.0%), and Aguascalientes (1.0%); all states with relatively few indigenous inhabitants.
References:
[1] Oxford Poverty and Human Development Initiative (OPHI), “Global MPI Data Tables for 2014”, Oxford University, June 2014.
[2] Oxford Poverty and Human Development Initiative (OPHI), “OPHI Country Briefing 2014: Mexico,”
The National Statistics Institute (INEGI) has released population updates to coincide with today’s celebration of World Population Day (11 July). According to INEGI, Mexico currently has 118.4 million people, and is the 11th most populous country in the world.
The total world population is estimated at 7.2 billion, with slightly over half that number living in one of just 6 countries: China, India, USA, Indonesia, Brazil and Pakistan. The total fertility rate (globally) fell from 3.04 children/woman (1990-1995) to 2.53 children/woman (2005-2010). In 2010, the global life expectancy stood at 68.7 years.
Projections made by Mexico’s National Population Council (CONAPO) put Mexico’s 2013 fertility rate at just 2.2 children/woman, while life expectancy has risen (slightly) to 74.5 years. The reduction of fertility rate in Mexico is occurring in a society where the average level of schooling is increasing and where women report greater economic, social and political participation.
Between 1990 and 2011, maternal mortality in Mexico was reduced by 51.5%. Infant mortality over that period also fell, from 88 to 43 deaths/100,000 live births.
The percentage of the population that is aged 30 to 59 years increased between 1990 and 2011 from 25.5 to 35.7 %, while the percentage aged 60 and older rose from 6.2 to 9.5%. The proportion of Mexico’s population that is aged 60 and older is expected to continue rising and is predicted to reach 14.8% of the total population in 2030 and 21.5% in 2050.
INEGI also reported that the four leading causes of death among Mexicans are:
Diabetes mellitus (14.1% of all deaths)
Ischaemic heart disease (12.3%)
Liver diseases (5.5%)
Cerebrovascular diseases (5.3%)
Taken together, these four diseases, classified as chronic degenerative diseases, account for 37.2% of all deaths. Clearly while life expectancy in Mexico is increasing, it is accompanied by higher levels of obesity and physical inactivity. This will place a massive strain on health care budgets in the future.
Updates to Geo-MexicoComments Off on Multidimensional Poverty in Mexico: How severe is poverty in Mexico?
Jul072014
How severe is poverty in Mexico? How does it compare to poverty in other countries? A new study released in June 2014 suggests that 2.8% of Mexicans live in severe poverty based on a Multidimensional Poverty Index (MPI) developed by the Oxford (University) Poverty & Human Development Initiative (OPHI) [1]. For all 108 countries in the study (representing roughly 78% of the world’s population), 32% live in severe poverty; thus the percentage for Mexico appears rather small in comparison to most places. This post is an update of previous Geo-Mexico posts on this topic:
The MPI in the study discussed here is based on a complicated methodology which relies on three different sets of household survey data. Its approach looks at poverty characteristics of household. This is superior to most other poverty measures that look at incomes in comparison to some type of poverty line, which varies widely from country to country. A household may have adequate income, but if that money is spent frivolously on alcohol, drugs, gambling, entertainment, etc., the children in the household might still be living in severe poverty.
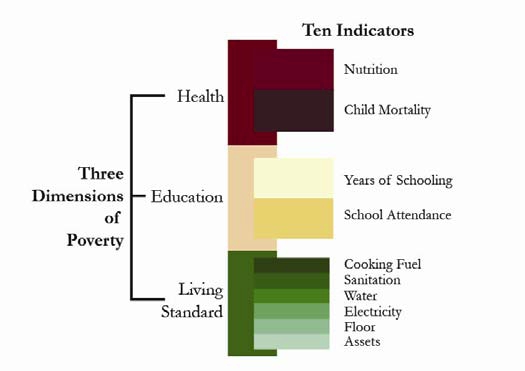
The MPI uses ten indicators (see graphic) representing three equally weighted dimensions of poverty or deprivation within a household: Education, Health and Standard of Living [2]. Education looks at whether any member of the household has at least five years of schooling and if all school –aged children are attending school. Health focuses on whether a child in the family has died and if any adult or child in the household is malnourished. Standard of Living has six indicators for each household: electricity, safe drinking water, proper sanitation, adequate house flooring (not dirt, sand or dung), clean cooking fuel (not wood, charcoal or dung), and ownership of more than one of the following – radio, TV, telephone, bike, motorbike, refrigerator or ownership of a car or truck. Obviously these indicators reveal far more details about poverty than simple income measures. A complicated formula is used to combine these indicators to identify households in severe poverty. A more detailed description of the methodology is provided in this previous post.
As noted above, according to MPI, 2.8% of Mexicans or 3.3 million people are severely poor [3] compared to 32% or 1.6 billion in the 108 countries analyzed which include most of the countries of Latin American, Africa, Asia and Eastern Europe. Of the 108 countries, 29 have smaller percentages living in severe poverty than Mexico. These include Belarus (0.0%), Russia (1.3%), Ecuador (2.2%) and Brazil (2.7%). It is interesting that Ecuador and Brazil have lower MDI levels of poverty than Mexico because both have lower per capita incomes than Mexico and far more income inequality. For example, 0.7% of Mexicans live on under $1.25 a day and 4.5% live on under $2.00 a day, compared to 4.4% and 13.6% for Ecuador and 3.8% and 9.9% for Brazil. Apparently, in Ecuador and Brazil either survival necessities are cheaper or they spend their incomes more wisely or public safety nets are more effective. This suggests that Mexicans could do a better job of combating severe poverty.
Countries with slightly worse MPI levels than Mexico are Argentina (3.0%), the Czech Republic (3.1%), Hungary (4.6%), Dominican Republic (4.6%), Colombia (5.4%), Egypt (6.0%) and Turkey (6.6%). That the Czech Republic and Hungary are below Mexico is a bit of a surprise. Further down on the list are China (12.5%), South Africa (13.4%), Peru (19.9%), Indonesia (20.8%), and Guatemala (25.9%). The countries with the severest MPI levels include Pakistan (49.4%), India (53.7%), Nigeria (54.1%), the Democratic Republic of the Congo (73.2%), Ethiopia (88.6%), and lastly Niger (92.4%).
According to the study the country with the most people living in severe poverty is India (612 million) followed by China (162m), Bangladesh (83m), Nigeria (82m), Pakistan (81m), Ethiopia (66m), Indonesia (48m), the Democratic Republic of the Congo (44m). Compared to these countries, the 3.3 million in Mexico seems like a rather small number.
Though severe poverty in Mexico is far less than in most other countries, it is still a very serious problem which needs to be addressed. As might be expected, within Mexico severe poverty is worst in rural areas and southern states; we will look more closely at this in a subsequent post.
References:
[1] Oxford Poverty and Human Development Initiative (OPHI), “Global MPI Data Tables for 2014”, Oxford University, June 2014.
[3] According to the Mexican Government’s Poverty Line, 52% of Mexicans live in poverty. Obviously this is a very different poverty measure than the MPI.
In a recent post – Mexico’s internet connections and e-commerce – we looked at how 35.8% of Mexican households now have computers, 30.7% are now connected to the internet, and at the very rapid rise of e-commerce over the past few years.
How does internet access in Mexico compare to other countries? Comparative studies show that Mexico lags well behind almost all major countries in terms of internet access. Mexico’s rate of 30.7% of households with internet access compares poorly with other countries in Latin America such as Brazil (37.8%), Chile (37.8%) and Argentina (34.0%).
Among OECD member states, Mexico ranks bottom in terms of internet access. South Korea ranks top, with 97.2%. The Netherlands, Norway, Iceland, Luxembourg, Sweden and Denmark all have rates over 90%. Canada has a rate of 78.4%, the USA 71.1% and Japan 67.1%. The lowest ranking European countries are Turkey (41.6%), Greece (50.2%) and Portugal (58.0%).
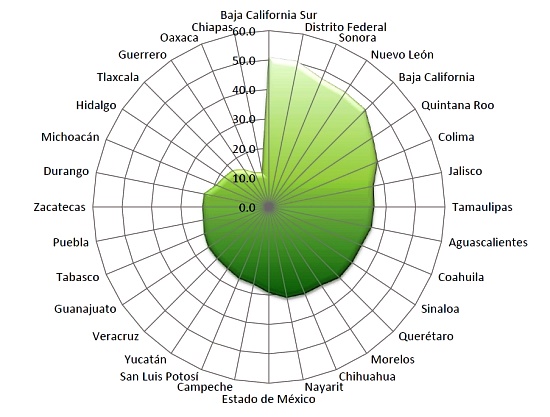
Within Mexico, the rate of internet access varies widely from one state to another (see graph).
Percentage of households with internet access. Source: INEGI (2014)
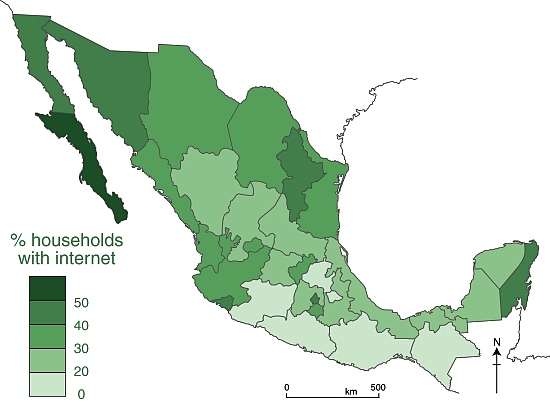
The disparities are evident from the graph, but the pattern becomes much clearer when the data are grouped and mapped:
Pattern of internet access, 2013. Data: INEGI. Credit: Geo-Mexico
The north-south divide in Mexico, that we have frequently referred to in previous posts, is immediately evident (with the notable exception of the easternmost state of Quintana Roo). Perhaps not surprisingly, there is a close correlation between GDP/capita in different states and their internet access.
Discussion question:
What other factors are likely to influence rates of internet access? To support, or challenge your ideas, try using Geo-Mexico’s map index to find maps to compare with the map of internet access.
Source of data:
“Estadísticas a Propósito del Día Mundial de Internet” (pdf file) (INEGI 2014)
Updates to Geo-MexicoComments Off on Mexicans drink more bottled water per person than anywhere else in the world
May032014
Mexicans are the world’s largest consumers of bottled water, both in individual small bottles (1.5 liters or less) and in garrafones (large, 20-liter bottles).
The main reason is a lack of confidence in the purity of public water supplies, resulting in part from perceived inefficiencies in how city water systems are managed and maintained. These concerns may be valid in some parts of Mexico, but are certainly not the case in all areas. Other factors resulting in a high acceptance of bottled water are the convenience, Mexico’s warm climate, and the vigorous publicity and advertising campaigns carried out by bottled water companies. It does not help that consumer groups repeatedly express concerns even about the quality of water in garrafones, claiming that some companies apparently take insufficient precautions to prevent its contamination.
For its part, the National Water Commission repeatedly claims that the problem of water quality is not due to the main distribution lines in Mexico, but to problems at a local level, in the final stages of the network between supply and consumers.
Typical 20-liter garrafon
According to Euromonitor International, bottled water consumption in Mexico in 2013 averaged 186.7 liters/person, well ahead of Italy (175.1 liters/person), Nigeria (163.1), Turkey (147.7) and Spain (143.2). [Note that an earlier estimate in 2010 by Beverage Marketing Corporation put per person consumption of bottled water in Mexico at 234 liters a year, with equivalent figures for Italy, Spain and the USA of 191 liters, 119 liters and 110 liters respectively; the difference from 2010 to 2013 is almost certainly due to methodological differences].
Mexico consumes about 13% of all bottled water sold in the world! The only countries consuming more bottled water (in total volume) than Mexico were the much more populous countries of the USA, China and Nigeria.
Bottling water is a highly profitable business. The cost of 1,000 liters from the tap is 25 pesos (about 2 dollars); the same water, sold in bottles, is worth between 6000 and 8500 pesos (450 to 650 dollars).
The bottled water market in Mexico has grown from 6.5 billion dollars in 2009 to 10.4 billion in 2013, according to Euromonitor. It is dominated by three foreign firms: Danone (France), Coca-Cola (USA) and PepsiCo (USA). Between them, they supply 82% of the market, according to a Euromonitor report, with the three leading brands being Bonafont (Danone) which accounts for 38% of the market, followed by Ciel (Coca-Cola) which has a 25% share and Epura (PepsiCo) 19%.
The cost of bottled water in an average Mexican household is considerable. For instance, assuming an average consumption of 15.55 liters/month/person, and that all water is bought in 1-liter bottles (which cost about 8 pesos each), then the monthly cost per household would be close to 500 pesos (38 dollars).
An industry dominated by four multinationals
Inside the Bottle: An Exposé of the BottledWater Industry, a book by Canadian activist Tony Clark, provides a vivid and disturbing portrayal of how, worldwide, four big companies – Nestlé, PepsiCo, Coca-Cola and Danone – dominate the bottled water industry. As summarized by infinitewaterinc.com, the book examines several key issues of public concern about the operations of these companies, including how they:
pay little or nothing for the water they take from rural springs or public systems;
turn ‘water’ into ‘water’ through elaborate treatment processes;
produce a product that is not necessarily safer then, nor as regulated as, tap water;
package it in plastic bottles made of environmentally destructive toxic chemicals;
market it to an unsuspecting public as ‘pure, healthy, safe drinking water’; and
sell it at prices hundreds, even thousands of times more costly than ordinary tap water.
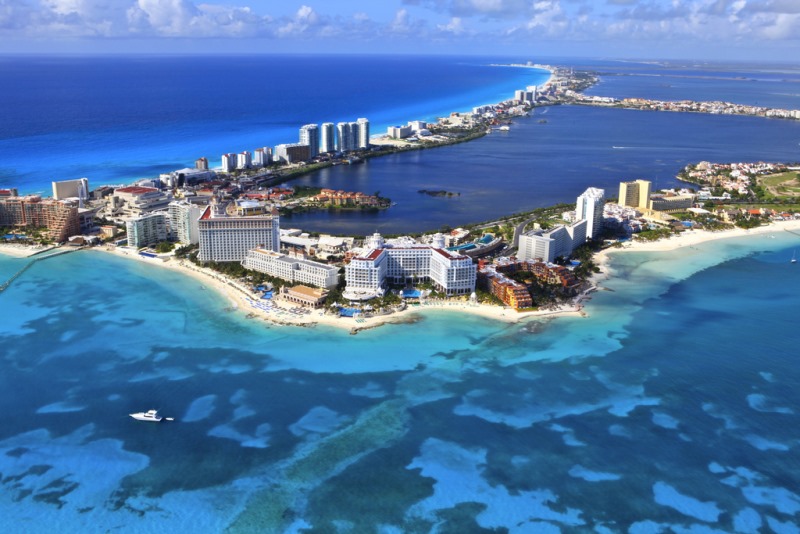
The resort of Cancún in Quintana Roo is celebrating its 44th birthday this year. Local officials have arranged a series of events between 19 and 27 April, including an exhibition of vintage cars, to mark the occasion.
The construction of the purpose-built resort Cancún, planned by the Federal Tourism Development Agency FONATUR, began in 1970:
The tourist part of the city has thrived. Cancún now has more than 3000 condominium units, luxury shopping centers, restaurants, museums, discos, bars, an international airport and more than 150 hotels, with 35,087 hotel rooms.
In 2013, some 14 million visitors passed through the airport. Hotels had a profitable 2013, with an average room occupancy of 77.2%. Visitors to Cancún contributed an estimated 4.36 billion dollars to the local economy. Tourism provides direct employment in Cancún for around 52,600 people, and indirect employment for 175,000.
Cancún by Arthur Gonoretzky (Flickr)
There is a less rosy side to Cancún. Besides the obvious adverse impacts of so many tourists, there are many other issues arising from the extraordinarily rapid growth of tourism in this area. For example, see Beach erosion in the tourist resort of Cancún, Mexico.
Tourism aside, perhaps the biggest single issue is in the “regular” city of Cancún (as opposed to the tourist zone). Cancún city (2010 population: 628,000, but sometimes claimed now to be more like 800,000) is where most supporting services are located, and most workers live. The city has grown so fast that it lacks sufficient services and fails to offer a good quality of life for its residents.
Updates to Geo-MexicoComments Off on Pemex defines its priority areas for oil and gas
Apr212014
Recent reforms to the energy sector have meant that Pemex has had to define its priority areas, those areas where it wishes to continue exploration and development. At a later date, it is then possible for the government to ask for bids from other oil companies, and award contracts to explore and develop oil and gas fields in other areas of Mexico. The first stage is known as Round Zero.
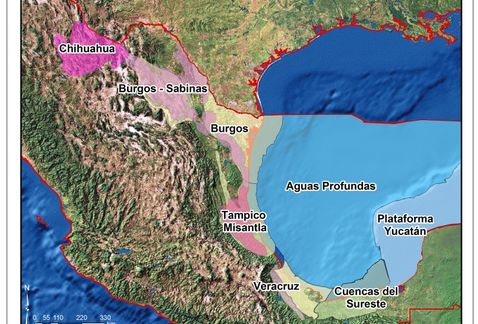
In March, Pemex published its portfolio of areas for exploration for “Round Zero” (Ronda Cero), with preliminary data for 2P (proven, probable) and 3P (proven, probable, possible) reserves as of the start of this year. 2P reserves totaled 24.174 billion barrels of crude equivalent, while 3P reserves totaled 43.8 billion barrels. The figures, slightly lower than the equivalent figures from January 2013, have not yet been confirmed by independent auditors.
Map from Pemex “Round Zero” document
46% of probable reserves are located in Chicontepec (Proyecto Terciario del Golfo) in Veracruz, and 43% in offshore regions including the Akal, Balam, Ayatsil, Maloob, Kunah and Tsimín fields.
56% of possible reserves are located in Chicontepec, and an additional 34% in offshore regions.
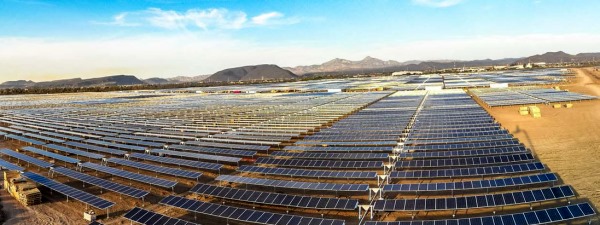
Latin America’s largest solar power plant is now supplying power to the city of La Paz in Baja California Sur. The Aura Solar I photovoltaic power plant has an installed capacity of 30 MW. The plant was officially inaugurated on 19 March 2014, and will supply about 82 GWh/year of electricity to around 164,000 residents of La Paz, more than two-thirds the city’s total population of 220,000. It is located a short distance east of the city, and replaces an old, air-polluting thermoelectric plant.
The new power plant, owned by Corporación Aura Solar, is the largest photovoltaic power plant in Latin America, according to company chairman Daniel Servitje Montull. The 100-million-dollar plant occupies 100 hectares (250 acres) and was constructed by engineering firms Gauss Energía and Martifer Solar. The project relies on about 131,800 solar panels and has an estimated operational life of 30 years. About 25% of Mexico’s electricity is currently generated using clean energy sources. Mexico has set a national target of 35% clean energy by 2024, in order to minimize Mexico’s contribution to global climate change.
This 2-minute YouTube video shows various stages in the building of the plant:
Updates to Geo-MexicoComments Off on León hosts Latin America’s largest trade fair for footwear
Mar262014
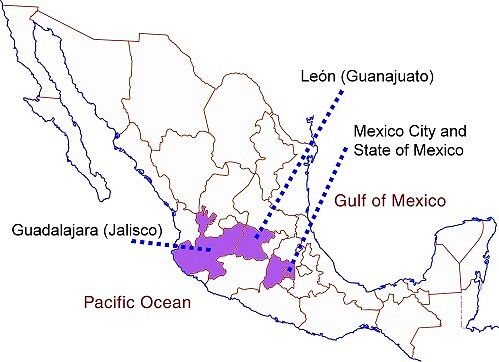
Mexico’s footwear industry is heavily concentrated in three main cities: León, Guadalajara and Mexico City. Factories and workshops in the city of León in the state of Guanajuato account for about 68% of all shoes made in Mexico. The two other important manufacturing areas for footwear are Guadalajara (Jalisco) where about 18% of the national production originates, and Mexico City (together with surrounding parts of the State of Mexico), responsible for 12%.
Concentration of shoe industry in Mexico.
According to the 2009 Economic Census, there were close to 7500 “productive units” related to shoe manufacturing in Mexico, with about half of them located in the state of Guanajuato. In 2012, national producers turned out 244 million pairs of footwear, of which 171 million pairs (70%) were made in Guanajuato.
Shoes are also an important international trade item. In 2013, shoe exports reached 26 million pairs, worth almost $600 million (an increase of 14% compared to 2012). The main export markets were the USA, Canada, Colombia, Guatemala, Panama and Japan.
Mexico’s shoe industry hosts several major trade fairs each year. The single biggest event, SAPICA (Salón de la Piel y el Calzado), is Latin America’s largest international footwear trade fairand is held in León twice a year. The next SAPICA trade fair opens today and runs 26-29 March 2014 in León, Guanajuato. This show has 45,000 square meters of exhibition space, more than 2000 stands and 850 presentations. SAPICA has gained international recognition and attracts 11,000 buyers (from the USA, Canada, Europe, Japan, and Central and South America) and 35,000 visitors each year.
The flexibility of León’s shoe manufacturing industry has enabled firms such as Poppy Barley (based in Edmonton, Canada) to be able to market custom-made boots via their website and without the overheads of any conventional footwear stores . Individual purchasers take their own foot measurements, and then the boots are made to order and shipped to their homes. This “made to measure digital retail” approach flies in the face of the mass production that has become the norm in the footwear industry. The Poppy Barley website includes a section devoted to its manufacturing partner in León.
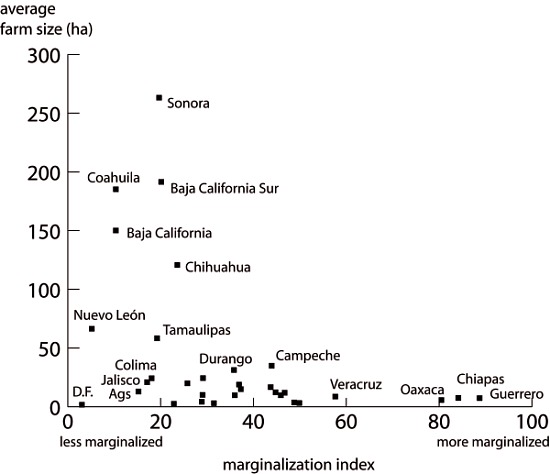
Having noted in previous posts that farm sizes in southern Mexico are smaller (on average) than in northern Mexico, and that farm size is affected by socio-economic factors, and that farmers of smallholdings are unable to generate a decent profit, it is interesting to consider the relationship between farm size and marginalization.
Mexico’s National Population Commission (Conapo) has formulated a compound indicator of “marginalization” and publishes its “marginalization index” at regular intervals. Data are available at both the state and the municipal level for the entire country. This discussion relies on the state level data.
Scatter graph showing average farm size and marginalization index. Data: INEGI, Conapo. Credit: Geo-Mexico
Each dot on this scatter plot represents a state. For the 32 points, the statistical correlation (Spearman’s Rank Correlation Coefficient) is –0.483. This negative correlation (significant at the 95% level) means that marginalization is inversely associated with farm size (i.e. the greater the marginalization, the smaller the likely farm size).
The uneven distribution of farmland in Mexico was one of the fundamental causes of the Mexican Revolution in 1910, but by no means the only one. Landless campesinos(peasant farmers) lacked any way to control their own supplies of food. Revolutionary leaders called for the expropriation of the large estates or haciendas, which had been the principal means of agricultural production since colonial times, and the redistribution of land among the rural poor. A law governing this radical change in the land tenure system came into force in 1917 and the process has continued, albeit sporadically, into modern times.
About half of all cultivated land in Mexico was converted from large estates into ejidos, a form of collective farming. In most ejidos, each individual ejidatario has the rights to use between 4 and 20 hectares (10-50 acres) of land, depending on soil quality and whether or not it is irrigated. In addition, members of the ejido share collective rights over the use of local pasture and woodland.
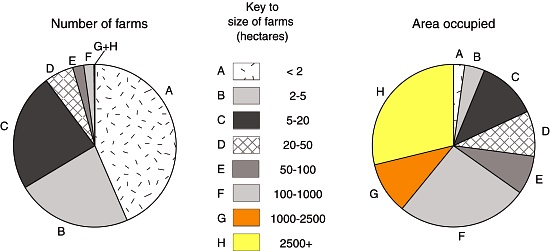
By 1970 land redistribution had been more or less completed. Even so, most farming land still remained in the hands of a very small minority of farmers (Figure 15.2). Only 1% of farms were larger than 5000 hectares (12,355 acres) but between them they shared 47% of all farm land. Meanwhile, 66% of farms were smaller than 10 hectares (25 acres) yet they shared only 2% of all farm land.
Have things improved since then?
The 2007 farm census (see graphic) revealed that two-thirds (66.4%) of all farms are under 5 hectares (12.4 acres) in area; this percentage has remained roughly the same over the past 40 years. Between them, they farm just 6.2% of Mexico’s total farmland.
The number and size of farms, 2007 (updated Figure 15.2 of Geo-Mexico). Data: INEGI. Credit: Tony Burton / Geo-Mexico
The number of small farms has increased since 1970, but so has the total number of farms. Between 1991 and 2007, there was a 55.2% increase in the number of farms under 2 hectares in area, and a 45.4% increase in the total area they worked.
There is no solid data for why the number of microfarms has increased, but it may be partially explained by larger farms being split into smaller pieces (one for each family member) following the death of their original owner.
Most tiny farms are likely to be family-run, producing crops largely for subsistence, rather than for market. Small plots of land are likely to prove uneconomic and unsustainable to farm; it is impossible to generate sufficient profit from them for a family to enjoy a decent livelihood.
In one study, Enrique de la Madrid Cordero, writing for Financiera Rural, calculated that a typical smallholding of 5 hectares, planted with corn (maize) could generate a profit for the owner of about $4000 pesos. This profit represents 6 months work. At the time of his study, someone earning minimum wage for the same six months would have received a total of almost $10,000 pesos. The precise numbers vary, depending on average yields and the crops planted, but cultivating a smallholding is obviously not an easy way to make a living.
These same farmers are unable to advance since they have no means of accessing credit, having no suitable assets to offer as collateral, even if they could ever afford to pay the interest! Similarly, they do not have the savings to invest in improved equipment, higher cost seeds or to introduce new techniques or technology. They are, essentially, trapped in a cycle of poverty.
At the other end of the scale, a very small percentage of farms in Mexico are very large indeed. Nationwide, 2.2% of farms account for 65.1% of the total area farmed in the country. Larger farms are commercial operations, sometimes multinational operations. Their size and profitability ensures they have ready access to credit, and can adopt new technologies and methods relatively quickly.
The uneven distribution of land in Mexico clearly remains an issue, one that is likely to impact social justice agricultural output and productivity for decades to come.
As noted in previous updates on Mexico’s drug cartels and their shifting areas (and methods) of operation, it is becoming ever harder to keep up-to-date with the geography of drug cartel territories. The current federal administration has deliberately limited the amount of hard data relating to drug violence published on government sites or in Mexico’s mainstream press. While this may help to reduce public unease at the levels of drug-related crime, it also means that it has become much harder to analyse the situation and determine overall patterns and trends.
The 2013 UN Global Report on Drugs estimates that Mexico is Latin America`s largest drugs producer, making 30 times more heroin than Colombia. The report also cites statistics showing that more methamphetamine are confiscated in Mexico than in the rest of the world combined.
Los Zetas, operating in more than half of Mexico’s 32 states (more territory than their main rivals the Sinaloa Federation), and prone to extreme violence. They have branched out into human trafficking and extortion to support their drug smuggling operations. They control much of eastern Mexico. Even the capture of their top leader in 2013 does not appear to have significantly weakened their internal cohesion.
Sinaloa Federation, which remains in control of most of western Mexico, and increasingly specializes in the production of methamphetamine. The cartel is led by Joaquín “El Chapo” Guzmán, whose estimated personal net worth exceeds $1 billion dollars according to Forbes magazine. Guzmán escaped from a high secrutiy jail in 2003 but was recaptured in Mazatlán in February 2014.
Gulf Cartel, still important along Mexico’s Gulf coast, but weakened due to infighting, captures of leaders, and conflicts with Los Zetas.
Knights Templar (Los Caballeros Templarios), started in 2010 by former members of The Michoacán Family (La Familia Michoacana), and which now controls much of the drug-related activity in Michoacán and Guerrero. They are in near-constant conflict with the Jalisco New Generation Cartel (based in the neighboring state of Jalisco) which has resulted in continued violence along the Jalisco-Michoacán border.
Smaller, regional players:
Tijuana Cartel, operating in the city of Tijuana on the Baja California/California border.
Juárez Cartel, now largely limited to Cd. Juárez and the border with Texas. Mexican federal police say this group now calls itself the New Juárez Cartel (Nuevo Cartel de Juárez).
Jalisco New Generation Cartel (Cartel Jalisco Nueva Generación), based in the state of Jalisco and thought to operate as enforcers for the Sinaloa Federation
Cartel del Pacífico Sur; weak, and competing with Zetas, mainly in the central Mexico state of Guerrero
Independent Cartel of Acapulco, small and apparently declining in importance
Splinter groups (see below):
Sangre Z
Golfo Nueva Generación
La Corona
Cartel areas and drug routes in Mexico, 2012. Copyright Stratfor. Click map for enlarged version
Recent changes (2013-2014)
Early in 2013, Mexico’s National Security Cabinet revealed the emergence of several new drug trafficking organizations. The new groups–Sangre Z, Golfo Nueva Generación, and La Corona– are splinter groups from Los Zetas, the Gulf Cartel, and the Sinaloa Federation respectively. The new groups formed in response to the arrest of key operatives in the large cartels. These new groups are reported to be well equipped and well-armed, generating revenue through drug trafficking and by levying protection payments on other drug traffickers who pass through their turf on their way to the USA..
In 2013, the situation in the western state of Michoacán became particularly unstable with drug-related violence (shootouts, roadblocks and the torchings of vehicles) perpetrated by the Knights Templar in many parts of the state. The town of Apatzingan in the Tierra Caliente region of Michoacán is the main bastion of the Knights Templar organization. The increased violence resulted in the well-publicized rise of civilian “vigilante” militia groups (community self-defense groups), prepared to take on cartel members in direct combat in their efforts to reduce the incidence of extortion, kidnappings and other crimes. Self-defense groups sprang up in more than 30 municipalities in Michoacán including at least 15 of the state’s 113 cities. Places with self-defense groups included Buenavista Tomatlan, Coalcoman, Tepalcatepec, Los Reyes, Aquila, Paracho, Cheran, Tancitaro, Paracuaro and Nueva Italia.
For a good summary account of the struggle between the Knights Templar and the vigilantes, see Mexican Vigilantes Beat Back Ruthless Knights Templar Cartel by journalist Ioan Grillo. We will take a closer look at the Knights Templar in a future post.
In recent months, in the wake of drug gang attacks on gas stations and electricity facilities in Michoacán, the federal government has stepped up its attempts to resolve the security problems in the state. In some places, it has replaced city officials and local police forces en masse. In the important Pacific Coast port of Lázaro Cárdenas (a main port of entry for the chemicals used for methamphetamine production, and a main export port for minerals, one of the more lucrative sources of income for the Knights Templar), the federal government sent in the military to administer the port.
In their efforts to curb the rise of civilian militia groups, the federal and state governments have announced a scheme which allows militia members to register to join new, state-controlled Rural Protection Forces (RPF). As of early February 2014, about 500 “self-defense” members had already registered to join the RPF.
The federal government has also announced the creation of a 3.5-billion-dollar purse to support 250 specific actions in Michoacán designed to reactivate the state’s economy, reinforce security and aid its social assistance programs.
The authors take violent crimes to include intentional homicide, kidnapping, rape, aggravated assault, robbery with violence and extortion.
At the municipal level, violent crime is concentrated in a relatively small number of municipalities. The report looks at the statistics for the 216 municipalities (including delegaciones of the Federal District) that had estimated populations of over 100,000 in 2013. Since 2012, four municipalities have joined this group: El Fuerte (Sinaloa), Tepotzotlán (México), Pánuco (Veracruz) y Playas de Rosarito (Baja California). Between them, the 216 municipalities are home to about 64% of Mexico’s total population.
Data from government agencies and INEGI were used to compile rates for each crime in each municipality. These rates were then multiplied by the following weightings (to reflect the relative severity and impacts of each type of crime),
0.55 for intentional homicide
0.22 for kidnapping
0.13 for rape
0.04 for aggravated assault
0.03 for robbery with violence
0.03 for extortion
and summed to give an overall index for “violent crimes”. For the 231 municipalities, the index ranged from 106.63 for Oaxaca, Oaxaca to 0.00 for Zapotlán el Grande in Jalisco. The full details of the methodology are explained and discussed in the report. A similar methodology was also used to calculate levels of violence by state.
The worst 10 municipalities in terms of violent crime were:
Oaxaca, Oaxaca – violent crime index value of 106.63
Acapulco, Guerrero – 80.35
Cuernavaca, Morelos – 65.30
Yautepec, Morelos – 56.19
San Pedro, Coahuila – 53.42
Cd. Victoria, Tamaulipas – 52.48
Iguala de la Independencia, Guerrero – 52.25
El Fuerte, Sinaloa – 50.82
Jiutepec, Morelos – 50.29
Torreón, Coahuila – 49.31
The national index (ie treating the entire country as a single entity) was 23.17, meaning that the index value for violent crimes in Oaxaca, Oaxaca, was more than four times that of the country as a whole.
Municipalities which were in the worst twenty in 2012 for violent crime, but have now fallen out of that group include: Lerdo (Durango) Zacatecas (Zacatecas), Cuautla (Morelos), Zihuatanejo (Guerrero), Temixco (Morelos), Cuauhtémoc (DF), Tecomán (Colima), Navolato (Sinaloa), Centro (Tabasco) and Monterrey (Nuevo León).
Moving into the worst twenty for the first time are: Playas de Rosarito (Baja California), Hidalgo del Parral (Chihuahua) San Pedro (Coahuila), Chilpancingo (Guerrero), El Fuerte (Sinaloa) and Chalco, Cuautitlán, Cuautitlán Izcalli, Ecatepec and Naucalpan (all in the State of Mexico).
Of the 213 municipalities, Acapulco had the highest intentional homicide rate (112.81/100,000, about 6 times the national rate of 19.05/100,000). Cd Victoria had the highest kidnapping rate (23.28/100,000, 15 times higher than the national rate of 1.46/100,000, though kidnapping rates in Mexico are notoriously unreliable, and have been the subject of intense press debate in recent months).
Violent crimes by state, 2013
By state (see map), Guerrero had the highest violent crime index with 47.76 points, followed by Morelos 43.99 and Chihuahua 40.87. In general, with the prominent exceptions of the State of México and Guerrero, the southern half of Mexico appears to be somewhat safer than the northern half.
Violent crime index, 2013. Source of data: see post. Credit: Geo-Mexico
For individual categories of crime at the state scale, Morelos had the highest kidnapping rate (8.24/100,000). Quintana Roo had the highest rate of rape (28.31/100,000, compared to national average of 11.36/100,000). The State of Mexico had the highest rate for aggravated assault (251.64/100,000 compared to national average of 130.21/100,000). Morelos came out on top for the highest rate of robbery with violence (455.08/100,000 compared to national average of 182.61) and for the highest rate of extortion (21.96/100,000 compared to national average of 6.94/100,000).
Good news for tourists
According to this report, almost all of Mexico’s major tourist destinations (with the noteworthy exception of Acapulco) are located in areas where violent crime is below the national average.
As we saw in an earlier post – Poverty on the rise in some states in Mexico – the total number of people living in poverty in Mexico continues to rise, though the poverty rate (as a percentage) remains roughly the same.
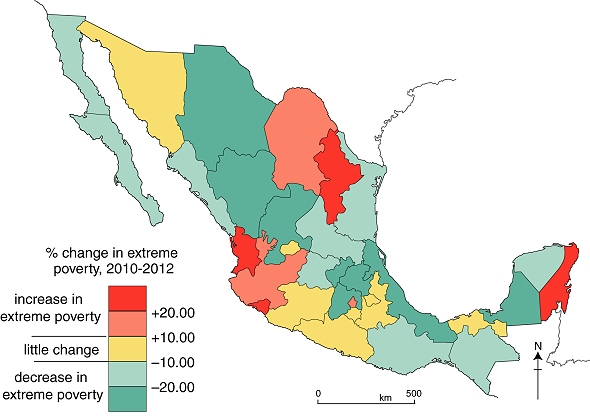
The measures of poverty used by Mexico’s National Political and Social Development Commission (Coneval) are multidimensional, and not simply based on household or personal income. This map shows the changes in “extreme multidimensional poverty” (a category that includes “the poorest of the poor”) that occurred in Mexico between 2010 and 2012.
Changes in levels of extreme poverty in Mexico, 2010-2012. Credit: Geo-Mexico; all rights reserved. Data: Coneval
In areas shaded red, a higher percentage of the population experienced “extreme poverty” in 2012 than in 2010; their personal situations and opportunities have presumably become significantly worse. Interestingly, this category includes the prosperous states of Nuevo León (economy based on manufacturing and services) and Quintana Roo (tourism).
The reverse is true for areas shaded blue where the extreme poverty rate has fallen: many of the people living in those areas have moved out of the most extreme category and presumably have seen their fortunes and opportunities improve, even if, in most cases, not sufficiently to have escaped the “poverty” category completely. This category includes more than half of Mexico’s 32 administrative divisions.
The fact that “extreme poverty” has declined in more than half of Mexico is encouraging, and suggests that government policies aimed at poverty reduction, such as Oportunidades are gradually making a difference. It remains to be seen whether or not this trend continues over the next few years.
Mexico recently approved the most significant energy reforms since the nationalization of the oil industry in 1938. The reforms end the 75-year monopoly over the energy industry enjoyed by state oil giant Petroleos Mexicanos (Pemex), opening the way for private investment in petroleum exploration and production.
The proposals do not allow foreign ownership of mineral or oil resources, but do allow private sector firms to participate in refineries and distribution networks, as well as sign profit-sharing contracts with state oil giant Pemex and the Federal Electricity Commission. The reforms include a revised tax regime for Pemex, the world’s fifth-leading oil producer, and its reorganization into two subsidiaries.
Mexico’s oil production has risen recently to 2.5 million barrels/day (b/d) and is expected to reach 3 million b/d by 2018.
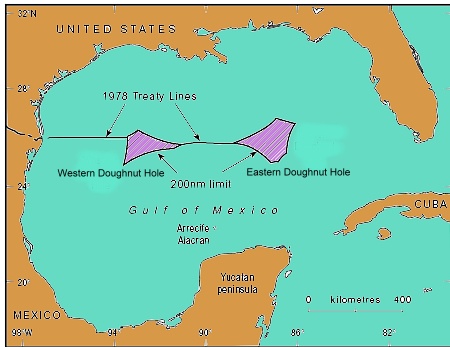
The Mexico-USA Transboundary Hydrocarbons Agreement (THA) has been approved by senators in Washington. The accord allows both countries to explore and develop crude reserves that straddle their exclusive economic zones in the Gulf of Mexico. It establishes “an environmentally safe and responsible framework to explore, develop, and share revenue from hydrocarbon resources that lie in waters beyond each country’s exclusive, economic zones,” according to White House National Security Council spokesperson Caitlin Hayden.
The two “doughnut holes” where Mexican and US Exclusive Economic Zone claims overlap
The American Petroleum Institute has hailed the possibility of Mexico-USA joint projects in the Gulf of Mexico. The reserves in the maritime boundary region are believed to total more than 170 million barrels of oil and 15 million metric tons of natural gas, according to the U.S. Department of the Interior’s Bureau of Ocean Energy Management.
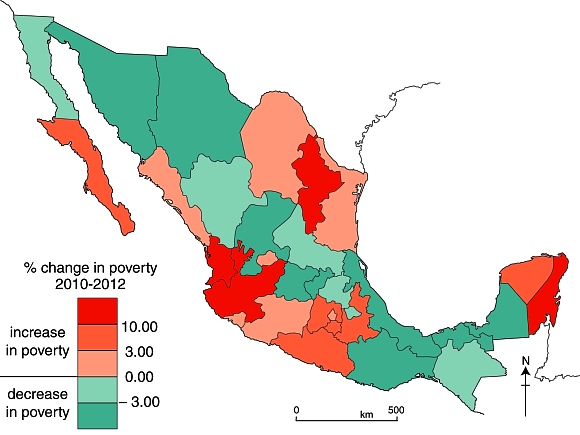
The total number of people living in poverty in Mexico continues to rise, though the poverty rate (as a percentage) remains roughly the same. According to Mexico’s National Political and Social Development Commission (Spanish language acronym: Coneval), the number of people in poverty has risen steadily for several years, much in line with Mexico’s rising total population. Coneval’s figures are based on a simple multidimensional poverty index, which considers the following criteria:
household income
access to education
access to food
access to health care
access to social services
housing quality
access to basic household services (electricity, water, drainage)
According to Coneval, 53.3 million Mexicans (45.5% of the total population) were living in poverty in 2012, compared to 52.8 million (46.1% of the then population) in 2010 and 48.8 million Mexicans (44.5%of the population) in 2008.
Note that poverty statistics prior to 2008 in Mexico were generally based purely on income levels. From 2008, this method was replaced by a multidimensional index. The precise details of the index have been modified slightly since that time, making exact comparisons between 2012 and 2008 more problematic.
While the precise numbers are subject to debate, mainly due to differing definitions of what constitutes “poverty” and how it can be measured, the trend revealed by the Coneval numbers is supported by the Economic Commission for Latin America and the Caribbean (ECLAC) in its “Social Panorama of Latin America 2013“, published in December 2013. The ECLAC report found that Mexico is one of a very few countries where poverty levels rose between 2011 and 2012, from 36.3% of the population to 37.1%, according to its definition.
The dire situation in Mexico compares to a slight decrease in poverty in most larger Latin American countries, including Venezuela, Ecuador, Brazil, Peru, Argentina and Colombia.
In absolute terms, according to ECLAC, 164 million people were found to be living in poverty in Latin America, about 57.4 million (35%) of them in Mexico.
Change in poverty rates in Mexico, 2010-2012. Credit: Geo-Mexico; all rights reserved. Data: Coneval
The map shows the Coneval data for changes in the poverty rate between 2010 and 2012 by state. It appears that poverty levels increased in many of Mexico’s more prosperous areas and in the longer established industrial areas, as well as in almost all areas where tourism is important. Poverty decreased in some of Mexico’s more rural, and generally poorer, states.