Search Results : jalisco

Mexico’s Volcanic Axis

 Excerpts from Geo-Mexico  Comments Off on Mexico’s Volcanic Axis
Apr 192012
 

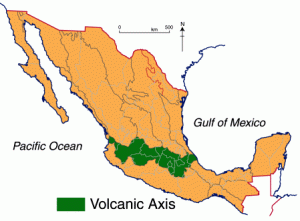
Mexico’s active seismic zones have created numerous volcanoes, many of which are still active. Virtually all the country’s active and recently dormant volcanoes are located in a broad belt of high relief which crosses Mexico from west to east: the Volcanic Axis (see map).

volcanic-axisAltitudes in this region vary from a few hundred to several thousand meters. The principal peaks are shown on the map. They include many of Mexico’s most famous mountains, such as Popocatepetl and Iztaccihuatl, near Mexico City; Pico de Orizaba, Mexico’s highest peak; Paricutín, the only completely new volcano in the Americas in recent times; and Colima, considered the most active at present. Many of the volcanoes are surprisingly young. For instance, a study using Carbon‑14 dating on the palaeosols (ancient soils) under 12 volcanoes in the Toluca area yielded ages ranging from 38,600 to 8400 years before present.

It is unclear precisely why this broad belt of Mexico should be so active. Elsewhere in the world all major tectonically active areas have been linked in terms of their location to the margins or meeting‑zones of tectonic plates. Some Mexican geologists believe that Mexico’s Volcanic Axis is a rare example of activity associated with a gently dipping plate margin, one where the edge of the Cocos plate is subsumed, but at only moderate gradient, beneath the North American plate.

Almost all the volcanic activity in this zone has taken place in the last 25 million years, from the upper Oligocene period, through the Miocene and Pliocene and up to Recent. Two distinct periods of activity are recognized by some geologists. The first, in the late Oligocene and early Miocene, produced volcanic rocks often found today tightly folded by later earth movements. The second, responsible for all the major composite cones as well as dozens of ash and cinder cones, started in the Pliocene and continues today.

Erosion has had relatively little time to work on these “new” volcanic peaks, some of which are still developing. As a result, this region includes Mexico’s highest mountains, reaching over 5500 m or 18,000 ft.

Thick, lava-rich volcanic soils make this one of the most fertile areas in North America. Though the relief is very rugged, this area has supported relatively high population densities for hundreds of years, including the current large metropolitan areas of Mexico City, Guadalajara and Puebla. Legacies of previous volcanic activity are found in craters, mud‑volcanoes, geothermal activity, and the numerous hot springs (and spa towns) scattered throughout the Volcanic Axis.

Related posts:

Greenpeace demands action to clean up Mexico’s surface waters

 Mexico's geography in the Press  Comments Off on Greenpeace demands action to clean up Mexico’s surface waters
Apr 052012
 

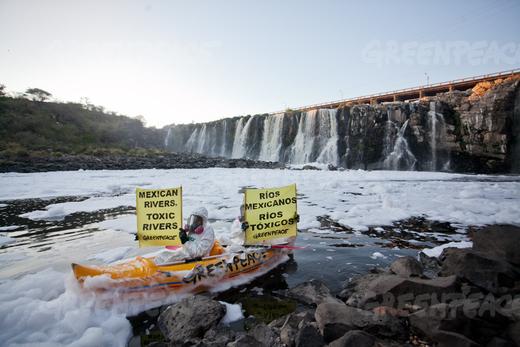
Greenpeace activists chose the Juanacatlán Falls (“The Niagara of Mexico”) for their latest protest to call attention to the poor quality of Mexico’s rivers and lakes. They cited government statistics that show 70% of Mexico’s surface water is contaminated. Most of the pollution comes from industrial dumping, rather than municipal sewage.

It is hard to imagine a better choice. The activists, clad in protective clothing and wearing masks to avoid inhaling toxic gases, paddled kayaks into the River Santiago immediately below the malodorous falls and unfurled banners with slogans such as “Mexican rivers, toxic rivers” (see image).

Greenpeace activists at El Salto de Juanacatlán, 22 March 2012. Photo: Greenpeace.

The activists called on the government to commit to a policy of zero dumping of toxic substances into rivers and lakes by 2020, with sanctions for actions leading to pollution and its effects.

In a coordinated action, thirty NGOs in Jalisco announced the creation of the “Broad Front in Defense of Water and Against Privatization ”, demanding actions towards a fully sustainable use of water. They asked government to take the lead in cleaning up the Santiago River and provide urgent medical attention for residents of communities affected by its high level of pollution (see this blog post). They also called for an end to the privatization of water services.

José Luis Luege, the head of Mexico’s National Water Commission (Conagua), the government body overseeing all Mexico’s water resources, recently presented a portfolio of programs for the country’s 13 water regions which are designed to make Mexico’s water usage sustainable.

Conagua calculates that Mexico currently uses 78.4 million cubic meters of water a year. Of this amount, 66.9 billion cubic meters is taken from surface and underground sources (and is fully sustainable), while about 11.5 billion cubic meters come from the unsustainable use of aquifers, where the rates of abstraction exceeds replenishment. The new programs are designed to reduce and eventually end unsustainable aquifer use, replacing it by a mixture of water-saving programs and by building the necessary infrastructure to obtain more water from sources believed to be fully sustainable.

Related posts:

Mexico has more World Heritage sites than any other country in the Americas

 Other  Comments Off on Mexico has more World Heritage sites than any other country in the Americas
Mar 172012
 

The status of World Heritage site is a UNESCO (United Nations Educational, Scientific and Cultural Organization) denomination. The status is conferred on selected sites under the terms of “The Convention Concerning the Protection of the World Cultural and Natural Heritage”, adopted at UNESCO’s 17th General Conference in November 1972 and subsequently ratified by 189 member states.

Nations were invited to submit their proposals for any cultural or natural sites that they considered “of outstanding universal value”, and therefore eligible for inclusion on the World Heritage list. All proposals have to be approved by a special UNESCO World Heritage Committee.

The attraction of having a site classified as a World Heritage site is that it affords extra possibilities for obtaining technical co-operation in matters relating to conservation, for international assistance for research, training and equipment, and for emergency assistance in the event of damage due to specific natural or man-made disasters. All these sites are also valuable as cultural or environmental tourism destinations.

The list was first published in 1978, at which time it mainly featured European sites. Since then, regular additions have been made. As of March 2012, the list includes 936 locations in 153 member states. Of these sites, 725 are considered to have cultural significance, 183 to have natural importance and there are also 28 which share both cultural and natural value.

Mexico has 31 sites on the list, considerably more than any other country in the Americas. For example, the U.S. has 20 (together with a share of a 21st that straddles the border with Canada), Brazil 17 (as well as one jointly held with Argentina), Canada 14 (plus the joint U.S.-Canada site) and Peru 11.

Worldwide, only five countries have more World Heritage sites than Mexico. Four of these countries are in Europe: Italy, Spain, Germany and France. The other country is China.

Mexico’s existing World Heritage sites

Date added to list  – Name of site (state in brackets)

1987 Sian Ka’an biosphere reserve (Quintana Roo)
1987 Pre-Hispanic city and national Park of Palenque (Chiapas)
1987 Historic Center of Mexico City and Xochimilco (Mexico D.F.)
1987 Pre-Hispanic city of Teotihuacan (State of Mexico)
1987 Historic Centre of Oaxaca and archaeological site of Monte Alban(Oaxaca)
1987 Historic Centre of Puebla (Puebla)
1988 Historic town of Guanajuato and Adjacent Mines (Guanajuato)
1988 Pre-Hispanic city of Chichen-Itza (Yucatán)
1991 Historic Centre of Morelia (Michoacán)
1992 Pre-Hispanic city of El Tajin (Veracruz)
1993 Whale Sanctuary of El Vizcaino (Baja California)
1993 Historic Centre of Zacatecas (Zacatecas)
1993 Rock Paintings of the Sierra de San Francisco (Baja California)
1994 Earliest 16th-Century monasteries on the slopes of Popocatepetl (Morelos)
1996 Prehispanic town of Uxmal (Yucatán)
1996 Historic Monuments, Zone of Querétaro (Querétaro)
1997 Hospicio Cabañas, Guadalajara (Jalisco)
1998 Historic Monuments, Zone of Tlacotalpan (Veracruz)
1998 Archeological Zone of Paquimé, Casas Grandes (Chihuahua)
1999 Historic fortified town of Campeche (Campeche)
1999 Archaeological Monuments, Zone of Xochicalco (Morelos)
2002 Ancient Maya City and biosphere reserve of Calakmul (Campeche)
2003 Franciscan Missions in the Sierra Gorda (Querétaro)
2004 House and Studio of Luis Barragán (in Mexico City)
2005 Islands and protected areas of the Gulf of California
2006 Agave landscape and old tequila-making facilities in Amatitán, Arenal and Tequila (Jalisco)
2007 Central University City Campus of the Universidad Nacional Autónoma de México (UNAM) (Mexico City)
2008 Monarch Butterfly Biosphere Reserve (Michoacán and State of México)
2008 San Miguel de Allende and the Sanctuary of Jesús de Nazareno de Atotonilco (Guanajuato)
2010 Camino Real de Tierra Adentro, the 2,900 kilometer historic route linking Mexico City to Santa Fe in New Mexico
2010 Prehistoric caves of Yagul and Mitla in the Central Valley of Oaxaca

Mexico’s proposed World Heritage sites:

Mexico has formally proposed numerous additional sites for World Heritage Status. The applications are coordinated by the National Anthropology and History Institute (Instituto Nacional de Antropología e Historia), better known by its Spanish acronym INAH. Proposals include:

1.  Historic town of San Sebastián del Oeste (Jalisco)
2. Tule (ahuehuete) tree of Santa María del Tule (Oaxaca)
3. Zempoala aqueduct, a project of Padre Tembleque (Hidalgo and State of Mexico)
4. Monterrey’s old industrial facilities, including a foundry, brewery and glassworks (Nuevo León)
5. The Aguascalientes railroad station and residential complex (Aguascalientes)
6. The Museo Casa Estudio Diego Rivera and Frida Kahlo (Mexico D.F.)
7. Ludwig Mies van Der Rohe and Félix Candela’s industrial buildings, including the offices of Bacardí y Compañía (State of Mexico)
8. Historic city of San Luis Potosí (San Luis Potosí)
9. Chapultepec Woods, Hill and Castle (Mexico D.F.)
10. Historic town of Alamos (Sonora)
11. Pre-Hispanic city of Cantona (Puebla)
12. The church of Santa Prisca in Taxco (Guerrero)
13. The former Jesuit college in Tepotzotlán (State of Mexico)
14. The churches of the Zoque province (Chiapas)
15. The pre-Hispanic city of Chicomostoc-La Quemada (Zacatecas)
16. Archaeological monuments, zone of Mitla (Oaxaca)
17. Cuatrociénegas flora and fauna reserve (Coahuila)
18. Franciscan convent and Our Lady of the Assumption cathedral in Tlaxcala (Tlaxcala)
19. Historical town of the Royal Mines of Cosala (formerly known as the Royal of the Eleven Thousand Virgins of Cosala) (Sinaloa)
20. Huichol Route used by Huichol Indians through their sacred sites to Huiricuta (San Luis Potosí) (sometimes spelt as Wirikuta)
21. The former textile factory La Constancia Mexicana and its housing area (Puebla)
22. The Lacan-Tún—Usumacinta region (Chiapas)
23. The Banco Chinchorro Biosphere Reserve(offshore in Quintana Roo)
24. The El Pinacate and the Great Altar Desert Biosphere Reserve (Sonora)
25. The Selva El Ocote Biosphere Reserve (Chiapas)
26. Sotáno del Barro, a 450-meter-deep sinkhole (Querétaro)
27. Tecoaque archaeological site (Tlaxcala)
38. Valle des Cierges, including Montevideo Canyon (Baja California)

Not all sites are accepted. For instance, Mexico’s rejections include the Lake Pátzcuaro region, in the state of Michoacán, and the El Triunfo nature reserve.

Mexicans are justly proud of their nation’s history and culture, and have always been prepared to share them with visitors. By getting so many locations on UNESCO’s list of World Heritage sites, the country is reaffirming its commitment to trying to ensure that its cultural and natural treasures are well protected for future generations. Any of the places mentioned in this article is well worth visiting and exploring. In some cases, it is possible to construct fascinating “itineraries” combining several of the sites in a single trip.

Bear in mind, though, that there are also numerous attractions not yet listed as World Heritage sites that probably deserve to be included in the future. For starters, how about Paricutin Volcano, one of only a handful of new volcanoes to appear on land in historic times? Or how about the Copper Canyon region, with its grandiose scenery and indigenous Tarahumar population?

For more information:

Related articles:


Mar 052012
 

In a previous post–The development of Huatulco, the tourist resort in southern Oaxaca–we looked at how the tourist resort of Huatulco was created by Mexico’s National Tourism Development Fund (Fonatur) on a series of small bays in the state of Oaxaca. Clearly, this development was very much “top-down” and it has been widely criticized from many distinct points of view. From a geographical perspective, the most important criticisms have arisen from researchers such as Evelinda Santiago Jiménez and David Barkin, co-authors of a short article entitled “Local Participation and Sustainability: a study of three rural communities in Oaxaca, Southern Mexico.”

Their view is that government programs, such as Huatulco, “are generally conceived for areas where there are resources that can be transformed into commodities”. In the case of Huatulco, this means that “access to public services, such as potable water, is designed to satisfy the demands of the visitors and affluent local service providers, while the majority suffer from inadequate supplies and must accept the conditions imposed on them.” Santiago Jiménez and Barkin see this as “a new form of colonization, implemented in the name of modernity to expropriate communal lands with minimal guarantees and compensation; a process of excluding local peoples; a way to subordinate the local inhabitants…; and a process than causes harm to the environment.”

The article by Santiago Jiménez and Barkin appears in a book entitled Nature’s Revenge: Reclaiming Sustainability in an Age of Corporate Globalization (University of Toronto Press/Garamond 2006). This book, which in its own words, “proposes a radical definition of sustainability, reclaiming the word from the rhetoric typically used by corporations and governments to facilitate unrelenting economic growth and the notion of ‘business as usual'”, is well worth reading.

The authors argue for adopting a “commons”-based approach, where the term “commons” is understood to include not only the idea of commonly-held or shared rights and property (such as water, air, soil) but also the “social commons” comprised of community knowledge and culture. In stressing “the complex interrelations that exist at local, regional, national, continental, and global levels of human organization”, the authors critique advocates of “localism” and argue that “there can be no simple solution confined to one particular scale of action.”

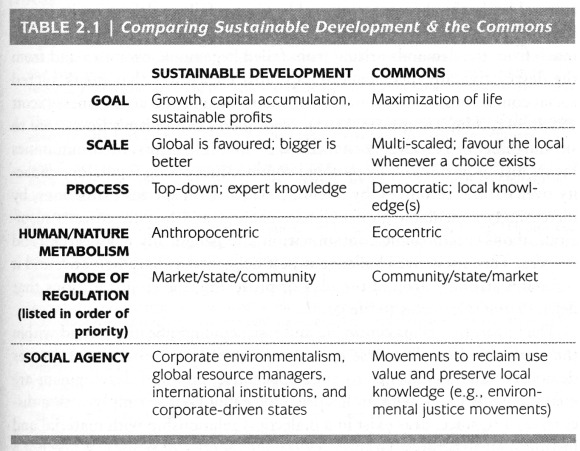
A table in Chapter Two (Who cares about the Commons? by Josée Johnston) summarizes the key differences between sustainable development (as used by corporations and governments) and the commons-based approach favored by the book’s authors:

Table 2.1 of "Who cares about the Commons" by Josée Johnston.
Table 2.1 of “Who cares about the Commons” by Josée Johnston.

It is an example of this commons-based approach that Santiago Jiménez and Barkin examine in their chapter. They analyze an alternative, locally initiated project, based on the Integrated Development of Natural Resources (Administración Integral de los Recursos Naturales, AIRN), which stands in sharp contrast to Fonatur’s “top-down” development model. The AIRN approach recognizes that local communities have a symbiotic relationship with their surrounding natural environment that is “crucial for mutual survival”. It also recognizes that the community-environment links are dynamic, not static, and will change or evolve with time as the community develops.

AIRN proposals aim, essentially, to speed up this development process, helping to find new productive projects for the communities while managing ecosystems effectively and sustainably. The success of AIRN development projects relies on an active participation by the local community to identify issues, opportunities and ways to progress. It is crucial that the local people are equal partners in the decision-making process.

In the Huatulco area, the Center for Ecological Support (Centro de Suporte Ecológico, CSE), an NGO, adopted an AIRN approach to devise appropriate strategies to reverse the damage done to water resources by the construction and expansion of Huatulco tourist resort, which had destroyed forest cover, reduced infiltration and abstracted water from the aquifer that underlies the Copalita River. The CSE proposed a reforestation program to actively regenerate (not just protect) the forests throughout the basin, including parts of the Southern Sierra Madre (Sierra Madre del Sur). At the same time, the CSE helped local inhabitants to explore new (alternative) sources of employment and income based in their communities, which offered them a viable option to abandoning their land and accepting menial low-paid  jobs in the tourist resort or elsewhere.

Santiago Jiménez and Barkin looked at three small villages that had participated in the AIRN proposals made by the CSE: Santa María Xadani, Santa María Petatengo and El Achiote. Each village had participated in different ways, and with varying degrees of success. Close familial ties in Petatengo, for example, ensured more community support than in Xadani where internal divisions reduce social cohesion. El Achiote is a small “rancho” of 14 families, all of whom participated in the reforestation project. The families also combine to carve and paint the colorful Oaxacan whimsical wooden figures known as “alebrijes”. The settlement gained electricity service in 2000 and telephone service in 2001. Sadly, a combination of circumstances led to many local inhabitants migrating away from the area in search of better incomes and the CSE was forced to suspend its operations.

The authors point out that development plans have to take account of three very different concepts of time. The local communities in this region view time as somewhat flexible, preferring to make decisions by consensus, rather than in order to meet any deadline. Organizations providing funding for projects see time in terms of deadlines and financial commitments. Local and state governments view time in terms of political cycles, with a project having more chance of success if it is launched early on in an administration’s term. Santiago Jiménez and Barkin also emphasize the importance of projects having an effective mediator (as the CSE proved to be) “capable of balancing the rhythms of Western culture, of nature, and of traditional culture”.

Mexico badly needs more examples of successful mediators, particularly where large scale tourism projects are concerned.

Related posts:

Recent geographic trends in Mexico’s drug violence

 Other  Comments Off on Recent geographic trends in Mexico’s drug violence
Feb 112012
 

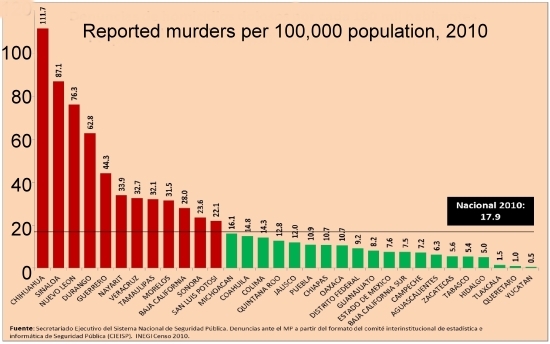
Drug related violent deaths during the first nine months of 2011 increased by about 13% compared to 2010.  Data released by the Office of the President  in January 2012 indicate that from January through September 2011 Mexico had a total of 12,903 drug war deaths. This is a rate of about 15.3 per 100,000 people per year [2011 rates were adjusted because data are available for only the first nine months of the year] compared to 13.6 in 2010 and 7.55 in 2009 [“Mexican drugs war murders data mapped”]. While the rate of increase declined significantly in the past two years, still drug violence is increasing rapidly.

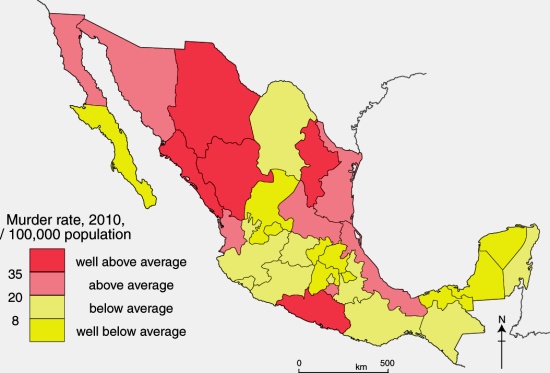
The geographic pattern of drug violence is still mainly concentrated in northern border states and some western states. Chihuahua was still the most violent state with 2,289 deaths in 2011 (Jan-Sept) for a rate of 90 deaths per 100,000 per year.  Other states with high rates were Guerrero (61), Durango (58), Sinaloa (53), Tamaulipas (45), Nayarit (42), Nuevo León (33), and Coahuila (28). Note that four of these states are along the border and four are in western Mexico.

At the other end, Yucatán had only one death for a rate of 0.07. Other states with low rates were Tlaxcala, 0.8; Puebla, 1.22; Querétaro, 1.24; Campeche, 1.62; Chiapas, 1.73; Hidalgo, 1.75; and the Federal District (Mexico City), 1.83. It is very interesting that the drug war death rate in the capital city was one of the lowest in the country and less than one eighth the national. A future post will investigate drug war death rates in Mexico City.

Among border states, drug war death rates decreased significantly for the western states. Baja California was down 38%; Sonora down 36%, and Chihuahua down 31%. Before 2010, Baja California and Sonora had death rates over twice the national average largely because of high death totals in Tijuana and Nogales. However for 2011 the rates for Baja California and Sonora were 31% and 22% below the national average. The worst drug violence in these two northwestern states might be a thing of the past.

The eastern border states all suffered increases. Coahuila was up 99% and Nuevo Leon was up 143%. Both now have death rates over twice the national average. Tamaulipas’ already high rate of 37 in 2010 increased 22% to 45, almost three times the average. Clearly the battleground of drug cartel clashes along the border has shifting to the east.

Violence is up in some western states where it already was quite high. The rate in Guerrero increased 80% to 60 deaths per 100,000 people, four times the national average. Nayarit suffered an increase of 21% to a rate 42, almost three times the average. Smaller, but still significant, increases were registered in Colima, up 24%, and Michoacán, up 40% putting these two states above the average. On the other hand, the some of the violent non-border states experienced declines. The rate in Sinaloa declined 19%; but with a 2011 rate of 53 it is still three and half times the average. Morelos was down 18% putting it just above the average.

Drug violence increased very rapidly in some non-border states that were relatively peaceful through 2010. The drug war death rate in Zacatecas increased 361% while that in Veracruz was up 302%. While these increases are alarming, these two states still had rates below the national average in 2011. Jalisco suffered an increase of 40%, but its 2011 death rate of 11 was still less than three-fourths of the average. The State of México was up 24%, but its rate was still less than a third the average.

In conclusion, drug violence in Mexico continued to increase in 2011. The violence appears to be mostly concentrated in a wide geographic arc formed by the border states and those in western Mexico. Within this region some areas are suffering rapid increases while drug violence is declining in other places.  It is not clear how this pattern will change in the years ahead. To get a clearer picture of the current pattern, in future posts we will investigate trends in drug violence among Mexico’s 2,458 municipalities.

Feb 082012
 

It is becoming harder and harder to keep up with the ever-changing landscape of drug cartel territories. As the government crack-down leads to more and more high-profile arrests, some cartels are struggling to reorganize and lose ground (literally) as rival groups step in to take control. This has resulted in drug-related violence in the past year spreading to new areas, accounting for the serious incidents reported in cities such as Guadalajara and Acapulco and in several parts of the state of Veracruz, even as violence diminishes in some areas where it was previously common. (The patterns of drug-related violence are analyzed in depth in several other posts tagged “drugs” on this site).

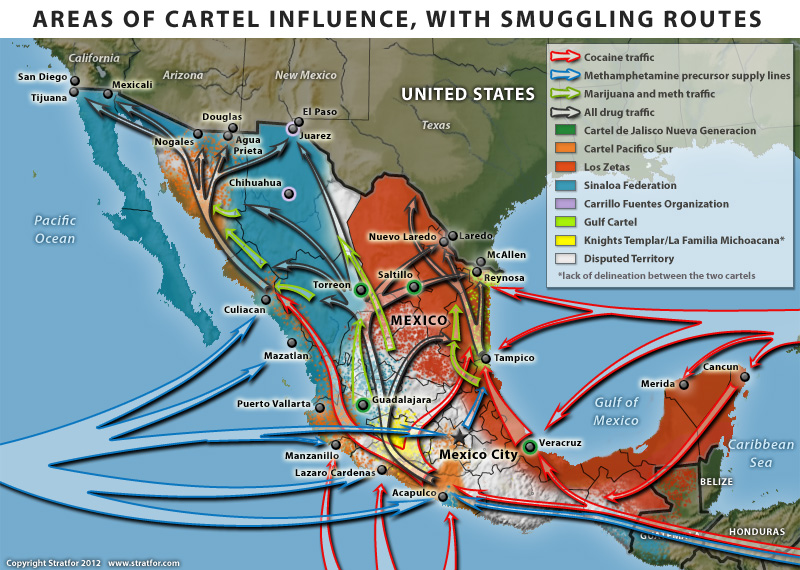
Who are the main players?  (February 2012)

According to security analysts Stratfor in their report entitled Polarization and Sustained Violence in Mexico’s Cartel War, polarization is under way among Mexico’s cartels. Smaller groups have been subsumed into either the Sinaloa Federation, which controls much of western Mexico, or Los Zetas, which controls much of eastern Mexico.

The major cartels are:

  1. Los Zetas, now operating in 17 states, control more territory than the Sinaloa Federation, and are more prone to extreme violence. They control much of eastern Mexico.
  2. Sinaloa Federation, formerly the largest cartel, currently in control of most of western Mexico. They have virtually encircled the Juárez Cartel in Cd. Juárez. Their production of methamphetamine has been disrupted by numerous significant seizures of precursor chemicals in west coast ports, including Los Mochis and Mazatlán (Sinaloa), Manzanillo (Colima), Puerto Vallarta (Jalisco) and Lázaro Cárdenas (Michoacán). As a result, the Sinaloa Federation appears to have moved some of its methamphetamine production to Guatemala.
  3. Juárez Cartel, now largely limited to Cd. Juárez
  4. Tijuana Cartel, now dismantled and effectively a subsidiary of the Sinaloa Federation
  5. Cartel del Pacífico Sur; weak, and competing with Zetas in central Mexico states of Guerrero and Michoacán
  6. Gulf Cartel, which still has important presence along Gulf coast, but weakened due to infighting and conflicts with Los Zetas.
  7. Knights Templar (Los Caballeros Templarios) comprises remnants of La Familia Michoacana (LFM), which is now almost defunct. Other former LFM members joined the Zetas.
  8. Independent Cartel of Acapulco is small and apparently weakened.

Alongside these cartels, three “enforcer” groups of organized assassins have arisen: the Cártel de Jalisco Nueva Generación (enforcers for the Sinaloa Cartel), La Resistencia (Los Caballeros Templarios) and La Mano con Ojos (Beltrán Leyva).

Cartel areas and drug routes in Mexico

Cartel areas and drug routes in Mexico. Copyright Stratfor. Click map for enlarged version

Turf wars

Drug violence is largely concentrated in areas of conflict between competing cartels. The major trouble spots are Tamaulipas (Gulf Cartel and Zetas); the states of Durango, Coahuila, Zacatecas and San Luis Potosí (Sinaloa Cartel and Zetas); Chihuahua (Juarez Cartel and Sinaloa Cartel); Morelos, Guerrero, Michoacán and State of México (Cartel del Pacífico Sur, aided by Zetas, against Los Caballeros Templarios).

One possible strategy (for the government) would be to stamp out all smaller groups until a single major group controled almost all the trade in drugs. At this point, so the argument goes, incidental violence against third parties would drop dramatically. Such a simplistic approach, however, fails to tackle the economic, political and social roots of narco-trafficking.

Meanwhile, there are some signs that Los Caballeros Templarios, the breakaway faction of LFM, based in the western state of Michoacán, wants to transform itself into a social movement. This is presumably why it has distributed booklets in the region claiming it is fighting a war against poverty, tyranny and injustice.

Mapping remittance flows to Mexico, a practical exercise

 Books and resources, Teaching ideas  Comments Off on Mapping remittance flows to Mexico, a practical exercise
Jan 262012
 

Looking for a practical exercise about migration and remittance flows to challenge your students?

Remittances (the funds sent by migrant workers back to their families) are a major international financial flow into Mexico. Remittances bring more than 20 billion dollars a year into the economy, an amount equivalent to 2.5% of Mexico’s GDP. On a per person basis, Mexico receives more worker remittances than any other major country in the world. An estimated 20% of Mexican residents regularly receive some financial support from relatives working abroad. Such remittances are the mainstay of the economies of many Mexican families, especially in rural areas of Durango, Zacatecas, Guanajuato, Jalisco and Michoacán.

Two data tables [see link]  included in the World Bank Working Paper by Raúl Hernández-Coss, referred to in several previous posts, offer an ideal starting-point for practical mapping and analysis exercises for students. (The data is from 2004 but we are more interested in general patterns than precise values). The data tables are here:

A ready-made printable base map, showing the state boundaries of Mexico and USA, can be found here:

Suggested mapping exercises:

1. Which US areas have most Mexican migrants?

Use Column 2 (Mexican nationals living in this jurisdiction) of Table VI.A.1 and draw proportional circles on a base map to show which areas have most migrants. [To draw circles where the area of each circle is in direct proportion to the number of Mexican nationals, the first step is to calculate the square root of each number. These square roots are then used as the basis for working out the diameter (or radius) of the circle you draw for each location. The area of each circle is then proportional to the number of migrants. Remember to choose the most appropriate scale for the circles, so that it is easy to compare places. (If you draw very small circles, or super-large circles, they will be difficult to compare!)

2. Which US areas send the highest value of remittances back to Mexico?

Use column 4 of Table VI.A.1 to show the value of total “annual remittance flows” on a base map. You may be able to superimpose this information on the same base map you drew for Q1 which would make it very easy to see if the areas with most Mexican nationals send the most remittances back to Mexico each year. Can you see any anomalies on your map, either where an area sends far more remittances back than might be expected from the number of migrants, or where an area sends only a small value of remittances back despite having a very large number of Mexican nationals?

3. How does the “average remittance” (column 5 of Table VI.A.1 vary?

Use the available figures to see if you can identify any pattern to which areas send relatively large remittance payments, and which send much smaller average payments.

4. Where do all the remittance payments go?

Level One: Use the information from Table VI.A.2 to draw a map with arrows showing the largest single flows from each area in the USA to their corresponding state in Mexico.

Level Two: Work out the dollar value of the main remittance flows, by using the % figures given for some areas in Table VI.A.2 and their corresponding total annual remittance values from Table VI.A.1. (eg the value of the Los Angeles to Jalisco flow is 26% of $7,886.3 million). Then map the ten largest flows using flowlines (arrows where the width of each arrow is proportional to the value of remittances).

Look at the map or maps created and see if you can identify any patterns. If you can describe a pattern, then also look to see if you can find any anomalies, and try to explain your findings.

Related posts:

The geography of wildfires in Mexico: the disastrous wildfire season of 2011

 Other  Comments Off on The geography of wildfires in Mexico: the disastrous wildfire season of 2011
Jan 212012
 

In the past 20 years, wildfires have destroyed 47,000 square kilometers (18,000 sq. mi) in Mexico, equivalent to five times the area of all sections of Mexico City’s Chapultepec Park, the largest urban park in Latin America. The average fire in Mexico affects 32 hectares (80 acres); this figure has not changed significantly in recent years, even though the incidence of fires has increased somewhat due to a combination of climate change and an increase in the number of people living on the margins of forested areas. The National Forestry Commission (Conafor) says that 99% of Mexico’s forest fires are caused by human error, and only 1% are due to natural causes such as lightning strikes.

It generally takes about 30 years to rehabilitate forest areas ravaged by fire, with reforestation costing up to $2400/ha.

Wildfires are not entirely bad. For example, they help regenerate grassland areas, especially, with fresh young plants. On the other hand, in addition to protecting the existing vegetation, stopping wildfires when they occur helps to preserve soil structure and prevents additional emissions of CO2 from the burning of more plant material. At a national level, it is estimated that fires result in the erosion of 86 million metric tons of soil a year.

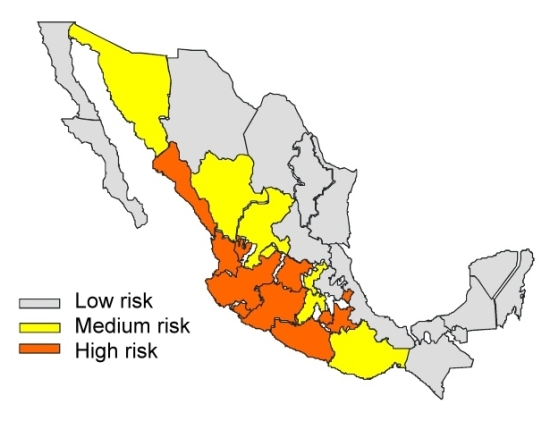
In a 2009 study, Conafor used 17 variables to identify the areas of the county with the highest risk of wildfires. Three broad areas accounted for the 900,000 square kilometers identified as having either a “medium” or “high risk” for wildfires:

  • i. Yucatán Peninsula, Chiapas, Oaxaca and Guerrero
  • ii. Central Mexico – Veracruz, Tlaxcala, Puebla, México, Michoacán, Jalisco and the Federal District. This area has more fires than any other because local populations often use fire to clear fields before planting.
  • iii. Baja California. This is the only area where the main fire season is in summer, from March to November. This is the rainy season in the remainder of Mexico, where the fire season corresponds with the winter dry season.

The first half of 2011 was an especially bad period for wildfires in Mexico, the worst for at least 30 years.

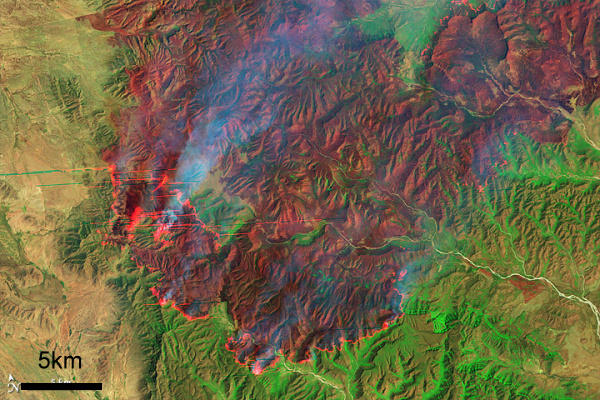
Coahuila wildfire, April 9, 2011 (Earth Observatory, Landsat-5)

Coahuila wildfire, April 9, 2011 (Earth Observatory, Landsat-5)

During the first half of 2011, serious wildfires devastated several areas of northern Mexico, with the states of Coahuila and Nuevo León being hardest hit. Other states badly affected included Durango, Chihuahua, Quintana Roo, Oaxaca, Puebla and Guerrero. More than 7,800 fires occurred, severely damaging a total area of 4100 square kilometers. 30 of Mexico’s 32 states were affected; only Tabasco and Baja California Sur escaped unscathed.

Conafor’s annual fire-fighting budget for the entire country is only 650 million pesos ($50 million dollars); the average annual area damaged by wildfires is only 2600 square kilometers, of which 500 square kilometers are forest. At the height of the 2011 fire season, more than 60 new fires were being reported each day, according to Conafor.

Coahuila

In the state of Coahuila, fires damaged 250 square kilometers in four weeks. It is believed that 50% of these fires were due to farmers losing control of deliberate burns. Farmers are supposed to have an adequate fire-suppression plan in place before setting a deliberate burn, but in practice this requirement is not enforced.

The main locations were La Sabina and El Bonito. Authorities were very slow to respond. Diana Doan-Crider, a wildlife biologist at Texas A&M University, has spent the past 25 years studying the Mexican black bear in the Serranía del Burro in Coahuila, an ecological corridor that runs parallel to the Eastern Sierra Madre. The area includes a large population of Mexican black bears. Doan-Crider claims that authorities completely ignored the first warnings and that their eventual response (two weeks after the first fires started) lacked adequate coordination. Many mother bears and their young cubs perished in the fires.

Firefighters in Coahuila had to cope with a spectacular but terrifying fire whorl or fire tornado

Nuevo León

In the neighboring state of Nuevo León, large swathes of ranching land were ravaged by fire. One rancher who lost more than 10,000 ha of cattleland was equally critical of the slow response time of firefighters who took more than two weeks to appear on the scene, by which time the fires had taken hold.

David Garza Lagüera had converted his 14,000 ha ranch into the Cumbres de Monterrey National Park, one of the key areas of bear habitat. The largest pines on his land were more than 150 years old. All were totally destroyed.

The worst damage was in Galeana, Montemorelos, Zaragoza, Aramberri and Mina. The area burned in Nuevo León in May 2011 was almost ten times the total area affected in the state for the whole of 2010.

Why was the 2011 fire season so bad?

To quote the Earth Observatory, “Lack of winter rain and frost left the plants dry and prone to fire. On top of that, the area has not burned for more than 20 years, during which time fuel built up. Thunderstorms and steady strong winds with gusts up to 110 km/h (70 mph) completed the formula for a dangerous, fast-moving wildfire.”

Ironically, the passage of Hurricane Alex in July 2010, which brought 1500 mm (60″) of rain to the Serranía del Burro, actually worsened the fire damage the following year. The rain from Hurricane Alex encouraged so much new growth in the final months of the rainy season that when it died back in the dry season, there was far more fuel available than usual for any wildfire that was sparked.

By the time the federal government declared a state of emergency, it was too late; the fires had already destroyed large areas of grassland, scrubland and forest. The emergency response when it finally arrived included help from the USA and Canada such as the specialist aerial Mars water-bombers stationed on Vancouver Island. The fires were only fully extinguished once the annual rainy season arrived.

As we now know, the disastrous fires of April-May 2011 were an early sign of Mexico’s worst drought for 70 years:

Jan 122012
 

The Mexican Attorney General’s Office has released data for narco-related homicides for the first nine months of 2011. The data show that 12,903 narco-related deaths occurred in that period. The 2011 figure is 11% higher than the number of narco-related deaths reported for the same nine months in 2010. Even in the absence of data for the last quarter of 2011, we can safely assume that the total number of drug-related deaths in Mexico since the start of the “drug war” in December 2006 now exceeds 50,000.

As we have stressed in previous posts about drug-related violence in Mexico, the data for January-September 2011 show that violence is heavily concentrated in certain parts of the country, with other regions (such as Baja California Sur, Oaxaca and the Yucatán Peninsula including Quintana Roo) remaining untouched.

Narco-violence, January-September 2011

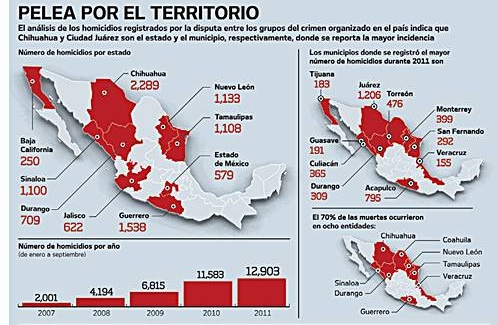
Narco-violence, January-September 2011 (El Universal)

As this graphic (original here) from Mexico daily El Universal shows, eight states (out of 32) accounted for 70% of all the homicides in the first nine months of 2011: Chihuahua, Guerrero, Nuevo León, Tamaulipas, Durango, Jalisco, State of México, Coahuila.

The ten municipalities with the highest number of homicides were Ciudad Juárez, Acapulco, Torreón, Monterrey, Culiacán, San Fernando, Durango, Mazatlán, Tijuana and Veracruz.
[* see comment below]

In all cases, it should be remembered that the data are for the total number of homicides and are not homicide rates (i.e. data adjusted for population size).

Jan 092012
 

Mexico’s 2010 census found that 961,121 individuals living in Mexico had been born outside the country. In 2000 there were only about half as many (492,617). The 2010 figure is less than 1% of Mexico’s total population of 112 million. (Compare Canada where 21% are foreign-born and USA where 13% are foreign born). Of the total number of foreign-born residents in Mexico, 76.6% were born in the USA. Sadly, INEGI has not released any information relating to the country of birth of current residents who were born in countries other than the USA.

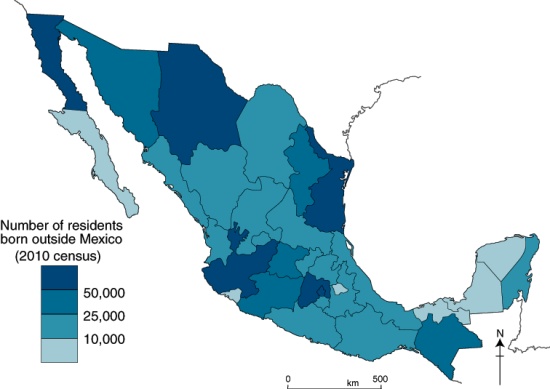
The map below shows the total number of foreign-born residents for each state.

Map of foreign-born residents of Mexico in 2010

Foreign-born residents of Mexico in 2010. Credit: Tony Burton/Geo-Mexico.

As can be seen on the map, the states with most foreigners are Baja California (about 123,000), Jalisco (84,000), Chihuahua (80,000), the Federal District (72,000) and Tamaulipas. The two states with fewest are Tlaxcala and Tabasco. (These are absolute numbers, and are heavily influenced by the relative size of each state).

Which states experienced the largest increases in foreigners between 2000 and 2010? The number of foreigners grew fastest in those states with relatively few foreigners in 2000, namely Hidalgo (up 402% over the decade), Tlaxcala (333%), Tabasco (281%), and Veracruz and Oaxaca (both with 272%).

Related posts:

The geography of the 2011 Pan American Games (Juegos Panamericanos)

 Mexico's geography in the Press  Comments Off on The geography of the 2011 Pan American Games (Juegos Panamericanos)
Jan 022012
 

The XVI Pan American Games were held from October 14–30, 2011 in Guadalajara (Jalisco) with some events held in outlying locations such as Ciudad Guzmán, Puerto Vallarta, Lagos de Moreno and Tapalpa. They were the largest multi-sport event of 2011. Some 6,000 athletes from 42 nations participated in 36 sports. The largest contingents of athletes (more than 500 in each case) came from host nation Mexico, Brazil, Argentina, the USA, Cuba and Canada.

Guadalajara is Mexico’s second city, a metropolitan area of almost five million people, the industrial and commercial hub of a region that is considered quintessentially Mexican, home to charrería (Mexican horsemanship), jarabe tapatío (Mexican hat dance), mariachi music, and tequila, the national drink.

This post looks at the impacts of the Pan American Games on the local economy.

How much investment was required to host the games?

The original budget for the Games was $250 million (dollars), but this ballooned to about one billion by the time of the Opening Ceremony. The security budget was $10 million, to pay 10,000 municipal, state and federal police, as well as elements from the Mexican army and navy, to patrol the streets surrounding the venues during the games.

How many visitors attended the Games?

The State Tourism Secretariat expected 800,000 visitors and spending of $75 million (dollars). Some government spokespersons claimed that between 1 and 1.5 million attended the games. However, a study released by the Guadalajara Chamber of Commerce found that 454,148 visitors came to Guadalajara during the games (305,177 from the state of Jalisco, and 148,971 from elsewhere). 83% (424,354) of visitors came “specifically for the Games”.

How many jobs were created?

The build-up to the games created some 50,000 new jobs. In addition, more than 6,000 volunteers, mainly students, were employed during the games.

How much were the media and TV rights worth?

1,300 media representatives attended the games. More than 750 television hours of sports were broadcast, with global digital media company Terra broadcasting the games live in 13 simultaneous high-definition online channels. The TV rights were worth $50 million.

How many sports venues were used?

There were 32 different venues used during the games. Billions of pesos were spent building 19 impressive new sports stadiums and complexes. Thirteen existing sports arenas in the Guadalajara metro area were rebuilt or extensively refurbished. The opening and closing ceremonies for the Pan American Games were held in a 48,000-seat local soccer stadium, the Omnilife Stadium (Estadio Omnilife), built in 2010 for the Guadalajara “Chivas” soccer team.

Facilities built specifically for the games included an iconic Aquatics Center (Centro Acuático), sponsored by Scotiabank, with two Olympic-size pools and seating up to 3,500 spectators, and a state-of-the-art gymnastics venue, sponsored by Nissan.
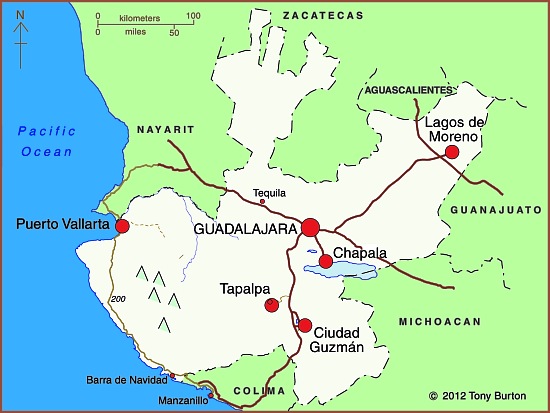
2011 Pan American games venues in Jalisco, Mexico

2011 Pan American games venues in Jalisco, Mexico

How did the games help regional development?

Several sports events were held at sites well away from the Guadalajara metro area. This helped promote a regional profile for the games. The five locations involved (see map) were:

  • Puerto Vallarta (beach volleyball, open water swimming, triathlon, sailing)
  • Lagos de Moreno (baseball)
  • Ciudad Guzmán (rowing, canoeing)
  • Chapala (water skiing)
  • Tapalpa (mountain biking)

How much did visitors to the games spend?

Local businesses reported sales up 7% during the period of the Games. The total games-related spending by visitors was estimated at $210 million (dollars). Hotel occupancy rates for the period of the games rose from 58.3% in 2010 to 76.4% during the games. The rate was 97% for the 5-star hotels in Guadalajara and Puerto Vallarta.

Even so, according to a local newspaper (The Guadalajara Reporter), local business owners were “underwhelmed” by the Pan American Games’ impact. Restaurants, bars, clubs, taxis and travel agencies all received fewer customers than anticipated. Local business owners said that “very few foreign tourists came for the games, while most spectators at the events were local citizens, athletes and their families, journalists and other games-affiliated personnel.” Business owners in Puerto Vallarta were reported to be “angry at the lack of publicity for the destination”.

Problems with the Athletes Village

The Pan American Athletes Village (Villa Panamericana) was built one kilometer outside Guadalajara’s western ring-road (Periférico) to house all 6,000 participants. The location is conveniently close to the Omnilife Stadium, site of the opening and closing ceremonies.

The Athletes Village has three-bedroom apartments, a central plaza, restaurant, gym, discotheque, chapel, swimming pool, theater and health clinic. The original plan was for the Village apartments to be sold after the Games for between $90,000 and $250,000 (dollars) each. However, the fate of the Athletes Village is still uncertain, because residents of the nearby (and long-established) Rancho Contento subdivision have taken the owners to court,  demanding that the Athletes Village be demolished since it has already caused irreparable damage to the local ecosystem.

Apart from some issues of housing density in this area, the main concern is that the village has inadequate provision for sewage. After the Games ended, local newspapers reported that faulty treatment plants had resulted in sewage being pumped out of the village on to land inside the nearby Primavera Forest biosphere reserve. Apparently, two of the Village’s treatment plants “collapsed” under the volume of wastewater generated, and partially-treated sewage had collected as open ponds. It is unclear if the sewage contaminated local subsoil and streams. After the Games, city officials closed the plants and fined the Athletes Village administrators. The administrators claim that the plants and Village had been designed to accommodate only 2500 to 3000 athletes, not the 6000 participants that were later housed there.

Conclusion

The lasting legacy of the games is a number of new hotels in Guadalajara, including hotels in the Westin and Riu chains, and a number of new or upgraded sports venues. In addition, many roads were repaved and numerous other beautification projects have helped improve Guadalajara’s urban fabric and infrastructure. The city’s main exhibition space (Expo Guadalajara) and the international airport have both been expanded.

The first obvious benefit of these improvements has been that the city (and its new Aquatics Center) have been chosen to host the 2017 World Swimming Championships.

Related posts:
Dec 172011
 

Mexico’s Magic Town (Pueblo Mágico) designation is given to inland destinations that offer a complementary tourism based on historic and cultural attributes. Mexico’s federal Tourism Secretariat has announced there will be 52 Magic Towns by 2012, when the promotional program is due to end. Mexico currently has 48 Magic Towns. Since our list earlier this year (see Mexico adds three more Magic Towns to its list) four more towns have been added to the select club. All are well worth visiting!

Magic Town #45: El Oro de Hidalgo (State of México)

The small town of El Oro (population about 6,000) is in the western part of the State of México, close to the state limit with Michoacán. It is a former mining town which was largely abandoned when its mineral reserves (gold) ran out. It has several very attractive old buildings and a state Mining Museum.

Magic Town #46: Xico (Veracruz)

Xico is located in the central part of Veracruz state, about 25 km from the state capital Xalapa, in an agricultural area known for tropical fruits and coffee. In the vicinity are the Texolo waterfalls, where the movie “Romancing the Stone” was filmed. Xico holds a lively annual fair every July, complete with colorful sawdust carpets and bull-running.

Magic Town #47: San Sebastián del Oeste (Jalisco)

San Sebastián del Oeste is another enchanting old mining town, founded in 1605, located in the rugged mountains which separate the interior valleys of central Jalisco from the Pacific Coast, at an altitude of 1500 meters (5,000 feet) above sea level. Local mines yielded a fortune in gold, silver and copper, before the town lapsed into quiet lassitude once the ore reserves were exhausted. It is amazing to think that all the salt used in the silver processing had to be brought on horseback over the mountains from a tiny primitive port called Puerto de las Peñas, at the mouth of the River Cuale, a port now known as… Puerto Vallarta!

San Sebastián del Oeste

San Sebastián del Oeste

Magic Town #48: Xilitla (San Luis Potosí)

The town of Xilitla is set in luxuriant rainforested mountains in San Luis Potosí. It is best known as the site of Las Pozas, Edward James’ surrealist jungle fantasy. To read more about Xilita, try the following articles on MexConnect:

Related posts:

The important but often overlooked state of Puebla

 Other  Comments Off on The important but often overlooked state of Puebla
Dec 022011
 

The interesting and important state of Puebla is often overlooked because it is overshadowed by nearby Mexico City. In fact the western state border of Puebla is within 35 kilometers of the eastern edge of the Federal District. The state of Puebla also may be overlooked because it is rather small in area, ranking only 21st among Mexico’s 32 states. On the other hand, its 2010 population of nearly 5.8 million ranks it 5th behind only Mexico State, the Mexico City Federal District, Veracruz and Jalisco.

Though small in size, Puebla is very diverse. The topography is rugged and elevations range from under 100 meters in the northeast to volcanoes  rising over 5,000 meters above sea level, both to the east (Orizaba – 5,636m) and west (Popocatepetl – 5,410m and Iztaccihuatl – 5,230m). These extremes in elevation give Puebla a very wide range of climates and ecosystems, from semi-tropical rainforests and grasslands to highland forests and alpine ice packs.

Almost inevitably, given its high population density (168.5 inhabitants/square kilometer), many of these ecosystems have been degraded. Several of the most attractive natural areas are now protected. They include the Izta-Popo Zoquiapán, La Malinche and Pico de Orizaba National Parks as well as the very large Tehuacán-Cuicatlán Biosphere Reserve, which has over 100 different mammal species, 16 of which exist nowhere else on the planet.

Puebla also has significant social and ethnic diversity. There are numerous wealthy people and upscale areas in Puebla City, which has the eighth highest 2005 Human Development Index (HDI) score among major Mexican cities, behind only Mexico City, Chihuahua City, Monterrey, Querétaro City, Cancún, Torreón and Cuernavaca. Most people are surprised it comes out ahead of Guadalajara and Zapopan.

On the other hand, the state as a whole is rather poor. Based on its relatively poor levels of infant mortality, literacy, school enrollment, and income levels, the state ranks 28th of 32 states in terms of 2008 Human Development Index. Puebla is tied with Michoacán and ahead of only Chiapas, Guerrero and Oaxaca[1]. It also ranks 28th in illiteracy which is over 10% (2010); however 96% of the 6 to 11-year-olds now attend school, and illiteracy for those between the ages of 15 and 25 is less than 3%. While 98% of homes now have electricity, over half of Puebla’s workers make less than $115 pesos ($8.20US) a day. Approximately two/thirds of the state’s population live below the Mexican poverty line. The state’s high level of poverty is partially due to its indigenous population of almost one million and the fact that almost 30% of its inhabitants live in rural areas, some of them quite remote.

The city of Puebla is the heart of a Metropolitan Area which extends across state lines to the city of Tlaxcala. Metropolitan Puebla-Tlaxcala is the country’s 4th largest urban area with a population over 3.1 million, but is overshadowed by Mexico City, the eastern edge of which is less than 30 minutes by expressway. In fact, some urban specialists suggest that these two major metropolitan areas may merge in the future. On the other hand, the mighty Popocatepetl and Iztaccihuatl volcanoes, both over 5,000 meters in height, lie directly between the two cities. The high speed expressway skirts around the north side of the volcanoes.

The city of Puebla has long had strategic significance. The city was initially established during the colonial period owing to its strategic location between Mexico City and Veracruz, the dominant port for shipments to and from Spain. Puebla was the country’s second largest city for more than three centuries up until the mid 19th century. The Mexico City-Puebla railway was completed in 1869, but the main line to Veracruz bypassed the city, which diminished its comparative advantage, and resulted in it dropping to fourth place, overtaken by Guadalajara and Monterrey.

The state’s historical importance is evidenced by numerous important military confrontations, including the massacre of Cholula (1519), Santa Ana’s siege of Puebla City (1845), American General Winfield Scott’s occupation (1845-48), the “Cinco de Mayo” battle of Puebla against the French (1862), the French victory in the Second Battle of Puebla (1863), and occupation by the Zapatistas during the Mexican Revolution. The state is the birthplace of four Mexican Presidents: Ignacio Comonfort (1855–1858), Juan N. Méndez (1876–1877), Manuel Ávila Camacho (1940–1946) and Gustavo Díaz Ordaz (1964–1970).

Despite the state’s relative poverty, industrial development has been significant and Puebla has become one of Mexico’s most industrialized states. Since colonial times Puebla has been an important center for the textile and ceramic industries. Much of Mexico’s famous talavera pottery is made in Puebla. Talavera came to Puebla from Talavera, Spain, which in turn had acquired it from Arab traders who originally brought it from China.

Since the mid 20th century Puebla has become a very important modern industrial area. The most important manufacturing activities are metals, chemicals, electronics, textiles and particularly motor vehicles. The Volkswagen plant in Puebla is one of the largest outside Germany. In July 2003 it produced the very last of the over 21 million old “Beetles” built by VW. The plant now produces New Beetles, Jettas and Boras that are exported worldwide. The motor vehicle assembly industry is supported by scores of automobile parts factories in the state.

Related articles:

Where are the wealthiest households in Mexico?

 Other  Comments Off on Where are the wealthiest households in Mexico?
Nov 102011
 

A recent publication from the public opinion research consultancy Mitofsky offers some insights into the distribution of different socio-economic groups within Mexico.

The Mitofsky study relies on the AMAI 10×6 system to tabulate the percentage of households in each state that fall into six distinct categories: A/B, C+, C, D+, D and E.

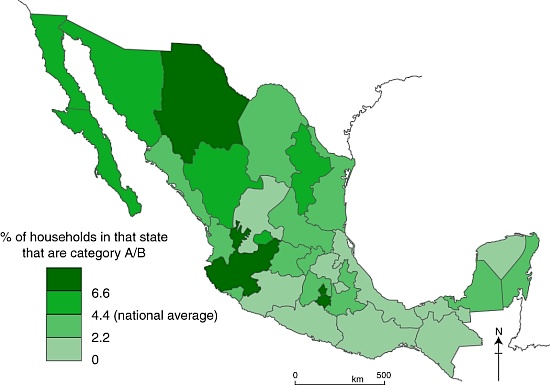
Across Mexico as a whole, 4.4% of households are categorized as A/B (the highest category, see map below), 12.3% as C+, 17.9% as C, 39.1% as D+, 21.6% as D and 4.7% as E (the lowest category).

The data show that, between them, four states–the Federal District (23.4% of all A/B households in Mexico), Jalisco (14.4%), State of México (9.3%) and Nuevo León (5.9%)– account for more than half of all the homes in this category in Mexico

The map shows how the incidence of A/B households (the highest socio-economic category) vary, state by state, across the country.

Distribution of highest socio-economic status households in Mexico.
Households in the highest socio-economic group in Mexico. (Geo-Mexico/Tony Burton; all rights reserved)

Do you live in an A/B household?

1. Housing characteristics:
– average of 6-8 rooms (often 3 bedrooms, 3 bathrooms) built of brick and/or concrete
– floors tiled, hardwood or stone; more likely to have carpets or rugs than lower categories
– most are owner-occupied, not rented

2. Sanitary Infrastructure
– connected to municipal potable water and sewer systems
– all have tub, shower, and water heater (usually using gas)
– two-thirds of these homes have water cisterns and pump to supply water tanks.
– some have air conditioning and/or central heating

3. Practical Infrastructure
– average 2 vehicles
– all have stoves, refrigerators and washing machines
– almost all have microwave ovens, blenders, toasters, coffee-makers and juice extractors

4. Communications and Entertainment Infrastructure
– almost all have fixed line telephones and cell phones
– most have 3 or 4 TVs and  satellite or cable TV
– all have DVDs and stereos/CD players; half have video game consoles
– average more than 1 computers per household; 75% connected to Internet
– many have memberships of private sports clubs and own a second home or time-share.
– more than 50% have traveled by air at least once in last 6 months, and most travel overseas at least once a year

5. Educational and Occupational Profile of Head of Family
– usually has a bachelor’s degree or higher
– work in medium or large companies, as directors, CEOs or other high-ranking professionals

6. Expenditures
– these households save more, but also spend more on education, entertainment, communication and vehicles
– food purchases account for only 7% of total expenditures, well below the average for the total population
– of these food purchases, the proportion spent on dairy products, fruit, and drinks is greater than lower categories

Questions worth thinking about:

  • How does this map compare to other maps on Geo-Mexico of inequalities across the country? (Use the site search feature or tags from the tag cloud on the left hand side of each page to find other inequality maps)
  • To what extent does this map confirm that north-south divide described in several previous posts?

Source:

Niveles socioeconómicos por entidad federativa 2009 – 2010 by Roy Campos and Ana María Hernández; CONSULTA MITOFSKY, December 2010.

Related Posts:

Mexican migrants and remittances: an introduction

 Books and resources, Index page  Comments Off on Mexican migrants and remittances: an introduction
Nov 072011
 

Remittances (the funds sent by migrant workers back to their families) are a major international financial flow into Mexico. Remittances bring more than 20 billion dollars a year into the economy, an amount equivalent to 2.5% of Mexico’s GDP.

On a per person basis, Mexico receives more worker remittances than any other major country in the world. An estimated 20% of Mexican residents regularly receive some financial support from relatives working abroad. Such remittances are the mainstay of the economies of many Mexican families, especially in rural areas of Durango, Zacatecas, Guanajuato, Jalisco and Michoacán.

The causes and consequences of mass out-migration and large remittance payments are varied, and sometimes disputed. For background, causes and trends, try:

For some impacts of Mexican migrants on the USA (of varying importance), see:

The four subtitles used in the Atlantic Magazine article are useful reminders of some of the other major aspects of international migration from Mexico. Again, links are given to previous Geo-Mexico posts which look at good examples.

“Branching Out” emphasizes the links that exist between communities, often referred to as “migration channels”.

“The Hollow States” identifies the five major “states of origin”—Guanajuato, Jalisco, Michoacán, San Luis Potosí and Zacatecas—which receive almost 50% of all remittance payments.

“Staying Put” points out that improved economic conditions in Mexico in recent decades, have restricted out-migration from certain areas, especially the border region. Recent developments in Mexico’s war on drugs have, however, led to an increase in the number of border residents moving to bigger, safer cities further south, or seeking to emigrate to the USA.

“Community Development” stresses the important link between “hometown associations” (groupings, found in many US cities, of Mexican migrants sharing a common area of origin) and their related villages and towns in Mexico. Many community development projects in areas of high out-migration have been financed by remittances. In many cases, the three levels of Mexican government—municipal, state and federal—provide matching funds for such projects, meaning that remittances only pay for 25% of the total costs.

In future posts, we will examine some of these aspects of remittances in more detail, and take a much closer look at the precise mechanisms used to make the international financial transfers involved.

Uxpanapa, an example of forced migration

 Excerpts from Geo-Mexico  Comments Off on Uxpanapa, an example of forced migration
Oct 312011
 

Almost all internal migration in Mexico in recent history has been voluntary. Tens of thousands of rural Mexicans have decided that life might be better somewhere else and have left their farms for the bright lights of the nearest large city. Their motivation is usually economic, but sometimes may be based on educational opportunities or access to health care.

However, not all internal migration has been voluntary. There have been some cases of forced migration, where the inhabitants of a village or area have been made to move away in order to make way for large-scale infrastructure projects such as reservoirs, tourism resorts and hotel complexes.

Since most good dam sites are in remote highland areas, with sparse population, forced migrations due to new dams are relatively rare in Mexico. One good example is when the building of the Cerro de Oro dam in the 1970s in northern Oaxaca, on a tributary of the River Papaloapan, flooded 360 square kilometers (140 square miles) and meant the forced relocation of more than 5000 Chinantec Indians. [Aguilera Reyes] The resettlement plan was one of the most forward-looking of its time. Villagers received compensation for their existing homes, trees and crops, and were offered a choice of possible resettlement sites.

They chose an area of rainforest-covered ridges and valleys near the headwaters of the Rivers Coatzacoalcos and Uxpanapa in the Isthmus of Tehuantepec. With government assistance they built a dozen new villages named, somewhat unimaginatively, Poblado Uno, Poblado Dos, etc. Extensive agricultural support was provided for several seasons, but the plan failed to live up to expectations, in part because its architect, the distinguished Mexican geographer Jorge Tamayo, was killed in a plane crash in 1978.

Many of the area’s young people have migrated (voluntarily) north. The remaining villagers grow ixtle, a fibrous cash crop produced from rainforest bromeliads that can be used for ropes and belts. They are also trying to introduce ecotourism to preserve what is left of their tropical jungle hideout, which has a rich biodiversity, including spider monkeys and jaguars. [Ginsberg]

References:

Aguilera Reyes, S. 2004 “Desarrollo, Población y Uso de los Recursos Naturales en el Valle de Uxpanapa.” Universidad Veracruzana Facultad de Sociología thesis. Xalapa,Veracruz. Marzo 2004.

Ginsberg, S. 2000 Report from Uxpanapa. Can bromeliads save Veracruz’s last rainforest? [6 September 2009]

Related posts:

This post is an edited excerpt from chapter 25 of Geo-Mexico: the geography and dynamics of modern Mexico. Buy your copy today!

Veracruz: one of Mexico’s most diverse states

 Other  Comments Off on Veracruz: one of Mexico’s most diverse states
Oct 242011
 

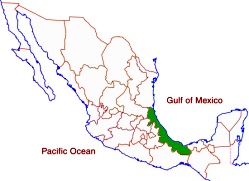
Veracruz, one of Mexico’s most important and interesting states, is a narrow strip of land stretching for 650 kilometers (over 400 miles) along the Gulf of Mexico. The topography ranges from a narrow coastal plain to very high mountains on its western border including Mt. Orizaba, Mexico’s highest peak at 5,610 meters (18,406 ft.).

The relief helps to funnel migrating birds into a narrow band across the state:

Veracruz which is one of the rainiest states has three of Mexico’s five largest rivers: the Panuco in the north and the Papaloapan and Coatzacoalcos rivers in the south. Its varied climate and ecosystems mean enormous biodiversity, including species of insects, birds and plants that exist nowhere else on earth. These species are protected in 31 protected areas including three national parks. Previous posts describe the fabulously beautiful Las Tuxtlas Biosphere Reserve and the mysterious Laguna Encantada.

With over 7.6 million residents, Veracruz trails only the State of Mexico and the Federal District in population. While the state is over one-third rural, it has several major metropolitan areas. The state capital is Xalapa (809,000). Other major cities include the industrial twin cities of Coatzacoalcos (234,000) and Minatitlán (356,000) in the extreme south, and the port city of Veracruz (703,000) in the center. The north of the state is served by the port city of Tampico (803,000) on the north bank of the Panuco River in the neighboring state of Tamaulipas.

One of the most interesting towns is Yanga, which was established around 1570 by escaped slaves lead by Gaspar Yanga. The town, the first African-ruled settlement in the New World, successfully resisted efforts by the colonial government to recapture it and its residents. Today, Gaspar Yanga is considered a national hero. It is interesting to note that Negroid features are apparent on the ancient 3,500 year old Olmec carved stone heads found in southern Veracruz. The state is home to numerous indigenous groups including the Nahuas, Huastecos, Otomis, Totonacs.

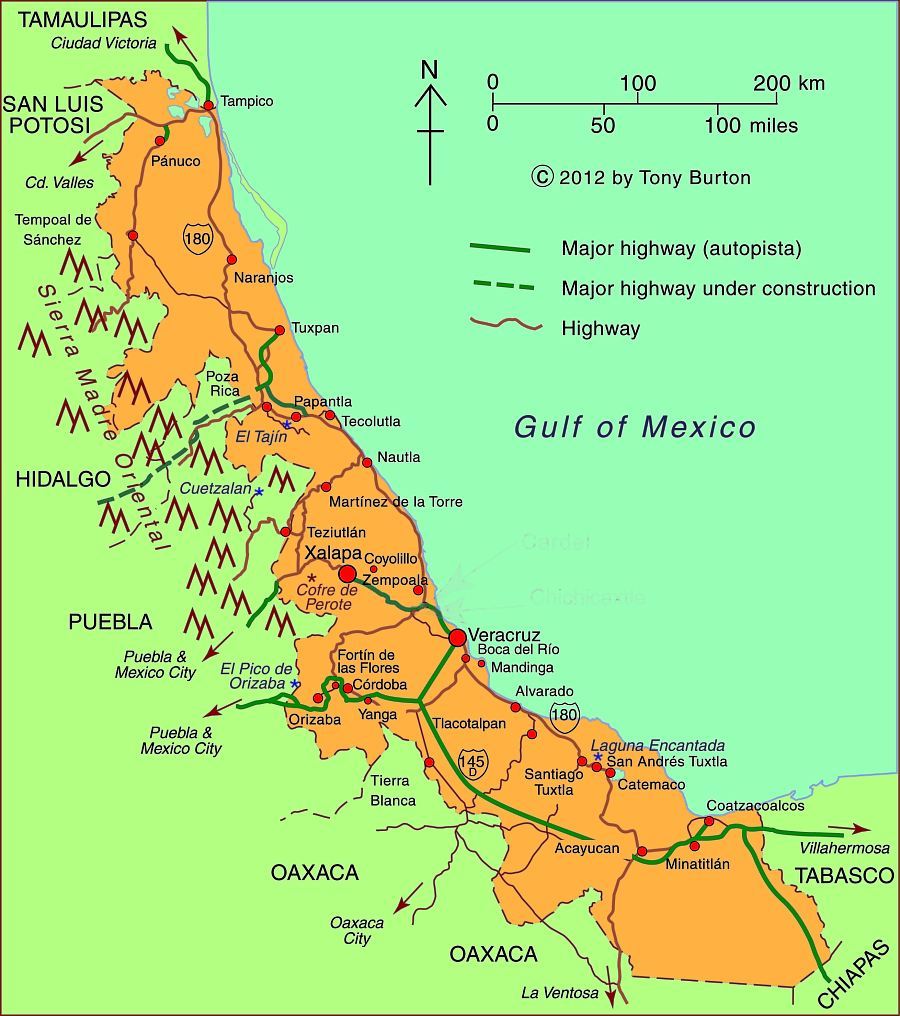
Map of Veracruz state, Mexico; all rights reserved.

Map of Veracruz state, Mexico; all rights reserved. Click to enlarge.

There are two UNESCO-designated World Heritage sites in Veracruz: the Pre-Hispanic city of El Tajin and the Historic Monuments of the Zone of Tlacotalpan.

Veracruz is one of Mexico’s poorer states. Mostly as a result of its very large rural, agricultural and indigenous populations, Veracruz ranks in the bottom third in most socioeconomic indicators such as production/person, percent living below the poverty level, human development index, literacy, infant mortality, life expectancy and marginalization. On the other hand, these indicators for the major cities are above the national averages.

Veracruz is second in total agricultural production behind only Jalisco. It produces more than half of the country’s sugar cane and oranges and also leads in mangoes and other citrus fruits. It is also a major producer of coffee, beef, pork, dairy, chicken, corn, beans, bananas, tobacco, coconuts, vegetables and vanilla.

Petroleum is extremely important. Most of the oil production is in northern Veracruz while the southern cities of Coatzacoalcos and Minatitlán are noted for their chemical and petrochemical industries.

Veracruz is also famous historically and culturally. Cortés and his men landed in Veracruz on their way to conquering and subduing all of Mexico. Veracruz city was the most important port for many centuries when it served as Mexico’s main link to the rest of the world. The state capital was eventually moved to Xalapa, which has a flourishing cultural life and an anthropology museum second only to the National Anthropology Museum in Mexico City. The annual Carnival staged in Veracruz is one of the most spectacular in all of Mexico. The Danza de los Voladores (Dance of the Flyers) in Papantla is a major tourist attraction for Mexicans and foreigners alike. Veracruz also has its own distinctive music and cuisine, enhancing its regional identity.

The geography of road transport in Mexico

 Excerpts from Geo-Mexico, Updates to Geo-Mexico  Comments Off on The geography of road transport in Mexico
Oct 202011
 

Mexico’s road network is heavily used, accounting for over 95% of all domestic travel.  On a per person basis, Mexicans travel an average of 4500 km (2800 mi) by road each year.

In this post, we try to answer several general questions relating to the geography of road transport in Mexico.

How many cars are there?

On average there are about seven people per car in Mexico, compared to about six in Argentina, ten in Chile and less than two in the USA and Canada. There are far more cars in urban areas with their many businesses, taxis and wealthy residents. In poor rural parts of southern Mexico, private car ownership is quite rare.

Is there an efficient bus system?

Mexico also has an inter-city bus system that is one of the finest in the world. The nation’s fleet of more than 70,000 inter-city buses enables passengers to amass almost half a trillion passenger-km per year.

Where are Mexico’s vehicles made?

Almost all the vehicles on Mexico’s roads were built in Mexico. Mexico’s automobile-manufacturing sector produces about 2.2 million vehicles a year but the majority of production (about 1.8 million vehicles each year) is for export markets. Mexico is the world’s 9th largest vehicle maker and 6th largest vehicle exporter. In recent years, the relaxation of strict import regulations has resulted in more vehicles being imported into Mexico; many of them are luxury models not currently made in Mexico.

The major international vehicle manufacturers with plants in Mexico include Volkswagen, Ford, Nissan, GM, Renault, Toyota and Mercedes-Benz. Mexican companies include Mastretta, which specializes in sports cars, and DINA, a manufacturer of trucks, buses and coaches.

For more information about vehicle manufacturing in Mexico:

Where are Mexico’s vehicles?

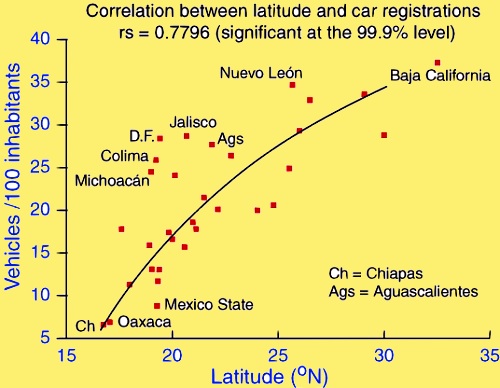
Mexico has about 20 million registered vehicles, about one for every five persons (2005). Which areas have the most and least vehicles? It turns out that the northernmost state, Baja California, has the most with 37 registered vehicles per 100 people. The southernmost states, Chiapas and Oaxaca, have about one sixth as many with 6.6 and 6.9 respectively. In fact there is a very strong statistical relationship between latitude and vehicles (see graph). How can this be?

Scattergraph of latitude and vehicle registrationsWe are not suggesting a direct causal relationship. Many factors are interrelated. First, the states in the north tend to be wealthier; the Spearman rank correlation for GDP/person and latitude is 0.58. Vehicle ownership is closely related to GDP/person (rs = 0.59). Both these correlations are significant at the 99% level.

In addition, northern states are close to the USA, a vehicle-oriented society. However, there are some anomalies to the general pattern. The very wealthy Federal District has 50% more vehicles than would be expected from its latitude alone. States with many migrants, such as Jalisco and Michoacán, also have more vehicles than expected given their latitude. An added complication is that more than a million foreign-plated cars in Mexico (imported temporarily by returning migrants or foreigners) are not included in these figures.

How many road accidents are there in Mexico?

Mexico’s National Council for Accident Prevention estimates that there are 4 million highway accidents each year in Mexico. The latest figures (for 2010) show that there were 24,000 fatalities as a result of these accidents, with 40,000 survivors suffering some lasting incapacity. These figures include some of the 5,000 pedestrians struck by vehicles each year. Traffic accidents are currently the leading cause of death for those aged 5-35 in Mexico, and the second cause of permanent injury for all ages.

Why are there so many accidents?

Driver education plays a major role in road safety. Part of Mexico’s problem is the low budget it allocates each year for road safety—just US$0.40 compared to more than $3.00/person in the USA, more than $7.00/person in Canada and up to $40.00/person in some European countries.

It is no surprise that a high percentage of drivers involved in traffic accidents in Mexico have alcohol in their system. This is one of the reasons why accidents are statistically more frequent in the evenings from Thursday to Saturday. One study reported that as many as 1 in 3 of drivers in Guadalajara was under the influence of alcohol while driving, and 1 in 5 of Mexico City drivers.

Driving without insurance is common in Mexico; according to insurance companies, only 26.5% of Mexico’s 30.9 million vehicles have any insurance.

Related posts:

Hurricane Jova smashes into Barra de Navidad and Melaque on Mexico’s Pacific Coast

 Mexico's geography in the Press  Comments Off on Hurricane Jova smashes into Barra de Navidad and Melaque on Mexico’s Pacific Coast
Oct 142011
 

The twin coastal towns of Melaque and Barra de Navidad in the state of Jalisco felt the full force of Hurricane Jova earlier this week. Barra de Navidad has great historical importance as one of the shipbuilding ports where the Spanish built the ships which traversed the Pacific Ocean to the islands of the Philippines.

Full details are only beginning to emerge of the damage done, but the following links show the storm’s path, and some of its immediate impacts:

Fortunately, Hurricane Jova had lost some of its strength by the time it slammed into the coast as a Category 2 hurricane on 12 October. It had previously packed winds of up to 160 km/hr. Even so, it brought torrential rain to coastal areas between the major resorts of Puerto Vallarta and Manzanillo, and heavy rain inland as far as Guadalajara (about 400 km from the coast). In Guadalajara, the flag-raising ceremony to mark the start of the 2011 Pan-American Games was postponed by a day because of continuous rainfall.

In Puerto Vallarta, where several Pan-American Games events are scheduled to be held, including sailing, triathlon, beach volleyball, and open water swimming, authorities secured boats and reinforced the beach volleyball courts with sandbags.

The catastrophe-modelling firm AIR Worldwide says Hurricane Jova will have caused less than $52m of damage as it hit a sparsely populated stretch of Mexico’s Pacific coast downgraded as a Category 2 hurricane.

Many smaller settlements, including Cihuatlán, La Huerta, Villa Purificacion, and Cuautitlán de García Barragán were temporarily cut off as floodwaters made the main coastal highway impassible. Streets in many towns were inundated.

Details of the storm’s track and intensity will (in due course) be available at the National Hurricane Center’s archive for 2011 Eastern Pacific Hurricanes.

Previous hurricane-related posts include:

Hurricanes and other climatological phenomena are analyzed in chapters 4 and 7 of Geo-Mexico: the geography and dynamics of modern Mexico. Buy your copy today, so you have a handy reference guide available whenever you need it.

Sep 082011
 

Geotourism is geography tourism (as opposed to tourism geography!). It applies to any recreational (tourism) activity where one of the primary objectives is to visit some phenomenon of geographic importance. This could be a coral reef, mangrove swamp, volcano, mountain peak, cave or canyon, but it could just as easily be a sinkhole, waterfall, new town or sugar mill. Ideally, geotourism should be sustainable, ecologically-aware and culturally-sensitive.

Geotourism often involves visiting landforms that hold special value: geomorphosites. Mexico has an amazing diversity of geomorphosites, quite possibly the richest collection of any country in the world.

What exactly are geomorphosites?

Geomorphosites were first defined in 1993 by Mario Panniza. Essentially, they are landforms that have acquired, over time, a certain value. Once noticed and made accessible to people, the landforms acquire scientific, cultural, historical, aesthetic, and socio-economic value. [1]

Panniza subsequently defined geomorphosites as,”landforms that have acquired a scientific, cultural/historical, aesthetic and/or social/economic value due to human perception or exploitation.” [2]

Reynard and Panniza state that geomorphosites can vary in scale from a single geomorphological object (eg a sink hole) to a wider landscape (eg a mountain range) and that geomorphosites “may be modified, damaged, and even destroyed by the impacts of human activities.” [3]

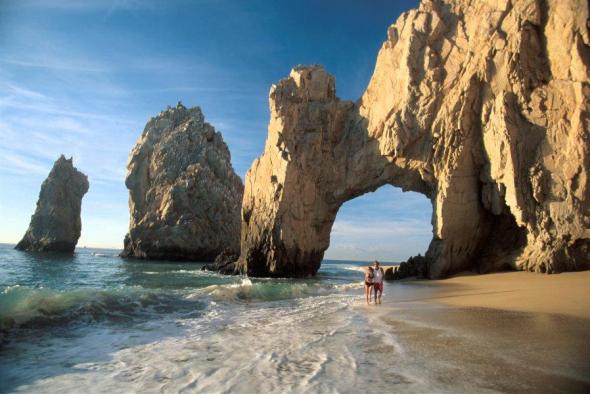
The marine arch at Cabo San Lucas, an example of a geomorphosite

The marine arch at Cabo San Lucas, an example of a geomorphosite

The dominant additional value may be economic, ecological, aesthetic or cultural, and this provides a starting point for assessing whether or not a particular landform is a geomorphosite or not.

The science study (see first comment below!) of geomorphosites is still in its infancy. Several competing classifications have been proposed, and no definitive consensus has yet been reached on the best way to quantify the value of a particular example.

One set of criteria for assessing geomorphosites includes:

A. Economic value:

  • accessibility,
  • number of visitors,
  • inclusion in promotional literature

B. Scientific/ecological value:

  • palaeogeographical interest,
  • singularity,
  • integrity (state of conservation)
  • ecological interest

C. Aesthetic value:

  • the number and spacing of belvedere points (high points from which a view is possible over the surrounding landscape)
  • shape
  • altitude
  • color

D. Cultural value:

  • cultural legacy (writing, art etc),
  • historical and archaeological significance,
  • religious relevance,
  • artistic and cultural events

Mexico has literally thousands of geomorphosites. We have already described some of them, including:

and we plan to highlight many more in future posts, including:

  • Piedras Bola (Stone Balls) in Jalisco
  • Peña de Bernal, a monolith in Querétaro
  • Sumidero Canyon in Chiapas
  • the iconic marine-eroded arch at Cabo San Lucas (see photo)

The scientific study of geomorphosites should enable researchers to suggest ways to approach their management. Unlimited access to some geomorphosites may generate a healthy flow of admission fees but could also easily increase erosion and hasten the destruction of the very thing that the tourists are paying to see.

On your next trip to Mexico, make sure to visit one or more of the country’s super-numerous geomorphosites!

References:

[1] Comanescu and Nedelea, Area (2010) 42:4, 406-416.

[2] Panizza M. (2001) Geomorphosites : concepts, methods and example of geomorphological survey. Chinese Science Bulletin, 46: 4-6

[3] Reynard, E and Panizza, M. (2005 ) Geomorphosites: definition, assessment and mapping, Géomorphologie : relief, processus, environnement , 3/2005

Sep 032011
 

The sugar industry accounts for 0.5% of national GDP. Sugarcane fields cover 670,000 hectares (1.6 million acres) in Mexico, the second largest crop area after corn. Yields of sugarcane range from 60-70 metric tons/hectare.

Main growing areas in Mexico

The main cane producing states are: Veracruz (1.9 million metric tons), San Luis Potosí and Jalisco (each 0.6 million), Oaxaca and Chiapas (each 0.3 million), and Nayarit, Tamaulipas and Morelos (each 0.2 million). Veracruz is the leading state by far in terms of area of sugarcane fields, with 260,000 hectares devoted to cane, folled by Jalisco, San Luis Potosí and Oaxaca (each with around 56,000 ha) and Tamaulipas (43,000 ha).

SugarcaneSugarcane fields and their associated sugar mills form a highly distinctive landscape in many parts of Mexico, with the greatest concentrations on the coastal plains on the Gulf and Pacific coasts, together with numerous higher-altitude river valleys in central Mexico.

History and land tenure

Sugarcane was brought to Mexico by Spanish settlers. Many major plantations were established, as they were in the Caribbean and Brazil. Mexico’s indigenous population provided a resident labor force, augmented by the introduction of some slaves from Africa (see Blacks outnumbered Spaniards in Mexico until after 1810).

The large colonial sugar haciendas in Mexico (and some were very, very large indeed) exerted considerable influence over politics and local economies. Sugarcane remained an important crop following the Mexican Revolution (1910 onwards) which led to rural reorganization and much stricter controls on the size of land holdings. Sugarcane is grown on 150,000 farms, making their average size small, under 4.5 hectares (11 acres) each. This is partly a consequence of the Mexican Revolution which limited maximum farm size. About half of all sugarcane production units are 2 hectares or less in area. The small average size of sugarcane farms places severe restrictions on possible investments and effectively prevents any economies of scale.

Employment

The sugarcane sector employs about two million people directly and indirectly. The number of direct jobs includes:

  • 150,000 growers
  • 100,000 seasonal sugarcane cutters
  • 20,000 cane transport workers
  • 30,000 sugarmill workers
  • 7,000 administrative, technical and management personnel

Harvesting and production

The annual harvesting of sugarcane in Mexico runs from late October to June. During the 2010-2011 harvest, 670,000 hectares of cane fields were cut yielding 44 million metric tons of cane, from which 5.2 million metric tons of sugar was extracted, 7.4% more than for the 2009-2010 harvest.

Sugar mills

More than 50 sugar mills currently operate in Mexico. The mills vary greatly in size, age and technology. Many are small, old and inefficient, which increases the cost of sugar production in Mexico compared to countries with newer methods and equipment. Mexico’s sugar mills have weathered numerous financial crises. In 2001, 27 mills were placed under government control, with about half of these mills later sold back to private ownership. In 2005, a revised Sugarcane Law guaranteed a basic reference price for growers, improving their financial security. Almost half of all Mexico’s sugar mills are located in Veracruz state. The remaining sugar mills are scattered among an additional 15 states.

Domestic consumption of sugar

Mexico’s domestic market consumes around 4.5 million metric tons a year, with the largest demand coming from the soft drinks industry. Consumption is expected to fall this year, due to reduced consumer purchasing power and escalating domestic prices for sugar fueled by speculation and supply shortages.

Sugar exports

Mexico is the world’s 6th largest exporter of sugarcane, and the main supplier of sugar to the USA. For the 2010-2011 season, sugar exports to the USA totaled  a record 1.3 million metric tons. This figure has been increasing rapidly in recent years, partly due to sugarcane’s inclusion under the terms of NAFTA.

Despite its exports, Mexico also imports small quantities of sugar, mainly from Nicaragua in order to maintain its own sugar reserves of around 1 million tons.

The challenges faced by Mexico’s sugar industry

Mexico’s sugarcane industry faces numerous serious challenges, including:

  • poor drainage of soils in some areas
  • winter frosts in some mountain areas, especially in the more northerly growing regions.
  • limited rainfall – cane requires 1100–1500 mm (43–60″) of precipitation a year; unreliable precipitation, especially periods of drought, are a major problem, especially in Veracruz where irrigation systems are inadequate
  • level of production inputs (fertilizers, pesticides, etc)
  • transport costs which contribute to the high price of sugarcane in Mexico
  • small size of production units which limits investment and improvements
  • low efficiency of older sugar mills

Environmental degradaion

Environmental degradation is one of the most serious issues facing Mexico’s sugar industry, given the nature of sugarcane processing and the age of many of Mexico’s sugar mills:

  • much of Mexico’s cane is still hand-cut, and burning the cane fields prior to harvest is still a common practice, since it makes harvesting easier and drives out snakes. However, it has an adverse effect on air quality as well as on soil nutrients, structure and microorganisms.
  • Large volumes of water are used in growing and processing sugarcane. Much is wasted; some is returned to groundwater sources or streams heavily polluted. More recycling and water treatment plants are needed.
  • Air pollution is also a problem with some mills still to fit modern emissions control devices.
  • The safe disposal of processing waste (some of which has potential value for subsequent use in other industries) is also a continuing problem. Sugar mills produce a variety of waste materials, many of which are currently dumped.

Further reading:

Sep 012011
 

In a recent post, we looked at the vexed question of the overall 2010 homicide rate for Mexico. We included a mention of  National System of Public Security (SNSP) data for Mexico that show that there were 18 intentional homicides (murders) per 100,000 population in 2010. This rate varies greatly from state to state (see graph). The rate in the state of Chihuahua, the epicenter of drug war violence, is 112 per 100,000 which is roughly twice as high as any individual country on the planet. Sinaloa which has experienced a rapid upsurge in drug violence was second with a murder rate of 87 per 100,000.

murders by state, 2010

Source: National System of Public Security (SNSP)

Other states with very high murder rates are Nuevo León with 76, Durango with 63, and Guerrero with 44. All of these states suffer from very high rates of drug-related murders. Over 93% of all murders in Chihuahua are drug-related, compared to 73% in Sinaloa, and about 70% in both Guerrero and Durango. The non-drug-related murder rate for Chihuahua of 9.4 is just above the national average of 8.1.

Yucatán has the lowest murder rate with just 0.5 murders per 100,000, lower than the rate in Canada and about one-tenth that of the USA. Other states with relatively low murder rates (see map) include Querétaro (1.0), Tlaxcala (1.5), Hidalgo (5.0) and Tabasco (5.4). All of these states are relatively free of drug-related violence.

Map of murder rate, 2010

Map of murder rate, 2010. Credit: Tony Burton / Geo-Mexico.

The national murder rate of 17.9 is almost twice the rate for the Federal District (D.F.) which is 9.2 per 100,000. Only about 18% of the murders in the capital city are drug-related. The murder rate in Jalisco of 12.0 is well below the national average, even if it has increased rapidly. Over half the murders in Jalisco in 2010 were drug-war-related. The State of Mexico also has a relatively low murder rate of 7.6 with 30% of murders related to the drug wars.

The main conclusion is that many northern states like Chihuahua, Sinaloa, Nuevo León and Durango are plagued by drug war violence and have very high murder rates. On the other hand, most states in the south and southeast, like Yucatán, Campeche and Tlaxcala are relatively free of drug war violence and historically have had low murder rates. One significant anomaly in the overall pattern appears to be Guerrero which is well to the south but has a high murder rate and a very significant amount of drug violence.

Car-makers building new assembly plants in Mexico

 Mexico's geography in the Press  Comments Off on Car-makers building new assembly plants in Mexico
Aug 232011
 

Two major Japanese car-makers—Mazda and Honda—have announced expansion plans in Mexico in recent months. They will help ensure that Mexico remains the 9th largest car manufacturer in the world, and the 6th largest vehicle exporter. In addition, Italian auto-maker Fiat is expanding its plant in Toluca.

Mazda plant in Salamanca

Mazda is building a new 500-million-dollar plant in Salamanca (Guanajuato) to assemble its best-selling Mazda2 and Mazda3 models. The Mazda3 is the Mazda’s top selling model in the USA. The Mazda plant, scheduled to open in 2013, will employ about 3,000 workers and produce 140,000 vehicles a year.

Honda plants in El Salto and Celaya

Honda, which currently has two manufacturing plants in El Salto (Jalisco), is to construct a third plant, in Celaya (Guanajuato). The new plant will produce the fuel-efficient Honda “Fit” for the North American market. Due to open in 2014, it represents an investment of 800 million dollars and will have the capacity to assemble 200,000 vehicles a year.

Mexican-made cars being exported to China

By early next year, Fiat will be producing 100,000 units a year of its model 500 at its new plant in Toluca, in the state of Mexico. Only 3.5% of these units will be sold in the domestic market. The remainder are destined for export markets, including China, Brazil and the USA. China has already received its first shipment of 100 exclusive “First Edition” vehicles and is expected to take 50,000 a year once the Fiat plant is operating at full capacity.

Related posts:

Mexico’s economic geography is analyzed in chapters 14–20 of Geo-Mexico: the geography and dynamics of modern Mexico. Buy your copy of this invaluable reference guide today!

Aug 082011
 

Durango has long been considered the scorpion capital of Mexico (even the local soccer team became known as Los Alacranes, the Scorpions). At one point in the past, the city paid a bounty for each scorpion killed. Some historical accounts suggest that the scorpion catch rose dramatically, until the local authorities realized that some families had started their own financially lucrative scorpion-breeding programs.

These days, few scorpion stings are reported in Durango, partly because Durango’s scorpion hunters (alacraneros) catch and kill thousands each rainy season; prime specimens are encased in souvenir key rings and wall clocks sold in the local market. They also supply medical research labs.  Research in one lab at the University of California has isolated several peptides that appear to suppress the immune system, promising another way to prevent transplant rejection.

Lourival Possani, and his colleagues at Mexico’s National University (UNAM) have discovered a toxin (named scorpine) in scorpion venom that slows down the growth of malaria parasites in fruit flies; if similar techniques work in malarial mosquitoes, it may be possible to dramatically reduce the spread of malaria.

About 250,000 people in Mexico are stung by scorpions each year—more people than in any other country. Several dozen people die each year. Indeed, for the past 20 years, scorpion stings have been the leading reason in Mexico for  deaths due to adverse reactions and poisoning caused by venomous plants and animals. There are more than 200 different species of scorpions in Mexico, of which only 8, all belonging to the genus Centruroides are a significant public health risk. The map shows the areas defined by Mexico’s Health Secretariat as being of High, Medium and Low risk for dangerous scorpions.

Mortality remains higher in the smallest settlements, and is greatly reduced in mid-sized and large settlements. This is a function of both the reduced proximity of medical care in small settlements and of the higher numbers of scorpions/10,000 people in less urbanized settings. The highest mortality rates by age occur in the 0-1 years group (7 deaths/million), followed by the 1-4 age group (3.8/million) and the 60+ years group (0.8/million) (all data from http://www.scielo.br/pdf/rpsp/v21n6/05.pdf)

Scorpion risk in Mexico

Scorpion risk in Mexico (Secretaria de Salud)

Fortunately, progress is being made. The number of recorded deaths from scorpion stings [1] has fallen from more than 1,000/year in the 1950s to 285 in 1995, about 80 in 2003, and 57 in 2005. This improvement is the result of public health campaigns stressing the importance of seeking emergency treatment and of the development of antivenin serum (known as Alacramyn in Mexico and Anascorp in the USA). Mexico’s antivenin industry, led by the Bioclon Institute, is world class, exporting serum to the USA and Australia as well as throughout Latin America. The biggest threat from scorpions comes from central and northern states in Mexico, including several along the Pacific Coast: Nayarit, Jalisco, Colima, Michoacán and Guerrero.

According to UNAM’s Biomedical Investigation Institute, 277,977 people in Mexico reported scorpion stings in 2010. In the first five and a half months of 2011, 98,818 people in Mexico have been stung. The five states with the highest incidence of reported scorpion stings are: Jalisco (19,995), Guerrero (15,769), Morelos (13,123), Guanajuato (12,326) and Michoacán (10,597).

The incidence of scorpion stings rises sharply in summer when higher temperatures encourage scorpions to leave their lairs and go exploring.

Q. What other factors, besides the ones mentioned in this post, might help explain the pattern of risk shown on the map? Hint – can you think of things that the states shown as “high risk” — or the “low risk” ones — have in common?

– – – – –

[1] A Google search using the terms “scorpion”, “deaths” and “Mexico” finds dozens of websites all claiming that “In Mexico, 1000 deaths from scorpion stings occur per year.” This includes the two highest ranking sites in the results here and here, for articles dated 14 April 2011 and 20 August 2009 respectively. Given that 1000 deaths/year from scorpions has not been true for 20+ years, perhaps it’s time for these sites  to update their data by referring to Geo-Mexico!

Mexico has forty UNESCO-designated biosphere reserves

 Other  Comments Off on Mexico has forty UNESCO-designated biosphere reserves
Jul 232011
 

A surprising percentage of Mexico’s land area is protected in one form or another. A very large number of sites of archaeological or historical importance are managed by the National Institute of Anthropology and History, more commonly known by its acronym INAH. In theory, all buildings more than 100 years old have some degree of protection (under INAH), but in practice this protection is often ignored by developers with other ideas.

Sites considered significant for their natural beauty are protected in a variety of ways, ranging from nature sanctuaries of local importance to protected areas, national parks and internationally recognized biosphere reserves. In total, more than 11.5% of Mexico’s land area is now protected. This percentage has risen steadily for more than a century.

The designation of biosphere reserve can only be made by UNESCO (U.N. Educational, Scientific and Cultural Organization), in a manner somewhat similar to the designation that some major historical sites enjoy as World Heritage Sites. One of the benefits of attaining Biosphere Reserve status is that it allows access to more sources of funding for conservation programs.

Mexico currently has 40 biosphere reserves. Only the USA (48), the Russian Federation (41) and Spain (41) have more. Worldwide, there are now (July 2011) 580 biosphere reserves in 114 countries. The guiding principle of biosphere reserves is that the local populace is not displaced, but actively involved in all aspects of management, research and monitoring.

Biosphere Reserve Zonation

Biosphere reserves have a research-intensive core area or areas at their heart, surrounded by a buffer zone, where sustainable development is fostered, before gradually transitioning into the surrounding region. Many reserves have innovative systems of governance designed to ensure that the views of local people are fully respected. The idea of biosphere reserves was first proposed in 1968 at the UNESCO “Biosphere Conference”, the first international attempt to reconcile the need for conservation with the use of natural resources for development.

No system is perfect. The challenges for biosphere reserves include strengthening the worldwide network by establishing new reserves in areas where few currently exist, as well as helping meet the on-going funding needs for all the reserves. One of the most significant future threats to biosphere reserves is likely to be the habitat changes wrought by global warming.

One of the more startling surprises in the existing network of reserves is the almost total lack of protection afforded to such an amazing part of Mexico as the Copper Canyon region, with its indigenous Tarahumara people and world-class scenery. But perhaps one day this region, too, will become part of Mexico’s extensive system of protected areas.

Mexico’s Biosphere Reserves, as of July 2011:

Baja California Peninsula:

  • El Vizcaíno (Baja California Sur): desert, mountain and coastal/marine ecosystems, petroglyphs, wall paintings, birds and Grey whales.
  • Sierra La Laguna (Baja California Sur): contrasting ecosystems, woodlands and scrub, with high degree of endemism.
  • Alto Golfo de California (Baja California and Sonora): extraordinary geological formations with volcanic craters, dunes, oasis and beaches, and a diversity of plant associations.
  • Islas del Golfo de California (Baja California Sur and Sonora): series of over 240 islands with high number of endemic species; ornithological paradise.

Northern Mexico:

  • Mapimí (Durango, Chihuahua and Coahuila): fragile warm desert and semi-desert ecosystems.
  • La Michilía (Durango): mountainous area of pine-oak forest; habitat for the now rare black bear (Ursus americanus) and wolf (Canis lupus).
  • El Cielo (Tamaulipas): one of the most ecologically rich and diverse parts of Mexico; numerous endangered animal species; ecotourism area.
  • Laguna Madre and Río Bravo Delta (Tamaulipas): a migratory bird haven on coastal wetlands.
  • Cumbres de Monterrey (Nuevo León): the landmark mountains that ensure the water supply for the state capital.
  • Maderas del Carmen (Coahuila): encompassing parts of the Chihuahuan Desert in Coahuila state adjacent to the U.S. biosphere reserve of Big Bend National Park.
  • Cuatrociénegas (Coahuila): an oasis with 500 pools that preserve species found only in the Coahuila state part of the Chihuahua desert.
  • Sierra de Alamos–Rio Cuchujaqui (Sonora): endangered tropical deciduous forest.

Central and Western Mexico:

  • Sierra de Manantlán (Jalisco and Colima): transition of the Nearctic and Neotropical biological realms; cloud forest and wild perennial corn (Zea diploperennis).
  • Chamela-Cuixmala (Jalisco): a Pacific Coast dry tropical forest harboring iguanas and crocodiles in lagoons and marshes.
  • Islas Marietas (Nayarit): a biodiverse archipelago of islands with a rich mix of marine species, corals and landforms.
  • La Primavera (Jalisco): pine and oak forest in a caldera close to Guadalajara, Mexico’s second city.
  • Sierra Gorda (Querétaro): ecologically diverse area with 14 vegetation types, historic missions and Huastec Indians.
  • Monarch butterfly migration sites (Michoacán and State of México): unique annual migration links Mexico to Canada and the U.S.
  • Sierra de Huautla (Morelos): woods full of endemic species.
  • Barranca de Metztitlán (Hidalgo): home of Otomí Indians and large variety of wildlife.
  • Los Volcanes (State of México/Puebla) is the volcanic landscape of significant aesthetic and touristic value that surrounds the twin volcanoes of Popocatépetl and Ixtaccíhuatl.
  • Islas Marías (Nayarit), a group of four islands, perhaps best known for its federal penitentiary, with considerable diversity of ecosystems and many
    endemic species.

Eastern Mexico:

  • Los Tuxtlas (Veracruz): a beautiful jungle-covered volcanic region, with vestiges of pre-Hispanic archeology.
  • Sistema Arrecifal Veracruzano (Veracruz): an archipelago off the Caribbean coast.
  • Pantanos de Centla (Tabasco): villages in coastal wetlands.

Southern Mexico:

  • Montes Azules (Chiapas): Lacandon tropical rainforest; 500 species of trees; several indigenous groups (including Tzeltal, Chol and Lacandon Maya).
  • Volcán Tacana (Chiapas): fragile ecosystems in Chiapas, adjacent to Guatamala.
  • El Triunfo (Chiapas): diverse evergreen cloud forest in rugged mountain terrain; a primary Pleistocene refuge for numerous endemic plants and animals; large mobile population.
  • La Encrucijada (Chiapas): shrimping lagoons on the Pacific Coast.
  • La Sepultura (Chiapas): ancestral lands of the Olmec and other pre-Hispanic cultures.
  • Selva El Ocote (Chiapas): rain forests, caves and reserves of underground water.
  • Huatulco (Oaxaca): coastal reserve protecting endangered sea turtles, dolphins and purple snails.
  • Lagunas de Montebello (Chiapas) series of beautiful lakes close to the border with Guatemala, set in upland, wooded terrain, with varied flora and fauna including orchids, butterflies, fish, reptiles, mammals and birds.
  • Naha-Metzabok (Chiapas) northern section of the Lacandon tropical forest, home to several members of the cat family and an important part of the Mayan forest biological corridor

Yucatán Peninsula

  • Ría Celestún (Yucatán and Campeche): coastal region including important wetlands and drowned river valley (ría) with diverse fauna and flora, including flamingos.
  • Región de Calakmul (Yucatán): diverse tropical rainforests; the largest forest reserve in Mexico, with important Maya sites; ecotourism project.
  • Ría Lagartos (Yucatán): coastal estuary with diverse birdlife including more than 18000 pink flamingos as well as some 30,000 migratory birds.
  • Arrecife Alacranes (Yucatán): the largest coral reef in the Gulf of Mexico, and the only one in Yucatán state.
  • Sian Ka’an (Quintana Roo): coastal limestone plain, and extensive barrier reef system on Caribbean coast, with numerous archaeological sites; more than 4,000 plant species.
  • Banco Chinchorro (Quintana Roo): mosaic of open water, sea grass beds, mangroves, sandy beaches and coral reefs; more than 95 species of coral.

Main source: UNESCO: Directory of the World Network of Biosphere Reserves

Related posts:

Jul 182011
 

With so much media attention focused on drug violence in Mexico, many potential tourists and tour operators are canceling planned trips to Mexico. Are such decisions rational? The analysis below indicates that travel to Mexico is considerably safer than risking vehicle traffic in the USA.

The US State Department has issued numerous travel advisories concerning visits to Mexico. As we discussed in a previous post —Which parts of Mexico are currently subject to US travel advisories?— the advisories focus on specific areas of Mexico. Unfortunately, many potential tourists overlook the geographic specificity and get the impression that all parts of Mexico are dangerous. Previous posts clearly indicate that levels of drug war violence vary enormously from place to place in Mexico.

This post investigates the chances of being a fatal victim of drug violence in various places in Mexico and compares these with the chances of being a fatal victim of a traffic accident in the USA. The US Department of Commerce estimates that about 19 million US citizens visit Mexico each year. According to MSNBC, in 2010 at least 106 Americans were killed in Mexico as a result of drug violence. Dividing the 19 million visits by the 106 deaths suggests that the chance of a visitor being killed on a trip to Mexico in 2010 was about 1 in 179,000. These are good odds, much better than the annual chance of being killed in a US traffic accident which is about 9,000 to 1. In other words, the chances of dying in a US traffic accident are roughly 20 times greater than being killed as a consequence of drug violence while visiting  Mexico. (As an aside, the annual chances of being killed in a Mexican traffic accident are about 1 in 4,800.)

Chance of a visitor being killed in drug violence in MexicoRelative danger of death in a road accident in the USA
MEXICO (whole country)1 in 179,00020 times greater
Ciudad Juárez1 in 11,4001.3 times greater
State of Chihuahua1 in 18,5002.1 times greater
Culiacán1 in 25,0002.8 times greater
Mazatlán1 in 47,0005.2 times greater
Tijuana1 in 52,0005.7 times greater
Monterrey1 in 210,00023 times greater
Puerto Vallarta1 in 288,00032 times greater
Chapala1 in 299,00033 times greater
Cancún1 in 360,00040 times greater
State of Jalisco1 in 378,00042 times greater
Oaxaca City1 in 427,00048 times greater
Guadalajara1 in 569,00063 times greater
Mexico City1 in 750,00083 times greater
State of Yucatán1 in 4,151,000460 times greater
Puebla City1 in 6,572,000730 times greater

Some areas of Mexico experience much more drug violence than others. For example drug violence deaths in Ciudad Juárez are 16 times greater than the Mexico national average. Consequently, the chance of an American visitor getting killed in drug violence in Ciudad Juárez is about 11,400 to one, still safer than risking traffic in the USA. The table shows the risks for a range of Mexican locations and compares them to the risks of US traffic. In the city of Puebla the risk is one in 6.6 million compared to one in 750,000 for Mexico City, one in 570,000 for Guadalajara, one in 360,000 for Cancún, about one in 300,000 for Chapala and Puerto Vallarta, and about one in 50,000 for Tijuana and Mazatlán.

These results indicate that the chance of a visitor being killed by drug violence in Mexico is extremely unlikely, far less likely than the risk of being killed in a US traffic accident. For example, a visit to Chapala is 33 times safer than risking US traffic for a year, while Mexico City is 83 times safer. Though this analysis focuses on the travel of US tourists to Mexico, the results are equally relevant for visitors from other countries.

Religious diversity is increasing in Mexico

 Updates to Geo-Mexico  Comments Off on Religious diversity is increasing in Mexico
May 282011
 

Mexico is still considered to be a Catholic country, but it is slowly becoming less Catholic. In the 2010 census 82.7% said they were Catholics compared to 88.0% in 2000 and 89.7% in 1990. In a recent report, Sociologist Roberto Blancarte, who specializes in research into religions, claims that for each day of the last decade, more than 1,000 Mexicans left the Catholic Church. He concludes that Catholicism is “destined to be abandoned” in Mexico.

Conversely, the percentage of the population who declared themselves non-Catholic went from 12.0% to 17.3% in 2010, almost a 50% increase.

The percentage of Protestants or Evangelicals increased to 9.7% in 2010 from 5.2% in 2000 and 4.9% in 1990. The proportion following “Other Religions” was 2.5% in 2010, 2.4% in 2000 and 1.5% in 1990. While the percentages in these latter two groups are rather low, Mexicans in non-Catholic religions tend to be far more religiously active than the majority of those who consider themselves Catholics. A total of 4.6% indicated that they had no religion in 2010, compared to 3.5% in 2000 and 3.2% in 1990.

Women tend to be more religious than men and more apt to have specified religions. About 5.5% of males indicated that they had “No Religion” compared to 3.9% for women. Women were a bit more likely to indicate they were Catholics (83.1% versus 82.3%) or Protestants or Evangelicals (10.2% versus 9.2%).

Western Mexico is still the most Catholic area of the country, though other religions are gaining converts. The state with the highest proportion of Catholics is Guanajuato with 93.8% followed closely by Zacatecas with 93.5%. Other states with over 90% Catholics are Querétaro, Jalisco, Michoacán, and Tlaxcala.

The least Catholic states are in Southern Mexico, led by Chiapas where only 57.8% are Catholic. Over 27% in Chiapas are Protestants or Evangelicals and 12% indicated that they had “No Religion.” Other states with under 65% Catholics include Campeche, Quintana Roo and Tabasco. The percentage Catholic in Oaxaca is just over 80% which seems surprisingly high given that Oaxaca is a southern state and has the largest proportion of indigenous-language speakers.

Related posts:

The geography of Mexico’s religions is discussed in chapter 11 of Geo-Mexico: the geography and dynamics of modern Mexico. Ask your library to purchase a copy today!

The cultivation of chiles in Mexico

 Updates to Geo-Mexico  Comments Off on The cultivation of chiles in Mexico
Apr 182011
 

In a previous post, we saw how chiles (Capsicum spp.) have been cultivated in Mexico for centuries (the oldest record of domestication dates back to 4100BC) and they made an important contribution to Mexico’s traditional cuisine being recognized by UNESCO as an “Intangible Cultural Heritage of Humanity.”In this post we take a closer look at where they are grown, how many are produced and how valuable the annual crop is for the domestic market and for export.

For an overview of different kinds of chiles, see these two articles by Karen Hursh Graber on MexConnect:

Area cultivated

The area cultivated for chiles has declined slightly over the last decade from 145,000 hectares to 141,000; about 85% of this area is irrigated. However, the volume of total production has risen by an average of 1.5%/yr, due to the application of improved techniques, knowledge and equipment, especially the increased use of greenhouses. Each year, a small percentage of the cultivated area is not harvested due to the adverse impacts of diseases, pests and climatic events.

Cultivation location, production volumes and value

Mexico’s total annual chile production is around 2 million tons [cf China’s 14.3 million tons]. By variety, about 30% of production is jalapeño chiles, followed by serrano (10.9%), poblano (9.7%) and morrón (8.1%). These four account for 60% of production:

  • jalapeño (619,000 tons in 2009): Chihuahua (42%), Sinaloa (12.9%), Jalisco (6.6%) and Michoacán (6.3%)
  • serrano (217,000 tons): Tamaulipas (38.7%) and Sinaloa (30.9%)
  • poblano (192,000 tons): spread between 16 states, led by Zacatecas (32.7%), Sinaloa (20.6%) and Guanajuato (13.2%)
  • morrón (162,000 tons): Sinaloa (96%)

Production of chiles in Mexico
Production of chiles in Mexico, 2009. Source: SAGARPA 2010

The map shows total production volume on a state-by-state basis.

In summary, 2 out of every 3 green chiles grown in Mexico come from Chihuahua, Sinaloa, Zacatecas and San Luis Potosí.

Domestic market for chiles

The average consumption in Mexico is about 15 kg/person. For the period 2000-2010, domestic consumption oscillated around 1.5 million tons/yr. As international demand rises, there is a slightly reduced supply of chiles to the domestic market.

Trade in chiles (exports and imports)

International trade in chiles began shortly after Columbus introduced them to Europe as “peppers of the Indies”.

Today, as noted earlier, Mexico is the world’s leading exporter of green chiles, and ranks 6th for dried chiles. About 25% of Mexico’s chile production is exported. Over the last decade (2000-2009), exports have grown at a rate of about 15%/yr in volume, and 13% in value. In 2009, chile exports were worth 720 million dollars. Exports go to 52 countries, though a whopping 98% go to the USA, followed by the UK, Canada, Germany and Japan.

Mexico also imports some chiles each year. From 2000-2009, imports (almost entirely dried chiles) averaged 30,000 tons, at a cost of around 100 million dollars. China is Mexico’s main provider, followed by Peru, the USA and Spain.

Chile tourism
La Feria del Chile (The Chile Fair) in Queréndaro, Michoacán

Recipes with Chiles:

Main source (pdf file): Un panorama del cultivo del chile, SAGARPA: Servicio de Información Agroalimentaria y Pesquera, June 2010.
[accessed January 28, 2011]

Agriculture in Mexico is analyzed in chapter 15 of Geo-Mexico: the geography and dynamics of modern Mexico. Ask your library to buy a copy of this handy reference guide to all aspects of Mexico’s geography today! Better yet, order your own copy…

Apr 142011
 

Foreigners are defined as individuals born in another country, but residing in Mexico. According to the recent census, almost a million (961,121) foreigners were living in Mexico in mid-2010. In 2000 there were only about half as many (492,617). Among foreigners, there were slightly more males than females (50.6% versus 49.4%). Under this definition, children born in the USA of two Mexican parents are considered foreigners if they currently live in Mexico. Unfortunately, the data currently available do not enable us to separate these foreign-born Mexicans from other foreigners who were raised in other countries and moved to Mexico to follow their professions or retire. Furthermore, they do not help us answer a question we have been asked dozens of times in recent years, namely, “How many Canadians and how many Americans have retired in Mexico?”

Though almost a million foreigners sounds like an impressive number, Mexico has relatively few foreign born residents compared to its two northern neighbors. Foreigners constitute only 0.86% of the 2010 Mexican population, compared to 21% Canada and 13% in the USA.

Where in Mexico do most foreigners reside? Baja California has the most foreigners with almost 123,000, followed by Jalisco (84,000), Chihuahua (80,000), and the Federal District (72,000). Tlaxcala has the fewest, with just over 3,200, followed by Tabasco with about 4,500.

The states with the highest percentage of foreigners are mostly along the US border. Baja California leads with 3.9%, followed by Chihuahua (2.3%), Tamaulipas (1.9%), and Sonora (1.7%). Interestingly, the other border state, Coahuila, has relatively few foreigners, only 0.8%. Other states with relatively large percentages are either historical sources of immigrants to the USA or retirement havens like Colima (1.44%), Quintana Roo (1.40%), Nayarit (1.35%), Zacatecas (1.22%), Jalisco (1.14%) and Michoacán (1.10%).

Tabasco has the fewest foreigners as a percentage with only 0.20%, followed by Tlaxcala (0.28%), Veracruz (0.30%), the State of México (0.33%) and Yucatán (0.36%). Yucatán is a surprise on this list because there is a very large and active foreign retirement community there. Perhaps many of these retirees were away from Mexico when the census was taken in the summer of 2010.

What states experienced the largest increases in foreigners in the last decade? The number of foreigners grew fastest in those states with relatively few foreigners in 2000, namely Hidalgo (up 402% over the decade), Tlaxcala (333%), Tabasco (281%), and Veracruz and Oaxaca (both with 272%).

Related posts:

Mexico’s flower power…

 Other  Comments Off on Mexico’s flower power…
Mar 022011
 

Given its diversity of climates and immensely varied natural flora (see Mexico’s mega-biodiversity, Mexico is ideally suited for commercial floriculture (flower growing).

Helped by government support, floriculture expanded rapidly in the 1980s and 1990s. About 14,000 hectares of agricultural land are devoted to ornamental flowers, with 10,000 growers concentrating on 50 different varieties, the most important of which are gladioli, roses, chrysanthemums, carnations, birds-of-paradise and the nard. Mexico’s flower growers produce 83,000 tons/yr of flowers, 80% of them destined for the domestic market. Most flower farms are smallholdings of 1-3 hectares in size, though there are also about 150 high-tech, greenhouse-based operations for the export market.

In addition to the area dedicated to ornamental flowers, a further 9,000 hectares are devoted to plants and flowers used in the cosmetics and food flavoring industries.

The state of Mexico has the largest area devoted to floriculture in the country, centered on Villa Guerrero. Other states important for ornamental flowers are Baja California, Coahuila, Colima, Chiapas, Guanajuato, Guerrero, Jalisco, Michoacán, Morelos, Puebla, Querétaro, Tabasco, Veracruz, and, in the last five years, Yucatán.

The internal market for ornamentals is severely constricted by a lack of space in Mexico City’s wholesale market; the resulting congestion results in about 20% of all the fresh flowers arriving daily at the market having to be destroyed.

Mexico’s nationwide production of flowers is worth about 1 billion dollars a year. Only a small percentage of production is exported, mainly to the USA, with smaller amounts to Canada and Europe. While Mexican flower exports are currently worth some 50 million dollars, exports from Columbia are worth 550 million dollars and those from Ecuador and Costa Rica about 150 million.

Related posts: