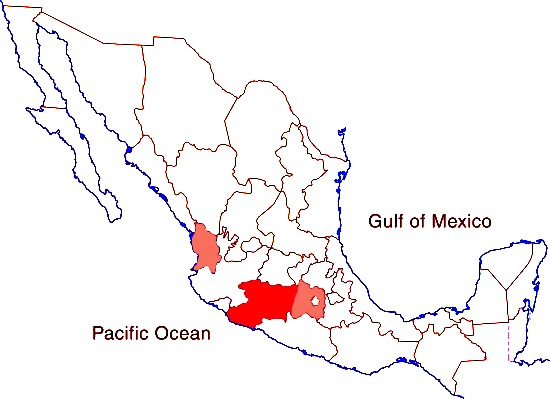
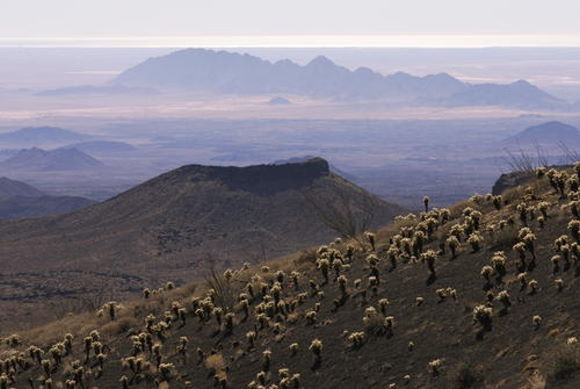
About 160 kilometers (100 miles) north of Guadalajara as the crow flies is a wild and inhospitable arm of the Western Sierra Madre called the Sierra of Bolaños, a rugged northern extension of Jalisco most easily reached by light aircraft. The one way trip by road requires driving more than 320 kilometers (200 miles) from Guadalajara, half the distance being inside the adjacent state of Zacatecas. The Bolaños region has for centuries been an important silver mining area, and British capital and engineers left an indelible mark on the towns there.

Bolaños, the setting. Credit: Tony Burton; all rights reserved
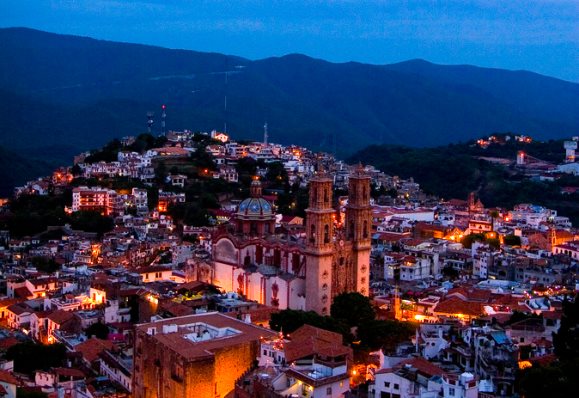
The once-grand colonial mining town of Bolaños fits snugly between the river and the rocky cliffs into which the first mine shafts were sunk. Its numerous old stone buildings, often with ornately carved doorways and windows, make it a fascinating place to wander around. With judicious restoration, Bolaños could undoubtedly find its way onto anyone’s list of Mexico’s top mining towns to visit. The town’s hanging bridge (puente colgante) links Bolaños, on the edge of mestizo territory, with the Huichol Indian villages in the mountains on the far side of the river. Huichol artwork, including colorful beadwork, is on sale in several stores in the town and it is common to see traditionally-dressed Huichol Indians in the streets.
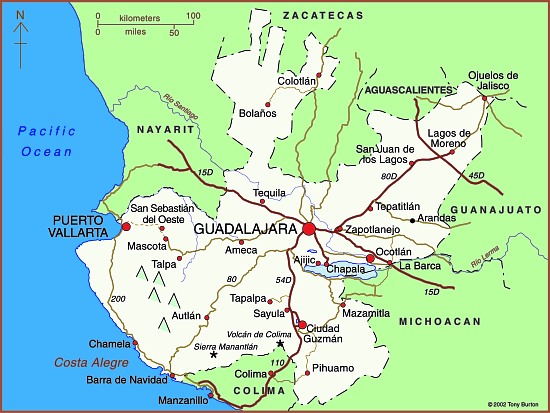
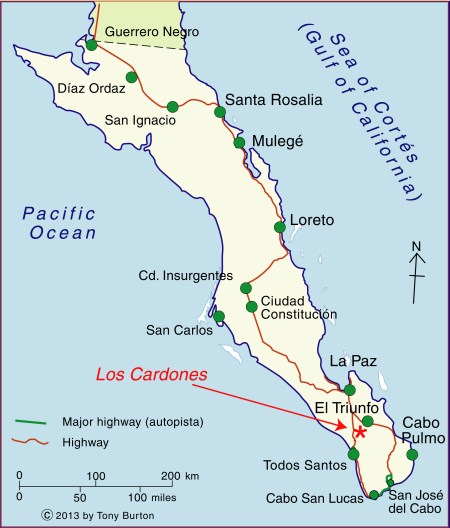
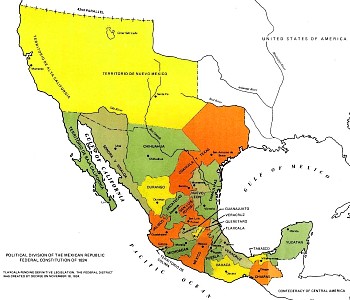
Map of Jalisco. Copyright 2010 Tony Burton. All rights reserved.
Mineral riches
Relatively little is known of the pre-Columbian history of the Sierra of Bolaños but the area was probably only sparsely peopled, perhaps by Tepecano Indians. By the beginning of the seventeenth century, Spanish adventurers had founded the town of Chimaltitán which later served as their base for both subduing the natives militarily and converting them to Christianity. They later founded the towns of Bolaños, a short distance to the north, and San Martín de Bolaños to the south.
By the mid-eighteenth century, the Spanish were in complete control and the Bolaños mines were producing between 2 and 3 million pesos worth of silver per year, or about 25% of the silver production in the whole of New Spain—a very considerable amount, bearing in mind that each peso was then worth about a dollar.
By the 1760s, 16,000 people lived here. Overlooking an attractive small park in Bolaños is the rococo Guadalupe Chapel (the church of San José), a gift to the town from Antonio de Vivanco, owner of several mines. In 1789, de Vivanco became Marquis Vivanco, Viscount of Bolaños.The prosperity of these times is reflected in the sumptuous architecture of the buildings in Bolaños that date from this period. Two particularly fine examples are the Casa de la Condesa, and Antonio de Vivanco’s former home, with its unusual frescoes, both on the street which parallels the river. Bolaños even boasted a two-story Royal Mint, with a lovely facade. Built on one side of the main plaza in the 1750s, this partially restored gem has an Austrian Hapsburg two-headed eagle carved in the stone above its main door. This royal crest may have inspired the local Huichol Indians to use two and even four-headed eagles (a head for each cardinal direction) in their handicrafts.
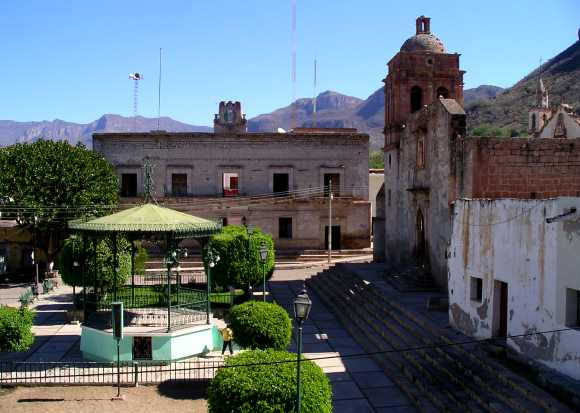
Main plaza in Bolaños. Photo: Tony Burton; all rights reserved
But the boom times of the 1750s were not to last for ever. Following a series of floods (the most serious of which occurred in 1757 and 1781), land disputes, the ever-increasing quantities of costly mercury required for smelting, and disagreements over mining rights, Bolaños’s first boom period came to an abrupt end. By 1798 the town was virtually abandoned. Its largest church, begun in 1778, still stands half-finished; today, this is probably the only place in the world where you can play basketball under floodlights in the shell of an ancient church!
A new company and British miners
British influence in Mexico quickly gained momentum following Mexico’s Independence in 1821. On 27 September 1821, Agustín de Iturbide entered Mexico City in triumph. Most gachupines (Spanish-born residents of Mexico) had fled with whatever assets they could muster back to Spain. The rest were expelled in 1829. Iturbide desperately needed funds, to pay his 80,000-strong army and to set up an administration but, after eleven years of war and chaotic politics, the nation was fatigued and the Treasury empty.
In order to stimulate the Mexican economy, Iturbide needed to revive the mines, many of which had been abandoned during the Independence War. However, the mines had drainage problems and needed large investments of capital. Mexico’s need, coupled with the aspirations and greed of England’s capitalists, proved to be an unstoppable combination. Between 1820 and 1824, no fewer than seven different mining corporations relying on U.K. capital were formed in Mexico. One of these was the Venture Company of the Mines of Bolaños.
The Bolaños Company commissioned a full inspection of their mines. This concluded that, given “modern technology”, a fortune in silver was awaiting exploration, with a potential profit of over a million dollars. The firm’s investors were happy to pour money into bringing British machinery and the ingenuity of expert tin miners from Cornwall to back up their intentions.
In the early days, it was difficult and even dangerous to travel to the mines. No fewer than 15 of the 45 Cornish miners who accompanied the first shipment of machinery for Bolaños in 1825, died through accidents or disease before taking up their posts.
Mine owners had their own agenda. Most insisted that their miners worked completely naked in an effort to thwart any attempted pilfering of ore. Miners grew ever more ingenious in trying to circumvent the rules. They were discovered concealing silver ore in their hair, hollowed-out hammer handles, their mouths and ears, and even, on one occasion, inside the disemboweled body of an overseer killed in an accident!
Despite all the problems the British were determined to succeed. They built a reservoir above the village of Tepec and then a five kilometer long canal, much of it underground, to bring water to the town of Bolaños. On the east side of the small church in Tepec, a camposanto (cemetery) was built specifically for the English miners and their descendants since they were not Catholics and should not therefore be buried in the town’s main graveyard.
To assist in drainage, the British assembled two massive hydraulic wheels, one 12 meters, and the other 14 meters in diameter. Their most important contribution, though, was to import a 32-ton steam engine from the U.K. It took 106 days for this engine to be hauled over the mountains from Veracruz. Locals say that the reason the San José church now has only small bells is because the large ones were melted down to make wheel rims to help move the steam engine.
Bolaños grew into a town of more than 30,000 people, with seven major mines in production, employing thousands of workers. However, despite the mammoth injection of British capital and technology, the company failed to extract enough silver to obtain any return on its investment. In 1842, amidst political rumblings after several accidents and a fire which cost the lives of more than 150 miners, and with the Mexican government delaying payments for silver bars “bought” by the Mint, the company was wound up and Bolaños once again echoed to the sounds of bird-song rather than of hammer, chisel and steam engine.
The town’s population declined to fewer than 5000. It became a ghost town, another casualty of the ever-changing fortunes of mining centers around the world. Various attempts to revive the mines in the late nineteenth century by North American interests came to nothing. At the end of the last century, a U.S.-Mexico joint venture mined successfully for some years but finally went out of production in about 1998. Today, Bolaños is still a small town, a mere shadow of its former self, though one offering a few small hotels and ample opportunities for adventure, eco- and cultural tourism.
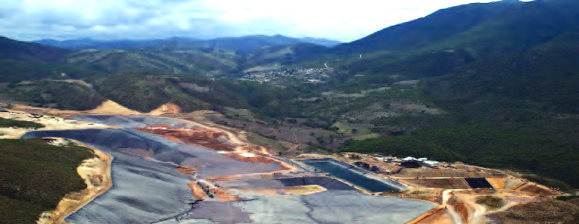
Twenty kilometers south of Bolaños, down the valley and past Chimaltitán, is San Martín de Bolaños. The El Pilón mine, near San Martín, opened in the 1980s, is the only mine currently operating in the valley. By 2007, it had produced over 30 million ounces of silver, as well as some ancillary gold.
A visit to this remote corner of Jalisco provokes deep feelings of admiration for the courage and audacity of all those who chose to settle here, including the nineteenth century British immigrants who left a Europe torn by upheaval, in search of fame and fortune in Mexico.
This is a lightly edited excerpt from chapter 23 of my Western Mexico: A Traveler’s Treasury (4th edition, 2013)
Other posts related to Bolaños:


