In October 2013, the protection status of the Nevado de Toluca, Mexico’s fourth highest peak, was downgraded from National Park to Wildlife Reserve (Area of Protection for Flora and Fauna).
On paper, this is a significant downgrade that may now open the door to greater economic activity in the former National Park area with adverse environmental consequences. In practice, it might turn out to be a blessing in disguise and herald the start of a more pragmatic approach to environmental protection.
Is this good news or bad? This post considers some of the possible implications of the volcano’s recent change of status.
El Volcán Nevado de Toluca
Background:
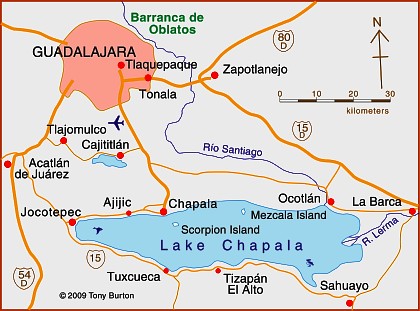
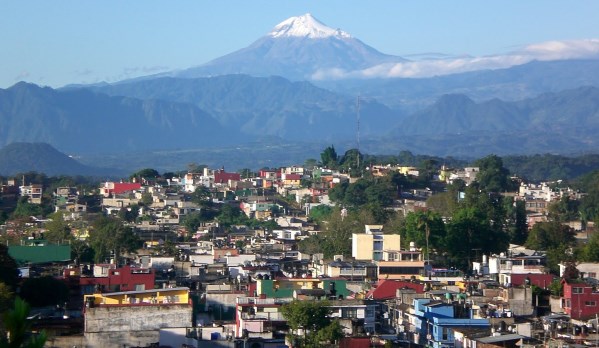
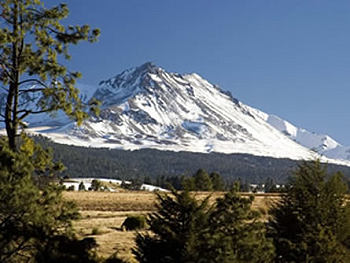
The Nevado de Toluca (also known as Chicnautécatl) is Mexico’s fourth highest peak, with a summit elevation of 4680 m (15,354 ft) above sea level. Located in central Mexico, southwest of the city of Toluca (the capital of the state of Mexico) and 80 km (50 miles) from Mexico City, the Nevado de Toluca is one of the most accessible volcanic peaks in the country. During the warmer months, regular vehicles can be driven very close to the volcano’s crater with its small lakes. During cooler months, when snow blankets the top portions of the mountain, the access road is popular with Mexico City families wanting to show their children what snow looks and feels like.
The area was granted National Park status in 1936, during the administration of President Lázaro Cárdenas, at a time when deforestation threatened to undermine the mountain’s ability to capture rainwater and be used as a water source for Mexico City and Toluca. (1936 was an important year in the history of environmental protection in Mexico because it was when the International Parks Commission was established which led to a series of protected areas–National Parks, Wildlife Areas and Forest Reserves–being established on either side of the Mexico-USA border).
The decree establishing the Nevado de Toluca National Park called for the expropriation of all the land around the volcano that was over 3000 m in elevation. The total area involved was about 536 sq. km. (207 square miles). While, for a variety of reasons, this expropriation was never fully implemented, deforestation of the volcano’s slopes was halted and tree-cutting banned.
In the succeeding decades, settlement expansion gradually ate away at the lower slopes with the result that the original National Park area now houses more than 5000 inhabitants in at least 16 distinct villages.
The newly designated Wildlife Reserve has a nucleus, centered on the crater, of 1.9 sq km, surrounded by a buffer zone of 51.7 sq. km.
A draft of the management plan for the Wildlife Reserve has been published by the National Commission for Protected Natural Areas (Comisión Nacional de Áreas Naturales Protegidas, CNANP) and made available for public consultation. The statuary 60-day consultation period began in mid-November.
The draft management plan [Map and plan both dated 5/11/2013] has met with considerable criticism in the popular press. The main issue is whether or not any such plan, however well intentioned, will be effectively enforced.
Several journalists have highlighted the very real danger that the new status will allow changes of land use in the former park that could lead to serious environmental degradation. The possible expansion of mineral extraction and of tourism within the Wildlife Reserve are of particular concern.
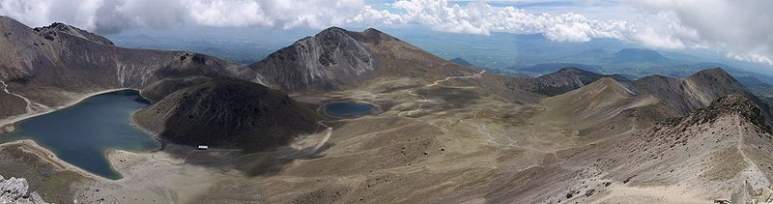
Nevado de Toluca Crater, June 1986. Photo: copyright Christopher Kessler (Wikimedia Commons)
Mining
In “Se tolerará la minería dentro del Nevado de Toluca“, Paris Martínez looks at the situation of several mining operations in the former park currently quarrying volcanic sand and gravel. Only one of these companies apparently had the requisite permit from the State of Mexico to quarry within the National Park area. The draft management plan allows all the quarries to continue operating for at least five years. Effectively, as Martínez points out, the change of status of the Nevado de Toluca means that mining operations that were operating illegally within the park are now “regularized”, for at least five years.
The main existing sand and gravel quarries are: El Atorón and Loma Alta in the municipality of Zinacantepec La Loba, El Capulín, Las Lágrimas (the only one with a state permit) and El Varal in Temascaltepec.
There are also reported to be many smaller illegal quarries extracting tepojal, a volcanic deposit similar to pumice, used in the construction industry. Unsupervised and unauthorized extraction is especially prevalent on the southern and eastern sides of the Wildlife Reserve.
Local residents say that quarrying, together with the construction of the access roads required to access the quarries, has resulted in serious environmental damage to the slopes of the volcano. Specifically, quarrying activities have led to:
- deforestation
- erosion, soil loss, degraded hydrology
- loss of soil water absorbing capacity
- particle emissions
- loss of slope stability
- visual pollution
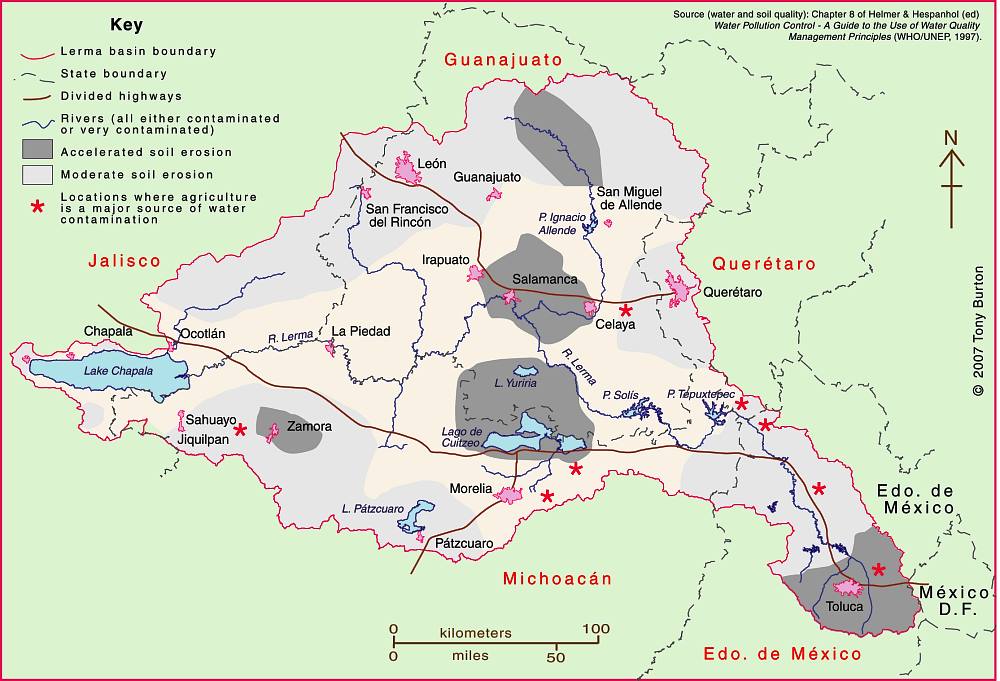
The impacts of quarrying are not confined to the slopes of the volcano. The increased erosion of the lower slopes has led to local streams having to cope with a higher sediment load, reducing their capacity to carry the heavy rainy-season precipitation. This has led to flooding damage downstream in municipalities such as Tenango del Valle, Calimaya and Rayón.
The management plan appears to lack a clear pathway for the regulation or limitation of quarrying activities. At the same time, it calls for short-term remediation of areas that have been subject to soil degradation, but only for former mining areas that are not currently being exploited. It does nothing to reduce soil impacts in areas where quarrying is ongoing.
While the management plan does not discuss how or when the quarries might be closed, it does propose establishing workshops to develop “alternative productive activities” for the owners of small quarries, to provide them with an alternative source of income. However, the workshops are only mentioned as part of the long-term plan, ie to be introduced at some point at least 5 years down the road.
What’s more, only one alternative productive activity – public use, open-air recreation and tourism- is actually mentioned in the plan, alongside those activities that would provide products or services for tourism. Surely the final version of the plan should also suggest other viable options?
The plan calls for compensation for the owners of property where quarrying is halted, and who opt for alternative activities. However, this too is only mentioned as part of the longer term plan, so many landowners may well be tempted to start mining in the interim, in order to be able to claim compensation in a few years’ time!
Tourism
The decision to change the protection status of the Nevado de Toluca was based on a commissioned study that showed the area had potential for “intensive tourism” and “private infrastructure”. The study identified potential “tourism nuclei” or “sites for intensive tourism” where the construction of cabins was considered “feasible”. Following criticism and opposition that included almost 30,000 signatures on a change-org petition, the draft Management Plan does not use terms like “intensive tourism” and states that “tourism developments and ski runs may NOT be built in the area”, nor may subdivisions, hotels, golf courses or weekend homes.
The draft plan calls for “low-impact tourism” which is environmentally aware, defined as being suitable for activities such as hiking trails, camping and bird-watching. The plan allows for this form of tourism to be developed in most of the core area of the crater of the Nevado de Toluca as well as in a 3-square-kilometer section on the slopes of the volcano. The plan also allows existing settlements (whose area is not precisely defined) to develop tourism infrastructure; this could easily result in some short-term land-grabbing. Equally, precisely what counts as tourism infrastructure is not clearly defined.
Accepting that the National Park was never adequately patrolled or regulated, then if the new Wildlife Reserve Management Plan is tightly written and backed up by effective monitoring and the enforcement of regulations, then the volcano’s change of status may yet prove to be the best way to preserve the mountain’s unique character.
The draft plan is a valuable step forward, but Geo-Mexico hopes that the final Management Plan will address the many concerns raised in the press, to the benefit of both the volcano itself and its local residents.
Thanks to Arq. Ricardo Warman for first alerting us to the Nevado de Toluca’s change of protected status.
Related posts:
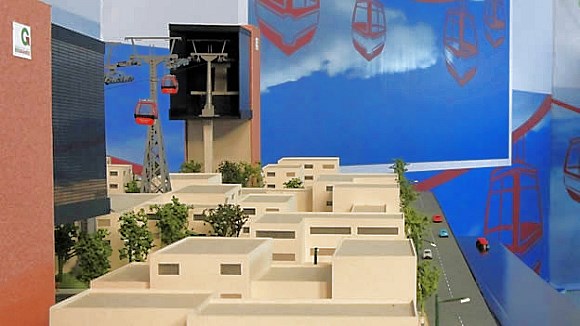 The cable car system will be similar to tried and tested cable car systems that have proved successful in Zurich (Switzerland) and Medellin (Colombia).