The world’s largest crystals and strange microbes grow in caves in Chihuahua, Mexico

 Excerpts from Geo-Mexico, Updates to Geo-Mexico  Comments Off on The world’s largest crystals and strange microbes grow in caves in Chihuahua, Mexico
Feb 182017
 

The Naica caves, in the northern state of Chihuahua are home to the world’s largest natural crystals. The crystals are selenite, said to enhance sex drive.

The formation of the crystals caves is described in more detail below, but in February 2017, Penelope Boston, head of Nasa’s Astrobiology Institute announced that “bizarre and ancient microbes” had been found in these caves. The discovery came after nine years of work and was first announced at the American Association for the Advancement of Science conference in Boston. The life forms in the Naica caves survive by living on minerals such as iron and manganese and could be 50,000 years old. The find is still subject to peer-review and independent confirmation:

How were the crystals discovered?

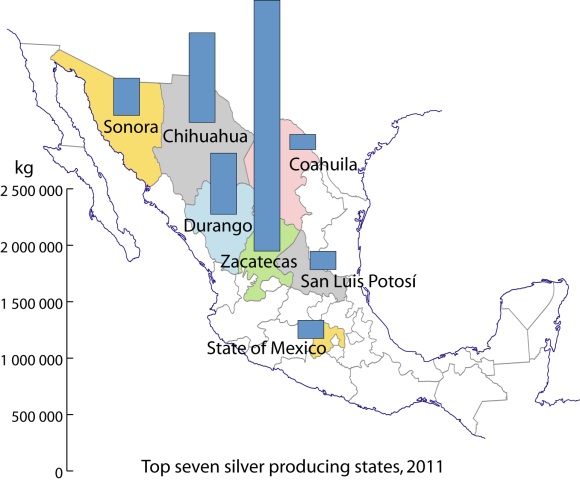
Early in 2001, news emerged of a truly extraordinary discovery in caverns deep under the earth in the state of Chihuahua. Miners tunneling through the Naica Hills, south of Chihuahua City, in search of silver and zinc, found huge mineral crystals, far larger than any natural crystals previously seen anywhere else on the planet.

Massive crystals in Naica Cave, Chihuahua

Massive crystals in Naica Cave, Chihuahua. Photo credit: Speleoresearch Archive and Films La Venta

The monster crystals, over six meters long, are made of selenite, a crystalline form of the mineral gypsum (the number one ingredient in blackboard chalk!). For its pale translucence, this form of gypsum is known as selenite, named after Selene, the Greek goddess of the moon.

The largest crystals are over 11 meters long, and weigh more than 55 tons. Scientists believe they have found DNA from ancient bacterial life trapped in air bubbles inside the crystals.

The crystals formed when the caverns were completely filled with hot water (warmer than 50 degrees C) supersaturated with calcium sulphate (gypsum) for very long periods of time. The estimated growth rate, confirmed by uranium-thorium dating, is 1.5 mm per 1000 years, which means that the longest crystals took more than 500,000 years to form.

The engineer working for the mining company Peñoles that first reported these caves believes that many more caves probably exist, but stresses that they would never have been located at all if it had not been for the mine’s massive pumps (pumping more than 16,000 gallons of water out each minute) working round the clock for years. This pumping has lowered the water table from 100 meters below the surface to about 300 meters in the area of the mines. Since the caverns have been drained, the crystals are no longer growing, and the temperatures in the cavern have fallen by about 0.5 degrees C each year.

The Naica (“shady place”) hills have been actively mined for more than a century. Even though early prospectors discovered silver here in 1794, the first formal mining claim was not made until a century later in 1896, by one Santiago Stoppelli, and large scale mining only began in 1900.

Ten years later, super-large sword-shaped crystals of selenite were found in a cavern at a depth of 120 meters. Over the years, a steady stream of geologists and mineral collectors have visited this 70-meter-diameter cave, since renamed the Cave of the Swords, which is now equipped with paths, lights and a ventilation system. Even with this system, the temperature in the cave is a stifling 40 degrees C! Several typical examples of selenite crystals from this cave, ranging in length from 1.2 to 1.6 meters (4 to 4.25 feet), are displayed in the Smithsonian’s National Museum of Natural History.

But these specimens from the Cave of the Swords are small fry in size when compared with the latest discoveries, 300 meters below the surface, in the Cave of the Crystals. In two relatively small chambers, each the size of a small apartment, miners found incredibly large selenite crystals, some over six meters long. The crystals combine to form massive fifteen-meter-long columns, “the size of pine trees”, as well as hundreds of formations shaped like sharks’ teeth, jutting about a meter up from the cave floor. The overall effect is, in the words of Richard Fisher, an Arizona-based photographer and adventurer, like walking into an enormous geode.

The Future

Mining operations at Naica have been in the hands of the Peñoles group since 1961 and the mine, one of the most productive in Chihuahua, still produces ample quantities of lead, silver and zinc.

Even if the silver ore is eventually worked out, Peñoles realizes that the caverns might have a very bright future as a major geo-tourist attraction. The company has not only taken steps to safeguard the crystals, but was already developing a tourism plan, which involved the installation of an air-conditioning system in the caverns, since the temperature in the Cave of Crystals is a mind-boggling 60 degrees Celsius. This heat, combined with the 100% humidity in the caverns, is so suffocating and disorienting that researchers can only safely spend a few minutes at a time studying this fantastic sight.

The harsh conditions have not deterred crystal looters who are already reported to be breaking through padlocked doors and trying to chisel prize specimens off the cave walls. This is a dangerous business and the effort proved fatal for one would-be collector when the gigantic crystal he was attempted to sever broke away from the ceiling and crushed him as it fell. The combined physical forces of Newton and Darwin caused this particular plunderer to meet his maker!

It was announced in October 2015 that Peñoles had been forced to close its Naica mine indefinitely, following its failure to reduce the level of water in the mine following a flood in January 2015. The company was seeking to redeploy more than 400 workers. In 2014, the Naica mine produced 19,694 tons of lead, 15,399 tons of zinc and 1.9 million ounces of silver (25% 6% and 3% respectively of the company’s total output of each metal).

Whether or not attempts will be made in the future to allow access to view the crystals is unknown. It is perfectly possible that other miners in the region might be lucky enough to find even bigger crystals nearby!

These cavers may never be suitable for sustainable tourism. To preserve these magnificent crystals for future generations, the decision may have to be taken to leave the caverns under water, protecting the crystals that already exist and allowing new ones to grow.

These amazing crystals are one of the latest additions to the incredible list of natural wonders that can be enjoyed in Mexico!

For truly amazing images of the crystals, watch the Discovery Channel documentary “Naica: Secrets of The Crystal Cave” (2008).

Note:

  • This is an update of a post originally published in 2010

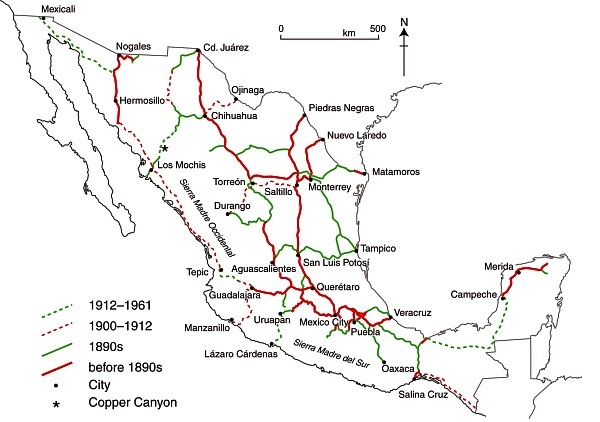
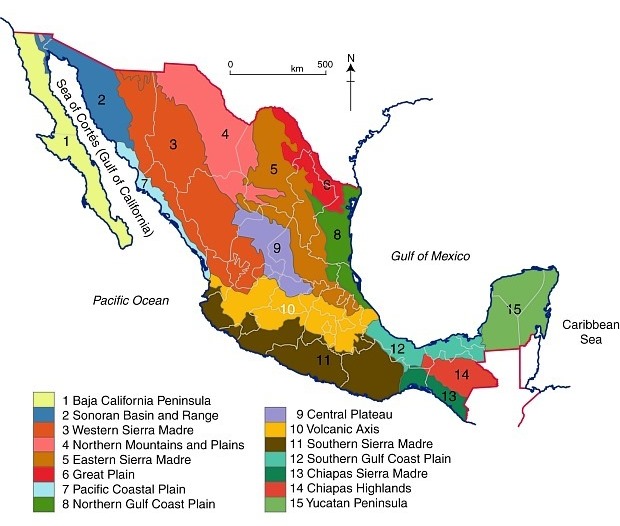
Mexico’s geology, relief and landforms are analyzed in chapters 2 and 3 of Geo-Mexico: the geography and dynamics of modern Mexico. Buy your copy of this invaluable reference guide today!

The pattern of Catholicism in Mexico

 Excerpts from Geo-Mexico  Comments Off on The pattern of Catholicism in Mexico
Jan 162017
 

The map shows the percentage of the population of each state who profess themselves to be Catholic. Mexico’s population is predominantly Catholic but Mexican Catholicism is extremely varied in practice. It ranges from those who support traditional folk religious practices to those who adhere to the highly intellectualized liberation theology.

Catholicism in Mexico

Catholicism in Mexico, 2010.

While the population remains predominantly Catholic, allegiance to the church has declined steadily since 1970. In 1970 96% of the population five years of age and older identified itself as Roman Catholic. By the 2010 census the figure had fallen to 84%. Though the proportion of Catholics is declining in Mexico, it is still considerably higher than in Mexico’s southern neighbors. For example, only about 70% in Guatemala are Catholic.

There are significant regional variations. Catholicism is strongest in a band of central-western states, extending from Zacatecas to Michoacán, where only one in twenty is not Catholic. In such areas, religion is a strong force in everyday life, with visible manifestations not only in the number of churches and other ecclesiastical buildings but also in the cultural importance and frequency of religious festivals and processions.

In contrast, about one in six is not Catholic in the northern border states. In southeastern Mexico (Chiapas, Campeche, Tabasco and Quintana Roo), about one in four is not Catholic. Interestingly, non-Catholics are concentrated in both the prosperous northern states and in the relatively poor south and southeastern states.

In summary, the pattern of Catholicism in Mexico exhibits a clear distance-decay pattern around the strongly-Catholic western states, with minor anomalies such as the state of Yucatán.

For more details, see these previous related posts:

Jun 202016
 

Mexico is the world’s leading producer of silver and has occupied top spot for several years. Mexico’s output of silver rose 2.0% in 2015 to 5,372 metric tons (189.5 million ounces). Mexico is responsible for 21% of global production, followed by Peru (15%), China (12%) and Australia and Russia (each 6%). About 70% of silver produced in Mexico is exported, the remainder is sold on the domestic market.

Global silver production fell slightly in 2015 due to decreased output from Canada, Australia and China. World demand for silver in 2015 reached a record 33,170 tons (1,170 million ounces), due to surges in three manufacturing sectors: jewelry, ingots and coins, and photo-voltaic solar panels.

The increased output in Mexico came from expansions in the Saucito and Saucito II mines, operated by Fresnillo, and the El Cubo mine, managed by Canadian firm, Endeavour Silver. A similar increase in production is predicted this year, given the on-going expansion of the San José mine, owned by Canada-based Fortuna Silver Mines.

Zacatecas is Mexico’s leading silver producing state (46.5% of total; see map), well ahead of Chihuahua (16.6%), Durango (11.3%) and Sonora (6.9%).

Silver production in Mexico, 2011. Data: INEGI. Credit: Tony Burton/Geo-Mexico

Silver production in Mexico, 2011. Data: INEGI. Credit: Tony Burton/Geo-Mexico

In Zacatecas, silver mining is especially important in the municipalities of Fresnillo (24% of total national silver production) and Mazapil (15%) as well as Chalchihuites and Sombrerete (3% each). The main silver mining municipality in Chihuahua is Santa Bárbara (3% of national total). In Durango, San Dimas and Guanaceví are each responsible for about 3% of national production, while the leading municipality for silver in Sonora is Nacozari de García (1%).

The legacy of silver

The importance of silver mining in colonial New Spain can not be over-emphasized. For instance, during colonial times nearly one third of all the silver mined in the world came from the Guanajuato region!

Even today, the cities and landscapes of many parts of central and northern Mexico reveal the historical significance of silver mining. The legacies of silver mining include not only the opulent colonial buildings in numerous major cities such as Zacatecas and Guanajuato, as well as innumerable smaller towns, but also the deforestation of huge swathes of countryside.

The landscape of states like San Luis Potosí, Zacatecas and Guanajuato was forever changed by the frenzied exploitation of their woodlands. Silver mines needed wooden ladders and pit props. The smelting of silver ore required vast quantities of firewood. Barren tracts of upland testify to the success of those early silver mines. Mining played a crucial role in the pattern of settlement and communications of most of northern Mexico. The need to transfer valuable silver bullion safely from mine to mint required the construction of faster and shorter routes (see, for example, El Camino Real or Royal Road, the spine of the colonial road system in New Spain), helping to focus the pattern of road and rail communications on a limited number of major cities.

Once workable ores ran out, smaller mining communities fell into obscurity and many became ghost towns. Some of these settlements, such as Real de Catorce and Angangueo, have enjoyed a new lease of life in recent years due to tourism.

The main town associated with silver and tourism is Taxco, the center of silversmiths and silver working in Mexico.

Mining towns described briefly previously on Geo-Mexico.com include:

Note: This is a 2016 update of a post first published in 2013.

Related posts:

Jun 132016
 

Mexico’s national electrical system serves about 97% of all Mexicans. In recent years electrical generation has not been able to keep pace with demand for electricity, which is increasing at about 6% to 7% per year. Attempts to increase private sector investment in energy as a means to keep up with surging demand have met opposition in the Mexican Congress. Under current law, private investors may generate electricity but transmission and distribution are restricted to the Federal Electricity Commission.

Mexico's major power stations. Fig 16-2 of Geo-Mexico; all rights reserved.

Mexico’s major power stations. Fig 16-2 of Geo-Mexico; all rights reserved.

About 30% of Mexico’s total installed electricity generating capacity of 60,000 MW comes from conventional power plants burning oil. Natural gas-fueled power plants account for about 35%, while coal plants contribute about 9%. Altogether, fossil fuel burning facilities account for almost three-quarters of Mexico’s generating capacity.

Many of Mexico’s newer power plants are highly efficient, gas-fired, combined cycle plants which integrate gas and steam turbines. On a per megawatt basis, they are relatively economical to build. Their major disadvantage (equally true for conventional thermo-electric power stations) is that their emissions contribute to air pollution (particularly sulfur dioxide) and global warming. About 25% of Mexico’s annual emissions of carbon dioxide are due to electricity generation.

Hydroelectric power has been important since the early part of the twentieth century. Currently about 22% of the electricity generating capacity is from hydroelectric plants. The largest hydroelectric plants are on the Grijalva River in Chiapas. Other rivers providing significant hydropower are the Balsas, Santiago, Fuerte, Papaloapan and Moctezuma.

Mexico has one nuclear power plant at Laguna Verde in Veracruz, which provides about 2.6% of the nation’s generating capacity. No additional nuclear plants are planned.

Mexico has the world’s second largest geothermal electrical potential, after Indonesia. This resource might be more important in the future but at present it accounts for less than 2.4% of Mexico’s electricity capacity.

The region of Mexico with most potential for wind power is the low-lying and flat Isthmus of Tehuantepec in southern Mexico where annual wind speeds, at a height of 30m (100 ft) above the ground (the height of modern windmills), average more than 30 kph (19 mph). Despite the success of the windfarms already operating in La Venta (Oaxaca) and Guerrero Negro (Baja California Sur), wind power is responsible for less than 0.05% of all electricity. The government hopes to boost wind power capacity significantly within the next five to ten years.

Most solar power interest is focused not on large scale plants but on small-scale photovoltaic (PV) systems providing electricity in remote rural areas. About 3 million people (3% of the population) live in small or remote settlements not yet connected to the national electricity grid. More than 60,000 PV systems have been installed nationwide, benefiting 250,000 rural inhabitants.

This is an excerpt from chapter 16 of Geo-Mexico: the geography and dynamics of modern Mexico. Buy your copy (Print or ebook) today!

Related posts:

Thirty years ago: the 1985 Mexico City earthquakes, a major disaster

 Excerpts from Geo-Mexico  Comments Off on Thirty years ago: the 1985 Mexico City earthquakes, a major disaster
Sep 172015
 

The worst earthquake disaster in modern Mexican history occurred thirty years ago this week. On Thursday 19 September 1985 a magnitude 8.1 earthquake struck at 7:19 a.m. and lasted a full two minutes. It was followed by a 7.5-magnitude earthquake 36 hours later.

Mexico's position in relation to tectonic plates

Mexico’s position in relation to tectonic plates.Map: Geo-Mexico.com; all rights reserved

These earthquakes resulted from the Cocos Plate (see map) pushing under the North American Plate. While the epicenters were 50 km off Mexico’s Pacific coast, near the Michoacán-Guerrero border, most of the damage occurred 350 km (215 mi) away in Mexico City because the city center’s subsoil, being former lakebed, is very unstable. The clay and silt beneath the city is up to 50 m thick in the area that received most damage. Geologists have likened the effects of the earthquake to the shaking of a bowl of jelly.

Further damage was caused by liquefaction, a process in which water is squeezed rapidly through the pore spaces in soil, dramatically reducing its cohesion. The sediments beneath Mexico City amplified the ground motions during the earthquakes and many buildings were stressed well beyond building code limits.

Damage from Mexico City's 1985 earthquake

Damage from Mexico City’s 1985 earthquake. Photo: Tony Burton; all rights reserved

Damage estimates range upward to 10,000 deaths, 50,000 injured and 100,000 homeless. More than 500 buildings collapsed, and a further 600 of the 3000 damaged structures were subsequently razed to the ground. The destruction was concentrated in a relatively small area near the city center and included many public buildings, such as government offices, as well as 11 hospitals and clinics, numerous multi-story apartment blocks, 11 hotels and 10 banks. More than 1600 school classrooms were damaged.

Buildings of between 6 and 15 stories were especially hard hit. The underbelly of the city was exposed; dozens of textile sweatshops were destroyed. The damages revealed many instances of poor construction standards and of poor enforcement of building codes. Well-built high rises such as the Latin American tower, designed to be earthquake-proof, were unscathed.

The total cost to the Mexican economy was estimated to exceed $5 billion, equivalent to 2% of the country’s GDP (Gross Domestic Product).

The disastrous 1985 earthquakes led to much tighter building codes, equal or superior to anywhere in the world, and to the formation of well-trained emergency search and rescue brigades. They also resulted in the establishment of a Seismic Alarm System which provides a 50-second warning for any earthquake measuring over 6.0 on the Richter scale occurring off the coast of Guerrero or Michoacán.

This is an excerpt from chapter 2 of Geo-Mexico: the geography and dynamics of modern Mexico.  Many more details of Mexico’s geology and landforms are analyzed in other parts of the book; take a look using Amazon.com’s Look Inside feature before buying your copy today!

Related posts:

Mexico’s urban hierarchy

 Excerpts from Geo-Mexico  Comments Off on Mexico’s urban hierarchy
May 072015
 

Mexico’s urban hierarchy is still very dominated by Mexico City, its primate capital city. Even though the Mexico City urban area (ZMCM) has grown relatively slowly during the past 30 years, by 2000 it had a population of 17.8 million, almost five times larger than Guadalajara, instead of twice as large as expected from the rank size rule.

The concept of urban hierarchy is more complicated than the rank-size rule, which is based solely on population size. Urban hierarchy is based more on the functions provided by urban centers and their relationships with their hinterlands. An urban hierarchy is conceptually similar to an organization chart or layered pyramid. At the top is the largest center, the dominant financial, economic, and often political center of the country. It has the widest range and most complex set of urban functions and services such as international banking, stock exchanges, trade organizations, and major media and communications centers. It is the center of power of the country: the place where the most important decisions are made.

Fig 21-2 of Geo-Mexico; all rights reserved

Fig 21-2 of Geo-Mexico; all rights reserved

At the second level are a few regional cities that are the centers of power in their region or hinterland. They provide high level services that are not available elsewhere in the region. Such services might include investment banking, an important international airport, as well as sophisticated business, legal and medical centers. At the third level are a larger number of subregional centers which are the focus of economic activity in their subregion. At each succeeding lower level, there are a greater number of centers serving as the economic foci of their smaller hinterlands.

Often a center’s population is a guide to its level in the hierarchy, but not always. Some centers may have a large population, but do not provide a wide range of key economic functions to surrounding areas. For example, Puebla is Mexico’s fourth largest urban area, but does not serve as a real center for a national region because it is so close to Mexico City. In other words, Mexico City is so economically dominant in central Mexico that Puebla has been unable to carve out a substantial hinterland of its own. The same can be said for Toluca, Mexico’s fifth largest urban area.

Tourist centers like Cancún and Acapulco are other examples of cities that have a reduced regional importance despite their relatively large populations. They provide vacation and recreation services for visitors from around the world. However, neither is a state capital, and they are not necessarily the key functional center in their respective regions.

Given their complexity, the specific delineation of urban hierarchies has often been as much art as science. So far, no uniformly accepted, easy to use criteria have been developed for this purpose. Efforts to delineate urban hierarchies have traditionally used information on the range of services provided; financial, communication and transportation flows; as well as a center’s location, its surrounding hinterland, and the distance to competing centers.

Mexico City is at the apex on the Mexican urban hierarchy; Guadalajara and Monterrey are key second level cities. Beyond these three centers, there is less agreement concerning the appropriate levels of other urban centers. Some think there are only two genuine level two cities, while others have argued that Toluca, Tijuana and Ciudad Juárez should also be considered level two cities. There is even less agreement when it comes to specifying cities in levels three and four. The exact delineation of the levels is less important than understanding the basic concepts of urban hierarchy and realizing that a city’s level is related to the range of functions it provides to its surrounding hinterland.

The suggested current urban hierarchy of Mexico (see map) is based on objective and subjective information on the urban center itself, as well as the population in its hinterland and its distance from a competing urban center. This hierarchy is only suggestive. Intermediate levels could be added indicating centers that could arguably be included in either the level above or level below.

The current hierarchy is not static and is very different from the urban system of the Colonial era, or even of the 19th century. The one constant is that Mexico City has always been at the apex of the hierarchy. The positions of  individual cities may change drastically with changing economic and political conditions. For example, Guanajuato was once an important level two city, but with the decline of its silver mines, it dropped below level five.

Related posts:

The spatial development of Mexico’s railway network

 Excerpts from Geo-Mexico  Comments Off on The spatial development of Mexico’s railway network
Dec 202014
 

At the end of the nineteenth century, during the successive presidencies of Porfirio Díaz, railway building leapt forward. Díaz aggressively encouraged rail development through generous concessions and government subsidies to foreign investors. By 1884 Mexico had 12,000 km of track, including a US-financed link from Mexico City to the USA through Torreón, Chihuahua and Ciudad Juárez. A British company had completed lines from Mexico City to Guadalajara, and from Mexico City via Monterrey to Nuevo Laredo.

Fig. 17.2 The development of Mexico's railway network

Fig. 17.2 The development of Mexico’s railway network. Copyright: Geo-Mexico; all rights reserved

By the start of the twentieth century, additional tracks connected Guadalajara, San Luis Potosí and Monterrey to the Gulf coast port of Tampico. A line connecting the Pacific and Gulf coasts was also completed. Durango was now connected to Eagle Pass on the US border. A second line to Veracruz was constructed, with a spur to Oaxaca. Laws passed in 1898 sought to bring order to the rapid and chaotic expansion of Mexico’s rail system. Foreign concessions were restricted. Subsidies were only made available for the completion of missing links such as lines to Manzanillo and the Guatemala border. Efforts were made to standardize track gauges.

After the Revolution, network improvements were hindered by poor administration, corruption, labor unions and a shift of government priority to roads. The west coast railroad from Sonora to Guadalajara was completed in 1927. The Yucatán Peninsula was joined to the national network in the 1950s and the famous Chihuahua to Los Mochis line through the Copper Canyon was completed in 1961, finally linking Texas and Mexico’s northern plateau to the Pacific Ocean.

Related posts:

Mexico’s golden age of railways

 Excerpts from Geo-Mexico  Comments Off on Mexico’s golden age of railways
Nov 302014
 

Early concessions (the first was in 1837) came to nothing. By 1860 Mexico had less than 250 km of short disconnected railroad lines and was falling way behind its northern neighbor, the USA, which already had almost 50,000 km. Political, administrative and financial issues, coupled with Mexico’s rugged topography, also prevented Mexico from keeping up with other Latin American nations. Mexico City was finally linked by rail to Puebla in 1866 and Veracruz in 1873.

In deciding the best route for the Veracruz-Mexico City line, Arthur Wellington, an American engineer, developed the concepts which later became known as positive and negative deviation. At first glance, it might be assumed that the optimum route for a railway is the shortest distance between points, provided that the maximum possible grade is never exceeded. Negative deviations lengthen this minimum distance in order to avoid obstacles such as the volcanic mountains east of Mexico City: the Veracruz line skirts the twin volcanic peaks of Popocatepetl and Ixtaccihuatl before entering Mexico City from the north-east. Positive deviations lengthen the minimum distance in order to gain more traffic.

Detail of lithograph by Casimiro Castro of Railway near Orizaba, Veracruz

Detail of lithograph by Casimiro Castro of Railway near Orizaba, Veracruz

At the end of the nineteenth century, during the successive presidencies of Porfirio Díaz, railway building leapt forward. Díaz aggressively encouraged rail development through generous concessions and government subsidies to foreign investors. By 1884 Mexico had 12,000 km of track, including a US-financed link from Mexico City to the USA through Torreón, Chihuahua and Ciudad Juárez. A British company had completed lines from Mexico City to Guadalajara, and from Mexico City via Monterrey to Nuevo Laredo.

Different gauge tracks typified a system based on numerous concessions but no overall national plan. By the turn of the century, additional tracks connected Guadalajara, San Luis Potosí and Monterrey to the Gulf coast port of Tampico. A line connecting the Pacific and Gulf coasts was also completed. Durango was now connected to Eagle Pass on the US border. A second line to Veracruz was constructed, with a spur to Oaxaca. Laws passed in 1898 sought to bring order to the rapid and chaotic expansion of Mexico’s rail system. Foreign concessions were restricted. Subsidies were only made available for the completion of missing links such as lines to Manzanillo and the Guatemala border. Efforts were made to standardize track gauges.

However, the country’s 24,000 km railroad network still had serious deficiencies. There were only three effective connections from the central plateau to the coasts. There were no links from central Mexico to either the Yucatán Peninsula or to the northwestern states of Nayarit, Sinaloa, Sonora and Baja California. The only efficient way to move inland freight from Chihuahua, Torreón, Durango or Ciudad Juárez to the Pacific was either north through the USA or all the way south and through Guadalajara to Manzanillo. The Sonora railroad linked Guaymas and Hermosillo to the USA, but not to the rest of Mexico.

Despite their weaknesses, railroads revolutionized Mexico. The railroads had average speeds of about 40 kph (25 mph) and ran through the night. They were five to ten times faster than pre-railroad transport. They lowered freight costs by roughly 80%. They shrank the size of Mexico in terms of travel time by a factor of between five and ten. They were also much cheaper and far more comfortable than stagecoaches. The estimated savings from railroad services in 1910 amounted to over 10% of the country’s gross national product. Between 1890 and 1910, the construction and use of railroads accounted for an estimated half of the growth in Mexico’s income per person. In addition, the railroads carried mail, greatly reducing the time needed for this form of communication. Clearly, the benefits of railroads far outweighed their costs.

Foreign companies gained mightily from their investments building railroads, which were almost entirely dependent on imported locomotives, rolling stock, technical expertise, and even fuel. But Mexicans also benefited enormously; in the early 1900s over half of the rail cargo supplied local markets and industries. The railroads thrust much of Mexico into the 20th century.

Cities with favorable rail connections grew significantly during the railroad era while those poorly served were at a severe disadvantage. The speed and economies of scale of shipping by rail encouraged mass production for national markets. For example, cotton growing expanded rapidly on irrigated farms near Torreón because the crop could be shipped easily and cheaply to large textile factories in Guadalajara, Puebla and Orizaba. Manufactured textiles were then distributed cheaply by rail to national markets. Elsewhere, the railroads enabled large iron and steel, chemical, cement, paper, shoe, beer and cigarette factories to supply the national market.

On the other hand, most Mexicans still lived far from railroad lines and relied on foot or mule transport while practicing subsistence agriculture. In addition, the cost of rail tickets was prohibitively expensive for many Mexicans; paying for a 70 km (43 mi) trip required a week’s pay for those on the minimum wage. The railroads greatly expanded the gap between the ‘have’ and the ‘have not’ areas of the country. Almost all the Pacific coast and most of southern Mexico did not benefit from the railroads. Such growing inequalities contributed to the Mexican Revolution.

After the Revolution, network improvements were hindered by poor administration, corruption, labor unions and a shift of government priority to roads. The west coast railroad from Sonora to Guadalajara was completed in 1927. The Yucatán Peninsula was joined to the national network in the 1950s and the famous Chihuahua to Los Mochis line through the Copper Canyon was completed in 1961, finally linking Texas and Mexico’s northern plateau to the Pacific Ocean.

In the second half of the 20th century, the rapidly improving road network and competition from private autos, buses and, later, airplanes caused railroad traffic to decline significantly. Freight traffic on the nationalized railroad maintained a competitive advantage for some heavy shipments that were not time sensitive, but for other shipments trucks became the preferred mode of transport. The current system, with its roughly 21,000 km of track, is far less important to Mexico’s economy than it was a century ago.

Related posts:

Mexico’s 15 physiographic regions

 Excerpts from Geo-Mexico  Comments Off on Mexico’s 15 physiographic regions
Jun 092014
 

The relief and landforms of Mexico have been greatly influenced by the interaction of tectonic plates.

The resulting relief patterns are so complex that it is often claimed that early explorers, when asked to describe what the new-found lands were like, simply crumpled up a piece of parchment by way of response.

The map below shows Mexico’s main physiographic regions. The core of Mexico (both centrally located, and where most of the population lives) is the Volcanic Axis (Region 10 on the map), a high plateau rimmed by mountain ranges to the west, south and east. Coastal plains lie between the mountains and the sea. The long Baja California Peninsula parallels the west coast. The low Isthmus of Tehuantepec separates the Chiapas Highlands and the low Yucatán Peninsula from the rest of Mexico.

Mexico's physiographic regions

Mexico’s physiographic regions. Color version of Figure 3.2 of “Geo-Mexico, the geography and dynamics of modern Mexico”; all rights reserved.

We looked in more detail at the Volcanic Axis in several previous posts, including

and will look more closely at some of the other physiographic regions in later posts.

The number of small farms in Mexico is growing

 Excerpts from Geo-Mexico, Updates to Geo-Mexico  Comments Off on The number of small farms in Mexico is growing
Mar 032014
 

The uneven distribution of farmland in Mexico was one of the fundamental causes of the Mexican Revolution in 1910, but by no means the only one. Landless campesinos (peasant farmers) lacked any way to control their own supplies of food. Revolutionary leaders called for the expropriation of the large estates or haciendas, which had been the principal means of agricultural production since colonial times, and the redistribution of land among the rural poor. A law governing this radical change in the land tenure system came into force in 1917 and the process has continued, albeit sporadically, into modern times.

About half of all cultivated land in Mexico was converted from large estates into ejidos, a form of collective farming. In most ejidos, each individual ejidatario has the rights to use between 4 and 20 hectares (10-50 acres) of land, depending on soil quality and whether or not it is irrigated. In addition, members of the ejido share collective rights over the use of local pasture and woodland.

By 1970 land redistribution had been more or less completed. Even so, most farming land still remained in the hands of a very small minority of farmers (Figure 15.2). Only 1% of farms were larger than 5000 hectares (12,355 acres) but between them they shared 47% of all farm land. Meanwhile, 66% of farms were smaller than 10 hectares (25 acres) yet they shared only 2% of all farm land.

Have things improved since then?

The 2007 farm census (see graphic) revealed that two-thirds (66.4%) of all farms are under 5 hectares (12.4 acres) in area; this percentage has remained roughly the same over the past 40 years. Between them, they farm just 6.2% of Mexico’s total farmland.

The number and size of farms, 2007

The number and size of farms, 2007 (updated Figure 15.2 of Geo-Mexico). Data: INEGI. Credit: Tony Burton / Geo-Mexico

The number of small farms has increased since 1970, but so has the total number of farms. Between 1991 and 2007, there was a 55.2% increase in the number of farms under 2 hectares in area, and a 45.4% increase in the total area they worked.

There is no solid data for why the number of microfarms has increased, but it may be partially explained by larger farms being split into smaller pieces (one for each family member) following the death of their original owner.

Most tiny farms are likely to be family-run, producing crops largely for subsistence, rather than for market. Small plots of land are likely to prove uneconomic and unsustainable to farm; it is impossible to generate sufficient profit from them for a family to enjoy a decent livelihood.

In one study, Enrique de la Madrid Cordero, writing for Financiera Rural, calculated that a typical smallholding of 5 hectares, planted with corn (maize) could generate a profit for the owner of about $4000 pesos. This profit represents 6 months work. At the time of his study, someone earning minimum wage for the same six months would have received a total of almost $10,000 pesos. The precise numbers vary, depending on average yields and the crops planted, but cultivating a smallholding is obviously not an easy way to make a living.

These same farmers are unable to advance since they have no means of accessing credit, having no suitable assets to offer as collateral, even if they could ever afford to pay the interest! Similarly, they do not have the savings to invest in improved equipment, higher cost seeds or to introduce new techniques or technology. They are, essentially, trapped in a cycle of poverty.

At the other end of the scale, a very small percentage of farms in Mexico are very large indeed. Nationwide, 2.2% of farms account for 65.1% of the total area farmed in the country. Larger farms are commercial operations, sometimes multinational operations. Their size and profitability ensures they have ready access to credit, and can adopt new technologies and methods relatively quickly.

The uneven distribution of land in Mexico clearly remains an issue, one that is likely to impact social justice agricultural output and productivity for decades to come.

Related posts:

Geo-Mexico has many other agriculture-related posts (easily found via our tag system). They include posts about the geography of growing/producing Christmas trees, cacao, honey, sugarcane, coffee, chiles, floriculture, tomatoes, tequila, horticultural crops and oranges. Also worth reading are:

Retirees and “residential tourism”: a case study of Chapala-Ajijic in Jalisco

 Excerpts from Geo-Mexico  Comments Off on Retirees and “residential tourism”: a case study of Chapala-Ajijic in Jalisco
Jan 162014
 

Retirees, mainly from the USA and Canada, form a special subgroup of tourists. About 1 million US visitors to Mexico each year are over the age of 60. Their total expenditure is about $500 million a year. Three-quarters arrive by air; half of these stay 4-8 days and almost one in ten stays 30 days or longer. Half stay in hotels, and one-third in time-shares; the remainder either stay with family or friends, or own their own second home. Of the 25% arriving by land, almost one in three stays 30 days or more. For Canadians, the patterns are broadly similar except that a higher percentage arrive by air.

The number of retiree tourists is relatively easy to quantify. However, it is extremely difficult to place accurate figures on the number of non-working, non-Mexicans who have chosen to relocate full-time to Mexico. Technically, these “residential tourists” are not really tourists at all but longer-term migrants holding residency visas. They form a very distinct group in several Mexican towns and cities, with lifestyle needs and spending patterns that are very different from those of tourists. Their additional economic impact is believed to exceed $500 million a year.

Map of Lake Chapala, Jalisco, Mexico

Map of Lake Chapala, Jalisco, Mexico. Credit: Tony Burton; all rights reserved.

The largest single US retirement community outside the USA is the Guadalajara-Chapala region in Jalisco, according to state officials (see map). The metropolitan area of Guadalajara, Mexico’s second city, has a population of about 4 million. The villages of Chapala and Ajijic (combined population about 40,000) sit on the north shore of Lake Chapala some 50 km (30 mi) to the south. Historically, Chapala was the first lakeshore settlement to attract foreign settlers, as early as the start of the 20th century. Today the area is home to a mix of foreign artists, intellectuals, escapees (of various non-judicial kinds), pensioners and ex-servicemen. In the last 40 years, Ajijic has become the focal point of the sizable non-Mexican community living on the lakeshore. Depending on how they are defined, there are probably between 6000 and 10,000 foreign residents in the Chapala-Ajijic area, the higher number reflecting the peak winter season. About 60% of retirees in the area own their own homes or condos, though many still own property in the USA or Canada as well, and many make regular trips north of the border.

The main pull factors for residential tourists are an amenable climate; reasonable property prices; access to stores, restaurants and high quality medical service; an attractive natural environment; a diversity of social activities; proximity to airports; tax advantages, and relatively inexpensive living costs.

David Truly has suggested that conventional tourist typologies do not work well with Ajijic retirees. He identified migrant clusters with similar likes and dislikes. Retirees vary in education, travel experience and how they make decisions about relocation. Early migrants tended to dislike the USA and Canada and adapted to life in Mexico. They were generally content with anonymity unlike many more recent migrants. Traditional migrants appreciate all three countries, but have chosen Mexico as their place of permanent residence. Many new migrants do not especially like the USA or Canada but are not particularly interested in Mexico either. They seek familiar pastimes and social settings and are content to have relatively little interaction with Mexicans.

The large influx of residential tourists into small lakeside communities like Ajijic inevitably generates a range of reactions among the local populace. From empirical studies of regular tourism elsewhere, George Doxey developed an “irritation index” describing how the attitudes of host communities change as tourist numbers increase. His model applies equally well to residential tourists. In the initial stage the host community experiences euphoria (all visitors are welcome, no special planning occurs). As numbers increase, host attitudes change to apathy (visitors are taken for granted) and then annoyance (misgivings about tourism are expressed, carrying capacities are exceeded, additional infrastructure is planned). If numbers continue to grow, hosts may reach the stage of antagonism, where irritations are openly expressed and incomers are perceived as the cause of significant problems.

Residential tourism in the Chapala-Ajijic area has certainly wrought great changes on the landscape. Residential tourists have created a distinct cultural landscape in terms of architectural styles, street architecture and the functions of settlements. (Browse the Chapala Multiple Listing Service New Properties). Gated communities have been tacked on to the original villages. Subdivisions, two around golf courses, have sprawled up the hillsides. Swimming pools are common. Much of the signage is in English. Even the central plazas have been remodeled to reflect foreign tastes. Traditional village homes have been gentrified, some in an alien “New Mexico” style.

On the plus side, many retirees, as a substitute for the family they left behind, engage in philanthropic activities, with a particular focus on children and the elderly. Retiree expenditures also boost the local economy. Areas benefiting from retirees include medical, legal and personal services, real estate, supermarkets, restaurants, gardening and housecleaning. Employment is boosted, both directly and indirectly, which improves average local living standards.

On the minus side, decades of land speculation have had a dramatic impact on local society. Land and property prices have risen dramatically. Many local people have become landless domestic servants, gardeners and shop-keepers with a sense that the area is no longer theirs. Crime levels have risen and some local traditions have suffered. The abuse of water supplies has resulted in declining well levels. Over zealous applications of fertilizers and pesticides have contaminated local water sources.

Other locations besides Chapala-Ajijic where a similar influence of non-Mexican retirees on the landscape can be observed include San Miguel de Allende (Guanajuato), Cuernavaca (Morelos), Mazatlán (Sinaloa), Puerto Peñasco (Sonara), Rosarito (Baja California) and Todos Santos (Baja California Sur). The most preferred locations are all on the Pacific coast side of Mexico.

As more baby-boomers reach retirement age, residential tourism offers many Mexican towns and cities a way of overcoming the seasonality of conventional tourism. Lesser-developed regions have an opportunity to cash in on their cultural and natural heritage and improve their basic infrastructure.

This is a lightly edited excerpt from chapter 19 of Geo-Mexico: the geography and dynamics of modern Mexico.

References:

  • Boehm S., B. 2001 El Lago de Chapala: su Ribera Norte. Un ensayo de lectura del paisaje cultural. 2001. Relaciones 85, Invierno, 2001. Vol XXII: 58-83.
  • Burton, T. 2008 Lake Chapala Through the Ages, an Anthology of Travellers’ Tales. Canada: Sombrero Books.
  • Doxey G.V. 1975 A causation theory of visitor‑resident irritants: methodology and research inferences. Proceedings of the Travel Research Association, San Diego, California, USA: 195‑8.
  • Stokes, E.M. 1981 La Colonia Extranero: An American retirement Community in Ajijic, Mexico. PhD dissertation, University of New York, Stony Brook, cited in Truly, D. 2002.
  • Truly, D. 2002 International Retirement migration and tourism along the Lake Chapala Riviera: developing a matrix of retirement migration behavior. Tourism Geographies. Vol 4 # 3, 2002: 261-281.
  • Truly, D. 2006 The Lake Chapala Riviera: The evolution of a not so American foreign community, in Bloom, N.D. (ed) 2006 Adventures into Mexico: American Tourism beyond the Border. Rowman & Littlefield: 167-190

Related posts:

Many Mexican Bracero workers still trying to claim their pay

 Excerpts from Geo-Mexico, Updates to Geo-Mexico  Comments Off on Many Mexican Bracero workers still trying to claim their pay
Nov 302013
 

In response to severe labor needs during the second world war, the governments of Mexico and the USA initiated the Bracero guest worker program in 1942. The program enabled Mexico to contribute to the war effort by sending temporary agricultural workers to the USA. Mexicans were granted renewable six month visas to work on selected farms. Most migrants under the Bracero program came from the same three states, Michoacán, Jalisco and Guanajuato. They worked mostly in California and other states along the Mexican border.

Los BracerosAs a result of the Bracero program, some farmers in the USA became very dependent on relatively cheap Mexican labor. The program was considered a great success by farmers. Unfortunately mistreatment of Bracero laborers was widespread. In protest, the Mexican Government threatened to stop the flow of migrants. During the war many Mexicans who were not recruited under the Bracero program entered the USA illegally looking for work. Tolerance for unauthorized migration developed on both sides of the border. With a large dependency in the USA on Mexican farm workers and a large supply in Mexico, there was virtually no way to put a halt to this migration stream.

Labor unions, churches and Latino groups in the USA opposed the Bracero program on the grounds that it held down farm wages and impeded the upward mobility of US Hispanics. They convinced the US Congress to halt the Bracero program in 1964. Between 1942 and 1964 an estimated 4.5 million Mexican Bracero workers entered the USA. At its height in the late 1950s more than 500,000 workers migrated each year. Most were temporary migrants who returned to Mexico within a year, often settling in larger cities, exacerbating the flow of migrants from rural areas to the growing cities. The Bracero program set the stage for the continued high volume of Mexican labor migration to the USA.

In an effort to ensure that the Bracero workers were only temporary migrants to the USA, the US government withheld 10% of all their earnings. The US government then remitted this amount to the Mexican government for payment to the workers on their return home. More than 70 years after the Bracero program started, many braceros are still trying to claim money that they earned legitimately years ago and that is still owed to them by the Mexican government.

The struggles of temporary bracero workers who were never repaid the 10% that had been withheld, are detailed in a short October 2013 article entitled “Bracero Guestworkers, Unpaid”, written by Adam Goodman and Verónica Zapata Rivera (history doctorate students at, respectively, the University of Pennsylvania and Mexico’s National Autonomous University).

The article also describes some of the other injustices faced by Bracero workers, including forced whole-body fumigation with DDT as they crossed the US border.

For more information about the Bracero program, see The Bracero Archive

Related posts:

The growth of the city of Monterrey, Mexico’s industrial powerhouse

 Excerpts from Geo-Mexico, Other  Comments Off on The growth of the city of Monterrey, Mexico’s industrial powerhouse
Oct 282013
 

A series of historical maps of the city of Monterrey was published earlier this year in the city’s online Catalog of Buildings of Historic and Artistic Importance in Barro Antiguo, The maps, dated 1765, 1791, 1846, 1865, 1922, 1933 and 1947 respectively, offer a good basis for considering the urban growth of Monterrey, the industrial powerhouse of northern Mexico.

In chapter 22 of Geo-Mexico, the geography and dynamics of modern Mexico, we explained why, “Monterrey does not fit the general Latin American urban model as well as Mexico City or Guadalajara. First, it never really existed as a colonial city. Secondly, its development was more heavily dependent on industry. Thirdly, its relative wealth and progressive leadership in some ways make it more similar to a North American city than a Latin American city. It fits the model only in that it developed a definite high status sector in contrast to lower status industrial sectors, and eventually became spatially fragmented.”

But just how did Monterrey develop as a city? In each of the following historical maps of Monterrey, Barrio Antiguo (16 blocks in size in the present-day city) is marked by a red quarter-circle, which is an easy way to check each map’s orientation and scale. Monterrey was founded in 1596. The earliest map in our series, for 1765, shows that, even by that date, Monterrey was still a relatively small settlement situated between a (seasonally dry) “stream formed by various springs” (to the top of the map, north) and the seasonally-dry “Monterrey River” (now called the Santa Catarina River). The Barrio Antiguo is shown as mostly an empty area, with only one major construction.

Monterrey 1765

Monterrey 1765

Very little has changed by 1791 (see map below: note that this map is oriented south-upwards), though the Barrio Antiguo has now been developed, and is shows as having several streets in a clear grid pattern:

monterrey-1791

Monterrey in 1791

The grid pattern for Barrio Antiguo is equally evident in the details of the map in 1846:

monterrey-1846

Monterrey in 1846

As of 1846, no development is shown on the south bank of the Santa Catarina River, though tracks are shown heading east and south-east respectively from the city. The next map, for 1865, shows that the city is beginning to expand to the south. A substantial settlement is developing on the south bank, more of less opposite the Barrio Antiguo. Note, though, that this map shows only part of the city:

monterrey-1865

Monterrey in 1865

Clearly, Monterrey only emerged as a real city after the colonial period which ended in 1821. The relatively small city did not experience real growth until late in the 19th century when it became connected by railroad and started to attract industrial development.

Early in the 20th century, investors built the then largest iron and steel works in Latin America a few kilometers east of the city center. Many related industries located nearby. These industries and the railroad, which ran east–west about four kilometers (2.5 mi) north of the city center, stimulated early industrial development in these directions. Developers established low income housing tracts for industrial and other workers on the east, north and west periphery of the city. Neighborhoods for the wealthier classes were developed south of the city center.

By 1933, Monterrey has grown significantly in area, especially towards the north:

monterrey-1933-whole-city

The city of Monterrey in 1933

Between 1933 and 1947, the city continues to expand, with many areas being infilled with residences:

monterrey-1947

The city of Monterrey in 1947

The city experienced another surge of industrialization and immigration in the 1950s and 1960s. Industrial development continued after 1970 when the national government implemented policies to shift development away from Mexico City. Monterrey became a major producer of steel, metal fabrication, cement, beverages, petrochemicals, food, telecommunications, auto parts, glass, and house furnishings. It also developed into a major financial center and one of the wealthiest and most progressive cities in the country.

Low income housing became a serious problem after the 1960s as the inner city tenements became extremely crowded. The government was not sympathetic to irregular housing schemes, so low income groups established numerous illegal squatter settlements on vacant land near the industrial zone. Government made a few efforts to remove these, but most survived and eventually became regularized.

The high status sector expanded south-west into San Pedro Garza García, which became one of the wealthiest municipalities in Mexico. The high overall income and wages in the city meant that many workers could afford home ownership and private automobiles. As a result, many gated communities (large and small) and suburban shopping malls were built around the urban periphery. The urban area became relatively fragmented with many low income residential zones located near high income areas.

Source of the maps used in this post:

Other posts about the urban geography of Mexico’s cities:

Why is northern Mexico a desert region?

 Excerpts from Geo-Mexico  Comments Off on Why is northern Mexico a desert region?
Oct 102013
 

Much of northern Mexico experiences either an arid (desert) climate (less than 250 mm [10 in] of rain/year) or a semiarid (semi-desert) climate (250–750 mm [10–30 in] of rain/year). Areas with an arid (desert) climate (see map) include most of Baja California and western Sonora (together comprising the Sonoran desert), as well as the northern section of the Central Plateau (the Chihuahuan desert). These areas can experience frost and freezing during the winter.

Major climate regions in Mexico. (Fig 4-5 of Geo-Mexico, the geography and dynamics of modern Mexico). All rights reserved.

Major climate regions in Mexico. (Fig 4-5 of Geo-Mexico, the geography and dynamics of modern Mexico). All rights reserved.

Areas of semiarid (dry steppe) climate include most of the Central Plateau as well as western sections of the Western Sierra Madre, northern Yucatán and scattered inland areas as far south as Oaxaca. The rains in this region fall mostly in the summer, and localized heavy thunderstorms are quite common. The southern parts of this climatic region are warmer than the northern parts. (Mexico’s seven climate regions)

Why do parts of northern Mexico receive very little precipitation, making them deserts?

The major reason is that the zone between the Tropic of Cancer (latitude 23.5 degrees N) and latitude 30 degrees N is influenced by the Hadley Cell. This is the name given to the atmospheric circulation in tropical regions, named after George Hadley, the English amateur meteorologist who first proposed its existence, in 1735.

The Hadley Cell

The functioning of the Hadley Cell

The Hadley Cell is the driving force behind many aspects of Mexico’s weather and climate. How does it operate? Solar heating is at a maximum near the equator and diminishes towards the poles. The area near the equator is the Intertropical Convergence Zone or ITCZ (see diagram). The heating of the ITCZ makes the air there rise, leaving an area of low pressure on the surface. This low pressure sucks in air along the earth’s surface from the subtropical high pressure areas about 30 degrees N and S of the equator creating the trade winds. The trade winds pick up moisture and latent heat over the oceans before converging from either side of the equator in the ITCZ. As the air in the ITCZ rises vertically, its water vapor condenses and rain falls from the towering convective clouds. This is the ascending limb of the Hadley cell. At a height of 10–15 km above the surface, the air, now minus its moisture, returns polewards as high level anti-trade winds. Sunbathers on Mexican beaches who notice two sets of clouds above them at different heights traveling in opposite directions are witnessing the trade winds and anti-trade winds in action.

In the subtropics, this air then descends again towards the surface to complete the cell and initiates the surface trade winds again. The descending air warms up as it sinks; its relative humidity decreases, and so no precipitation occurs; hence these high pressure subtropical areas are arid. Mexico’s arid and semiarid areas coincide with the descending air segment of the Hadley Cell and these high pressure subtropical areas.

In addition, the climate of the west coast of the Baja California Peninsula is influenced by the cool Californian current, which flows towards the south. The relative humidity of the air above it drops as the current enters warmer waters, so it is not likely to bring rain to the peninsula.

The aridity of the Sonoran desert is also partly due to its position in the rain shadow of the Western Sierra Madre. The Chihuahuan desert is in an even more marked rain shadow, protected by both the Western Sierra Madre and the Eastern Sierra Madre.

Stunning stream patterns in northern Baja California

Photographer Adriana Franco from Querétaro has taken several truly stunning artistic images of stream patterns in the semi-arid region of northern Baja California (near Mexicali). The photos, taken from an ultralight, show the details of the dendritic (= tree-like) stream patterns in this region. Dendritic stream patterns are common worldwide, but these images are exceptional. In general, dendritic stream patterns are associated with relatively gentle gradients where the underlying rocks are similar throughout the drainage basin.

Related posts

How globalized is Mexico?

 Excerpts from Geo-Mexico  Comments Off on How globalized is Mexico?
Aug 192013
 

What exactly is globalization?

Globalization can be defined in simple terms as “the process by which events, activities and decisions in one part of the world can have significant consequences for communities in distant parts of the globe.” [Peter Haggett in his Geography (A Global Synthesis), Pearson Education Limited, 2001]. Though globalization began centuries ago with colonial conquests and trade, it has only gained widespread attention in the past few decades.

Globalization is a highly contentious issue. There are major debates as to whether globalization brings more benefits than problems. While many international organizations such as the International Monetary Fund and World Bank are pro-globalization, many individuals and sectors of society remain deeply skeptical, and a powerful anti-globalization movement has arisen in some parts of the world.

How globalized is Mexico?

Several attempts have been made to quantify globalization. In this section we compare two indices which look at how globalized Mexico is compared to other countries.

The KOF Index of Globalization measures three main dimensions of globalization: economic, social and political. Economic globalization considers the long distance flows (exports, imports) of goods, capital and services, as well as political restrictions (tariffs, taxes) to these flows. Social globalization measures the international spread of ideas, information (telephone traffic, internet access) and people (migration, tourism). Several small European countries score well on these first two measures. Political globalization examines the number of embassies a country has, as well as its membership of international organizations and participation in UN peace missions. European countries occupy the first seven places on this dimension. Based on the indices for these three dimensions, an overall index of globalization is calculated.

The 2009 KOF Index used data from 2006 to rank 208 countries. Mexico placed 65th overall, with rankings of 79th for economic, 69th for social, and 80th for political globalization. By comparison, Russia ranked 61st, Argentina 63rd, Brazil 79th, China 91st, Indonesia 100th and India 122nd.

The A.T. Kearney Globalization Index has four main components: economic integration (trade, foreign direct investment), personal contact (telecommunications, travel, remittances), technological connectivity (internet) and political engagement (international treaties, organizations and peacekeeping). The 2006 index ranked 62 countries. Mexico placed 42nd overall, with ranks of between 36 and 41 for each of the four components. For comparison, Russia ranked 47th, Argentina 43rd, Brazil 52nd, China 51st, Indonesia 60th and India 61st.

In Mexico’s case, these two globalization indices give broadly similar results. The data suggest that Mexico is relatively globalized compared to other large emerging countries. However, in the case of the USA, the different methodologies of the two indices produce very different results. The KOF index ranks the USA as 38th out of 208, with rankings of 59th for economic, 56th for social and 9th for political globalization respectively. The A.T. Kearney index places the USA 3rd out of 62 countries, despite its ranks for separate components of 58th for economic, 40th for personal, 1st for technological and 41st for political globalization. The differences between the indices indicate the difficulty of quantifying globalization.

Related posts:

Mexico’s seven climate regions

 Excerpts from Geo-Mexico  Comments Off on Mexico’s seven climate regions
Aug 152013
 

Climatologists have developed several scientific systems to classify climates. The system developed by Wladimir Köppen in the early 20th century is one of the earliest and best known. The Köppen climate classification system assumes that climate is best reflected in native vegetation and can be accurately classified using seasonal variations in temperatures and precipitation. Mexican climatologists, including Enriqueta García, have proposed minor modifications to the Köppen system to make it more appropriate for Mexico. The following paragraphs reflect García’s revised Köppen system.

Given that Mexico has many mountains with rapid changes in elevation, temperature and rainfall, applying the Köppen system, even as modified by García, to Mexico can become extremely complicated. A relatively small area of Mexico may include several Köppen climate categories. Aggregating these areas provides a less complicated, more understandable, picture of Mexico’s climates (see map). In this scheme, Mexico has seven main climate regions, as shown on the map:

Major climate regions in Mexico. (Fig 4-5 of Geo-Mexico, the geography and dynamics of modern Mexico). All rights reserved.

Major climate regions in Mexico. (Fig 4-5 of Geo-Mexico, the geography and dynamics of modern Mexico). All rights reserved.

Two tropical climates

Mexico has two tropical climates which have average temperatures of over 18°C (64°F) for all twelve months of the year.

The first, tropical wet (Af in the Köppen system, see map), has at least 60 mm (2.4 in) of rain in every month of the year. This is the climate of the Amazon and Indonesian rainforests. In Mexico this is the climate of the Gulf Coast Plain in southern Veracruz and Tabasco (classic tierra caliente areas). It also occurs in the Oaxaca and Chiapas highlands. The rains fall all year, varying from about 120–150 mm (4–5 in) in April to 380 mm (15 in) in September.

The tropical wet-and-dry (Aw) category (see the climate graph for Cancún) has a pronounced dry season. The dry winter months typically get less than 40 mm (1 in) of rain, compared to over 150 mm (6 in) in each of the summer months. Parts of West Africa, Brazil and India have a similar climate. Much of coastal Mexico, stretching from Nayarit along the Pacific coast all the way to Guatemala, is in this category. It also covers many inland areas along the Pacific coast. Central and northern Veracruz and most of the Yucatán Peninsula also have this tropical climate with summer rains.

Climate graphs for three cities. (Fig 4.6 of Geo-Mexico,)

Climate graphs for three cities. (Fig 4.6 of Geo-Mexico, the geography and dynamics of modern Mexico) All rights reserved.

Two dry climates

Areas with an arid (desert) climate (BW) usually receive less than 250 mm (10 in) of rain a year (see climate graph for Ciudad Juárez). This is the climate of the Sahara Desert and Central Australia. In Mexico dry desert areas include most of Baja California, western Sonora, and the northern section of the Central Plateau. These areas can experience frost and freezing during the winter.

Areas with the second type of arid climate, semiarid (dry steppe) (BS), receive 250–750 mm (10–30 in) of rain a year. This is the climate of the African savanna lands and much of central Asia. In Mexico, this climate region includes most of the Central Plateau as well as western sections of the Western Sierra Madre, northern Yucatán and scattered inland areas as far south as Oaxaca. The rains in this region fall mostly in the summer, and localized heavy thunderstorms are quite common. The southern parts of this climatic region are warmer than the northern parts.

Three temperate zones

Temperate climates typically have average temperatures above 10°C (50°F) in their warmest months, and a coldest month average between 3°C and 18°C (27–64°F). Moisture characteristics distinguish between the three temperate climates.

The temperate with dry winters climate (Cw) is characterized by mild temperatures, low humidity, and summer rainfall ranging from about 600 to 1200 mm (25–45 in) per year (see climate graph for Guadalajara). This is classic tierra templada country. The low nighttime temperatures in winter are typically around 5°C (41°F). Of course, higher elevations have lower temperatures with occasional frost. The highest temperatures usually reach about 35°C (95°F), though temperatures may reach as high as 40°C (104°F). This climate is similar to that of the Kenyan Highlands. In Mexico, this climate includes parts of Nuevo León and Tamaulipas, most of the Western Sierra Madre and many mountainous areas in western, central and southern Mexico. Most of the Volcanic Axis is in this temperate with dry winters zone. Here, the major control as far as temperatures are concerned is altitude, which directly affects precise rainfall amounts and seasonality, resulting in a mosaic of microclimates and natural vegetation regions.

Compared with the temperate with dry winters climate, the humid subtropical (Cf) zone gets more rainfall, is more humid and gets rain throughout the year. The only areas of Mexico with this climate are the eastern slopes of the Eastern Sierra Madre and some parts of the southern mountain systems.

The Mediterranean climate (Cs) is the mild climate associated with Europe’s Mediterranean coast as well as the California coast. The area around Tijuana is the only part of Mexico with this type of climate. This area is relatively arid and gets less than 400 mm (15 in) of rain a year; it is unique in Mexico, being the only place that is dry in summer and gets rain only in winter.

Related posts

Does tourism in Acapulco match Butler’s resort cycle model?

 Excerpts from Geo-Mexico  Comments Off on Does tourism in Acapulco match Butler’s resort cycle model?
Aug 082013
 

Butler’s resort cycle model applied to Acapulco

Butler’s model (see graphic below) describes the evolution of a tourist resort. His model, similar to a product life cycle model, is quite a good fit with the evolution of Acapulco, a traditional resort which evolved over several decades.

Butler's Model applied to Acapulco (Geo-Mexico Fig 19.7; all rights reserved)

Butler’s Model applied to Acapulco (Geo-Mexico Fig 19.7; all rights reserved)

The model would not be expected to work as well with resorts such as Cancún and Huatulco, which were planned from the start and developed rapidly with the infusion of millions of dollars of federal funds.

In the case of planned resorts, the stages of exploration and involvement are unlikely to apply. The adapted model for such places might perhaps start at the development phase.

Reference for Butler’s Model:

Butler, R.W. 1980. The Concept of the tourist area cycle of evolution: Implications for management of resources. Canadian Geographer 24 (1): 5‑12.

Related posts

Aug 012013
 

Acapulco was Mexico’s first major resort. Overlooking the Pacific, Acapulco had been fashionable among wealthy Mexicans since the 1920s. The first road from Mexico City to Acapulco opened in 1927; this became a four-lane highway in the 1955 and is now a toll super-highway.

Acapulco, Mexico's first major resort. Photograph by Tony Burton. All rights reserved.

Acapulco, Mexico’s first major resort (Tony Burton; all rights reserved)

The development of Acapulco during the 1940s and 1950s, with new roads, hotels and an airport, provided alternative employment for peasants who had left their land, and helped to reduce the flow of migrants out of the poverty-stricken state of Guerrero. Some viewed Acapulco as a growth pole for further coastal development, but most other coastal towns continued to lag behind for decades. By the 1950s, it had become the playground for Hollywood’s jet set, the world’s first major resort to rely mainly on tourists arriving by air. In the 1960s, Acapulco’s city center was redeveloped and a new airport was built inland.

Acapulco began a prolonged period of stagnation during the 1970s, struggling to cope with urban growth, the provision of adequate urban services and air and water pollution. In the past decade, it has turned things around based on a series of major gated hotel developments that overcome visitors’ security concerns.

Related posts

Jul 242013
 

The map below shows a regional division of Mexico by precipitation regime (the amount and seasonal distribution of precipitation). The small graph for each region shows the typical average precipitation amounts for each month of the year. (For example, region A has most precipitation in the first three or four months of the year, and very little after that). The map comes from Ernesto Jáuregai’s 1970 article about wind and water erosion in Mexico (full reference is given below).

Precipitation regimes in Mexico (Fig 2 of Jáuregai 1970)

Precipitation regimes in Mexico (Fig 2 of Jáuregai 1970)

It is clear from the map that the distribution of precipitation across Mexico is very uneven. In general the north and central plateaus are dry while the southeast receives by far the most rain. Parts of Tabasco, Northern Chiapas and Veracruz get over 4000 mm (160 in) of rain a year. This is a direct effect of the onshore north-east trade winds, which collect moisture as they cross the Gulf of Mexico and then deposit it as they reach land.

Average annual rainfall figures conceal great differences from one year to the next. In general, the variability of rainfall is indirectly proportional to the long-term average. This means that areas with low totals tend to experience high variability, greatly increasing their drought hazard.

The map also reveals that there is a marked seasonality to precipitation in almost all of Mexico, with a clear division into a wet and a dry season. Most places get almost all their rain between June and October, while January through May are dry months. Because most rainfall is in the summer months, about 71% of rainfall evaporates soon after falling. This figure can be even higher in urban areas. Only about 26% runs off into rivers and lakes, and 3% seeps down to recharge subterranean aquifers.

One apparent anomaly to the pattern shown on the map is that the extreme north-west corner of Baja California (region A) has a Mediterranean climate where summers are dry and most rain falls in winter. Elsewhere in Mexico winter months are relatively dry. Southern and central Mexico have markedly dry winters, receiving less than 5% of their annual precipitation totals in the first three months of the year. The northern half of Mexico and the eastern coastal strip, including the Yucatán peninsula, have slightly more balanced precipitation, receiving between 5 and 18% of annual totals between January and March.

Map reference:

Ernesto Jáuregai. 1970. “La erosión hidráulica y eólica en México y sus efectos en las estructuras hidráulicas y en los núcleos de población.” UNAM: Boletín del Instituto de Geografía, Vol III, pp 39-60.

 Related posts

The three main causes of precipitation in Mexico

 Excerpts from Geo-Mexico  Comments Off on The three main causes of precipitation in Mexico
Jul 222013
 

The three basic types of rainfall (convectional, orographic and cyclonic) all play a role in determining the amount and timing of precipitation in Mexico.

Why does it rain?

In Mexico, most precipitation falls as rain, though snowfalls are not uncommon in parts of northern Mexico or at the highest elevations where air temperatures are cooler. For precipitation to occur, the air must first acquire moisture. Warm air absorbs water through evaporation from nearby bodies of water and through evapotranspiration from plants. The amount of water the air holds compared to the maximum amount it can hold at that temperature is the relative humidity. If warm moist air rises, it will cool. As it cools, its relative humidity rises. If relative humidity reaches 100% and condensation nuclei (particles such as dust or contaminants) are present, then water vapor will condense out of the air to form clouds. As clouds develop, water molecules coalesce until individual drops are heavy enough to fall out of the cloud as precipitation. Ice crystals fall as snow, water falls as raindrops, frozen ice pellets fall as hail.

For precipitation to occur, the weight of the individual drops must be sufficient for the effects of gravity to overcome the upwards thrust of the surrounding air. In very unstable conditions where air is rising rapidly, individual raindrops must become much larger before they can fall out of the cloud. The largest raindrops will have traveled up and down inside the cloud repeatedly, gaining size, before they finally fall to the ground. The same principle applies to hailstorms which gather an additional layer of ice for every trip they make inside the cloud before falling.

Though Mexico is considered to be relatively arid, the country as a whole receives an average of about 760 mm (30 in) of rain per year. This is a considerable amount of precipitation, almost exactly the same amount as Toronto, and considerably more than the average for either Canada or the USA.

Annual precipitation in Mexico (Fig .4.3 of Geo-Mexico)

Annual precipitation in Mexico (Fig .4.3 of Geo-Mexico, the geography and dynamics of modern Mexico) All rights reserved.

The three main causes of precipitation in Mexico

Convectional rain is associated with hot afternoons. During the morning, warm air near the surface collects great quantities of moisture. As temperatures increase towards mid-day, pockets of moist warm air are sent upwards, quickly leading to condensation and clouds. As the clouds continue to rise, they cool to the point where precipitation becomes inevitable. Afternoon and evening rain showers result, often heavy and accompanied by thunder and lightening. Convectional rain occurs throughout Mexico but is a summer phenomenon since this is the time of year when solar radiation and ground heating is at a maximum. The effects of convectional rain are enhanced by the presence at that time of year over southern Mexico of the Intertropical Convergence Zone, a broad belt of generally rising air which migrates seasonally either side of the equator.

Orographic rainfall, the second type of rainfall, is associated with mountains. Mountains block the movement of clouds and force them to rise. This has a profound impact on precipitation. As the clouds rise, further condensation occurs and precipitation becomes extremely likely, as they cool to the point where they can no longer hold their moisture. Therefore, it rains a great deal on the windward or wet side of the range. By the time the air passes over the mountain range to the other side, it has lost much of its moisture. As it descends, it warms up and its relative humidity falls, so that there is little chance of any precipitation on the leeward side, known as the rain shadow.

For example, the summer north-east trade winds blow moist clouds from the Gulf of Mexico towards the Southern Sierra Madre and Chiapas Highlands. The eastern side of these mountains receives heavy rainfall. The mountain slopes in central Veracruz, eastern Oaxaca and parts of Chiapas have about 150 cloudy days and get about 2000 mm (80 in) of rain a year. However, the western slopes get only half as much rain and have only 90 cloudy days a year. Orographic precipitation sets virtually all the rainfall and snowfall records, even more than hurricanes. Tenango, Oaxaca is the rainiest place in Mexico; it receives about 5000 mm (16.4 ft) of rain each year. The orientation of mountain ranges is therefore critical to understanding precipitation patterns. The differences between windward and leeward sides of a mountain range can be very dramatic. For instance, El Chico and Pachuca in the state of Hidalgo are only 10 km apart but have 1500 and 400 mm of precipitation respectively each year.

The third type of rainfall is called cyclonic or frontal precipitation. This is the form of precipitation brought by the mid-latitude storms known as nortes, and the tropical storms that sometimes evolve into hurricanes. Nortes occur when the polar air behind a cold front displaces the warmer surface air, forcing it to rise as the cool air pushes its way underneath. At the surface, a sudden drop in temperature and the advent of cold winds marks the passage of the front, followed by several days of overcast skies with light rains or drizzle, onomatopoeically called chipichipis in some areas of Mexico.

 Related posts

Jul 152013
 

More than a year ago, the World Trade Organization (WTO) sided with Mexico and appeared to finally bring to an end a long-running dispute between Mexico and the USA over “dolphin-safe” tuna. The WTO decision confirmed that the methods used by Mexico’s tuna fishing fleet met the highest international standards, not only for protecting dolphins but also for conserving other marine species.

Dolphin-safe-logoThe USA has now responded by strengthening the rules governing the use of “dolphin safe”, a label first established in 1990. According to Mexican officials, the changes effectively circumvent the WTO decision by establishing two distinct regulatory regimes, one for the Tropical Eastern Pacific Ocean area (where the Mexican tuna fleet operates) and another, much less restrictive, for all other regions.

Mexican officials argue that the second regime, which does not include independent observers, has been unilaterally established by the USA in order to protect its own tuna fleet which uses methods that are not environmentally sound.

Part of the conflict over “dolphin safe” tuna revolved around the very different methods of fishing employed in the two countries. Mexican tuna fishermen use the encirclement method which involves locating tuna by chasing dolphins that swim with the tuna schools. Large purse seine nets are then employed to scoop up the fish. Decades ago, this method did indeed result in many dolphins being caught as bycatch. This led to justifiable outrage from environmentalists and the “dolphin safe” system. It quickly led to Mexico’s fleets employing specially-adapted nets and changes in procedure to ensure that any dolphins accidentally trapped can escape or are released and returned (alive) back to the ocean. According to the best available data, these improvements quickly reduced dolphin bycatch to close to zero.

Most US tuna fishermen, on the other hand, rely on either long-line fishing, in which every species hooked is killed, or employ fish aggregating devices to encourage the tuna to school. Both methods used by US tuna fisherman kill many immature tuna as well as numerous other species, including sharks and marine turtles (especially the critically endangered Pacific leatherback turtles), as well as seabirds (especially albatrosses and petrels).

The WTO agrees with Mexico that the method used by its tuna fleet is the most sustainable of those permitted by the International Dolphin Protection Program, and protects not only dolphins but also avoids the bycatch of juvenile tuna, ensuring the long-term viability of the tuna fishing industry.

The WTO resolution appeared to finally end this acrimonious dispute which had begun thirty years ago and included a US embargo against Mexican tuna which lasted for more than a decade. It meant that Mexico’s tuna fishermen could legally stamp “dolphin-safe” on their exports to the USA, the world’s largest tuna importer, certifying that the tuna had been caught in full compliance with the International Dolphin Protection Program. The revised US rules mean that most Mexican-caught tuna will still not qualify for the “dolphin safe” label.

Mexico’s tuna catch (mainly yellowfin tuna) peaked at 166,000 tons in 2003 when more than 20,000 tons were exported, mainly to Spain, and has since declined to around 115,000 tons. About 20,000 families in Mexico depend on tuna fishing for their livelihood. This figure includes not only fishermen but also those working in associated processing and packing plants. Mexico’s 130-vessel tuna fleet is the largest in Latin America.

The USA-Mexico tuna war is a classic example of a cross-border fishing/trade dispute. The new US regulations mean that the ball is now firmly back in Mexico’s court. Mexican fishing officials were quick to criticize the new rules, but have not yet announced their next move in this long-running saga which looks set to rumble on for quite some time.

Want to find out more?

Related posts:

Mexico and the Happy Planet Index

 Excerpts from Geo-Mexico, Updates to Geo-Mexico  Comments Off on Mexico and the Happy Planet Index
Jun 202013
 

Chapter 30 of Geo-Mexico, the geography and dynamics of modern Mexico includes a look at the Happy Planet Index (HPI). The HPI is a compound index that combines three measures:

  • life expectancy
  • life satisfaction
  • ecological footprint

In essence, the HPI shows how successfully people are achieving the good life without having to consume a disproportionate share of the Earth’s resources. The unbridled global pursuit of economic growth over the past fifty years has left more than a billion people in dire poverty. Far from bringing economic stability, it has encouraged the rampant abuse of resources while increasing the very real risks of unpredictable global climate change.

The HPI attempts to quantify an alternative vision of progress where people strive for happy and healthy lives alongside ecological efficiency in how they use resources. A high HPI score is only possible if a country is close to meeting the targets for all three components.

Environmental Sustainability Index and Happy Planet Index for selected countries. (Geo-Mexico. Figure 30.4) All rights reserved.

Environmental Sustainability Index and Happy Planet Index for selected countries. (Geo-Mexico. Figure 30.4) All rights reserved.

HPI scores (see graph) paint a very different picture to that suggested by either the ecological footprint or the Environmental Sustainability Index (ESI). While happy and healthy lives often go hand in hand, many countries with high values for those components (such as the USA and Canada) have disappointingly high ecological footprints, and end up with low HPI scores. The lowest HPI scores of all are found in sub-Saharan Africa where several countries do badly on all three components.

At the other end of the scale, nine of the top ten HPI scores are for countries in Latin America and the Caribbean where relatively high life expectancy and high personal lifestyle satisfaction is combined with modest footprints. Mexico ranks 22nd of the 151 countries studied, behind Argentina and Guatemala but well ahead of the UK, Canada and the USA.

Life expectancy

The life expectancy figure for each country was taken from the 2011 UNDP Human Development Report and reflects the number of years an infant born in that country could expect to live if prevailing patterns of age-specific mortality rates at the time of birth in the country stay the same throughout the infant’s life.

Mexico’s life expectancy is 77.0 and ranks #36 among the 151 countries analyzed. This is below the USA, which has a life expectancy of 78.4, but higher than Malaysia, which has a life expectancy of 74.2.

Life satisfaction

The data for life satisfaction (experienced well-being) draws on responses to the ladder of life question in the Gallup World Poll, which was asked to samples of around 1000 individuals aged 15 or over in each of the countries included in the Happy Planet Index.

Mexico’s experienced well-being score is 6.8 out of a possible 10. This is lower than the average level of experienced well-being in the USA (7.16), but higher than that of Germany (6.72).

Ecological footprint

Ecological Footprint is a metric of human demand on nature, used widely by NGOs, the UN and several national governments. It measures the amount of land required to sustain a country’s consumption patterns. For a majority of the countries (142 of the 151), Ecological Footprint data were obtained from the 2011 Edition of Global Footprint Network National Footprints Accounts. For the nine other countries, Ecological Footprint figures were estimated using predictive econometric models.

Mexico’s Ecological Footprint is 3.30 global hectares per capita. If everyone in the world had the same Ecological Footprint as the average citizen of Mexico, the world’s Ecological Footprint would be 20% larger and we would need to reduce our Ecological Footprints by around 80% in order to stay within sustainable environmental limits.

Summary

In summary, countries often considered to be ‘developed’ are some of the worst-performing in terms of sustainable well-being.

Unfortunately, given that the HPI scores for the world’s three largest countries (China, India, and the USA) all declined between 1990 and 2005, it does not seem that the situation is improving or will improve any time soon. Business as usual is literally costing us the Earth.

Related posts:

Mexico and the Environmental Sustainability Index

 Excerpts from Geo-Mexico  Comments Off on Mexico and the Environmental Sustainability Index
Jun 132013
 

Environmental sustainability is a highly politicized term which almost all nations now eagerly claim as one of their goals. How true are these claims? The Environmental Sustainability Index (ESI) combines five major components (see diagram) which include 76 separate measurements in all. It assesses how close countries are to environmental sustainability. The ESI includes the ecological footprint but also looks at levels of pollution, susceptibility to environmental disruptions, the effectiveness of environmental policies and each country’s contribution to global stewardship.

Comparison of ESI components for Mexico, USA and Canada. (Geo-Mexico. Figure 30.5) All rights reserved.

Comparison of ESI components for Mexico, USA and Canada. (Geo-Mexico. Figure 30.5) All rights reserved.

The countries with the highest ESI scores are predominantly resource-rich nations with low population densities, such as Finland, Norway and Sweden. Some small wealthy states such as Switzerland also make the top ten. In general, densely populated countries such as India and Bangladesh do not score as well.

Mexico’s low ranking in the pilot 2000 ESI table led to Mexico’s Environment Secretariat (SEMARNAT) exploring ways to ensure that international organizations such as the World Bank and World Resources Institute had faster access to updated data from Mexico. Government policy was modified to embrace the use of quantitative environmental data relating to sustainability.

In terms of global stewardship, Mexico and the USA are closer to the target for environmental sustainability than Canada (see diagram). For reducing environmental stresses, Mexico and Canada are ahead of the USA. However, for the other three components, Mexico lags well behind both its North American partners.

Related posts:

May 132013
 

Mexican rivers are not well suited for navigation and thus have had only a minor influence on Mexico’s historical development. Their most important use has been as sources of irrigation water and hydroelectric power. Mexico’s annual flow of river water (roughly 410 km3) is about 25% more than the St. Lawrence River, but 25% less than the Mississippi River. Most of this flow is in southern Mexico which gets by far the most rainfall. Mexico’s dams have an installed capacity of about 11 gigawatts of electricity, roughly one fifth of the country’s total generating capacity; they don’t operate at full capacity, so they only generate about one eighth of total electricity. Only about a fifth of the total river water is consumed for other productive purposes. This proportion is far higher for rivers in drier northern Mexico where river flow is significantly smaller during the dry winter months.

Fig 6-3 of Geo-Mexico: Rivers of Mexico

Fig 6-3 of Geo-Mexico: Rivers of Mexico; all rights reserved

The two longest rivers in Mexico, the Rio Bravo (Rio Grande north of the border) and Colorado, start in the US state of Colorado (see map). The Río Bravo is about 3000 km (1900 mi) long and forms the border between Mexico and the USA for about 2000 km (1250 mi). Occasionally floods shift its location resulting in border disputes. Though it drains about a quarter of Mexico’s total area, its drainage basin is arid and its total flow is less than 2% of Mexico’s total. The Colorado River, which is almost entirely in the USA, formed a vast delta in the otherwise arid Sonoran desert in northern Mexico. The amount of water reaching Mexico has declined dramatically as a result of the Hoover and Glen Canyon dams and other diversions in the USA (see here, here and here). As a result delta wetlands have been reduced to about 5% of their original extent, and the potential water supply for the rapidly-growing urban centers of Mexicali, Tijuana, Tecate and Rosarito has been compromised.

Interestingly, the Mexican river with the greatest flow, the Grijalva–Usumacinta, does not start in Mexico either (see map). The river has a double name because it is actually a double river, with two branches of similar length which both start in Guatemala. Each branch flows about 750 km (465 mi) through Chiapas before they unite in Tabasco about 25 km from the Gulf of Mexico. Each of the two branches has a flow of about 14% of Mexico’s total. The flow of the combined Grijalva–Usumacinta River is about twice that of the Missouri River in the USA.

There are several other important Mexican rivers. The Lerma River starts in the State of Mexico and flows westward into Lake Chapala and continues to the Pacific Ocean with the name Santiago. The Lerma–Santiago River system is about 1280 km (800 mi) long, the longest river entirely in Mexico. It drains about 6% of Mexico. The Lerma–Santiago, which flows through several states, is one of the economically most important rivers in Mexico because it feeds some of the country’s prime agricultural areas as well as the two largest metropolitan areas: Mexico City and Guadalajara. However, its flow is quite small, only about 2% of the national total.

The flow of the Balsas River, south of the Lerma–Santiago, is about three times that of the Lerma–Santiago. Though it offers some white-water rafting and irrigation opportunities, it is not as important economically. There are numerous rather long rivers that also flow west to the Pacific from the Western Sierra Madre in northwestern Mexico, but these have relatively little water. There are also several rather long rivers in the north such as the Nazas that flow into landlocked basins and either die or feed small drying lakes.

Three major rivers flow into the Gulf of Mexico through the state of Veracruz. The Rivers Papaloapan and Coatzacoalcos start in Oaxaca and flow through southern Veracruz. Their combined flow is nearly 20% of the national total. The Pánuco–Tamesi–Moctezuma River system starts in the State of Mexico and carries nearly 5% to the Gulf of Mexico at Tampico.

Related posts:

The important role of telenovelas and historietas as forms of communication in Mexico

 Excerpts from Geo-Mexico  Comments Off on The important role of telenovelas and historietas as forms of communication in Mexico
Dec 312012
 

The highest rating programs on TV are televised novels, telenovelas. A telenovela is a limited‑run television serial melodrama, somewhat like a soap opera but normally lasting less than a year, and where the eventual ending has already been scripted.

image of los ricos tambien lloranThe first global telenovela was Los ricos también lloran (“The rich cry too”), originally shown in 1979. Telenovelas are now a $200 million market. Some critics claim they are effective promoters of social change, others deride them as being nothing more than mass escapism. Whichever view is more accurate, their portrayals reflect society’s values and institutions.

Advocates of telenovelas point to their role in challenging some traditional Mexican media taboos by including story lines about urban violence, racism, homosexuality, birth control, physical handicaps, political corruption, immigration and drug smuggling. Early telenovelas tended to be shallow romantic tales. The form subsequently evolved to include social commentaries and historical romances, some applauded for their attention to historical detail. Some were used for attempts at social engineering. An early government-sponsored telenovela promoted adult literacy programs. Several others openly advocated family planning and have been credited with contributing to Mexico’s dramatic decline in fertility rate. Other telenovelas have targeted younger audiences, focusing on issues connected to pop music, sex and drugs.

Rius historieta: The failure of education in Mexico

Rius historieta: The failure of education in Mexico

Besides the shallowness of the plot lines in most telenovelas, the other common criticism is that their stars are almost always white-skinned, blue-eyed blondes. Sadly, all too often, actors with indigenous looks are relegated to roles portraying menial workers such as home help or janitors.

Telenovelas have been extraordinarily successful commercially. They have become immensely popular not only in Latin America and among the US Hispanic population but also in more than 100 other countries, mainly in Eastern Europe and Asia.

In print media, a similar role to the telenovela has been played by historietas (comic books), the best of which have tackled all manner of social, political and environmental issues well before such topics made the main-stream press. Historietas helped educate millions of Mexicans and were also a commercial success. Their circulation peaked in the 1980s but has since declined due to competition from television and, more recently, the internet. The most influential creator of historietas is the cartoonist and writer Eduardo del Río (Rius) whose work earned him a 1991 United Nations Environment Programme prize.

Related posts:

The geography of music and dance in Mexico

 Excerpts from Geo-Mexico, Maps  Comments Off on The geography of music and dance in Mexico
Nov 272012
 

Numerous different regional music styles are found in Mexico (see map), some strongly influenced by indigenous instruments but most relying on the string and brass instruments brought by early Spanish settlers. Curiously, mariachi music, which is often considered Mexico’s national musical style, is believed to owe its origin to French immigrants and refer to wedding (mariage) music. Other popular music types include rancheras (country style songs), corridos (songs telling stories, often about heroes), norteño (northern), rock and pop.

Music and dance in Mexico.

Music and dance in Mexico. Fig 13.3 of Geo-Mexico, the geography and dynamics of modern Mexico. All rights reserved.

Musical instruments vary regionally as well. For instance, the marimba, a kind of wooden xylophone, is most often heard in Chiapas whereas the harp is more characteristic of Veracruz.

Regional dance styles have provided the stimulus for Mexico’s numerous baile folklórico (folkloric ballet) groups, many of which tour internationally. Some examples of regional dances are shown on the map.

Dance of the Quetzals, Cuetzalan, Puebla.

Dance of the Quetzals, Cuetzalan, Puebla. Photo: Tony Burton; all rights reserved.

Some of these dances are very localized. For example, the Quetzal Dance, with its elaborate headdresses (see photo)  is performed almost exclusively in the village of Cuetzalan in the state of Puebla.

In addition to these cultural manifestations there are significant spatial variations among many other facets of culture, including sport, dress, architectural styles and handicrafts. Regional differences are also found in some forms of literature.

Related posts:

How does Mexico’s telephone system compare with that in other countries?

 Excerpts from Geo-Mexico  Comments Off on How does Mexico’s telephone system compare with that in other countries?
Nov 192012
 

Mexico’s first telephone line was erected in Puebla in the early 1880s. Before long, the Mexican Telephone Company, a subsidiary of Bell, was operating in Mexico City. The first telephone lines did not work very well and were limited to downtown areas. Only public officials, police stations, a few select businesses and the wealthy used the telephone service.

The growth of telephony was slow because it lacked strong government support, was expensive and had a very limited range. By 1893 telephone services had spread to 13 more cities even though intercity lines would not become available until much later. In about 1950 all Mexico’s telephone companies were purchased by a single group of investors to form Teléfonos de México (Telmex) which established a monopoly. Even after the government nationalized the company in 1972, few incentives were offered for expansion and it was still almost impossible to obtain a new telephone line.

Access to fixed line and cell phones by country.

Access to fixed line and cell phones by country. Fig. 18.1 of Geo-Mexico; all rights reserved.

In 1990 Telmex was re-privatized in one of Mexico’s largest, most complicated and most controversial privatizations. The government sold majority voting rights and a 20% stake in Telmex to a consortium of investors for $1.8 billion and it sold $3.7 billion in shares to the public. The newly privatized Telmex invested significantly in the mid 1990s, enabling millions to get new lines but raising rates dramatically. Competitors were allowed to enter the telephone market but Telmex has remained the dominant player, especially for residential services. It remains fashionable for its customers to complain about its poor service and very high long distance rates.

Mexico and the USA are closely linked by telephone. Over 90% of the international calls from Mexico go to the USA whereas roughly 13% of all US international calls go to Mexico.

For a country of Mexico’s wealth and sophistication, it lags behind most of the world in telephony (see graph). In 2007, Mexico had 19 fixed telephone lines per 100 population compared to 53 in the USA and 56 in Canada. The Federal District had the best service with about 50 fixed telephone lines per 100 people, followed by Nuevo León with 33 and Baja California with 27. Chiapas had the fewest with only 5 per 100, not far behind Oaxaca with 6 and Tabasco with 7. Telephone communications are difficult or inconvenient in these southern states; this limits their residents’ quality of life and economic competitiveness. Other states with poor telephone service (less than 12 lines per 100 people) are Hidalgo, Zacatecas, Campeche, Tlaxcala, Guerrero, Veracruz and San Luis Potosí.

Mexicans have better access to cell phones than fixed lines with 63% of the population owning one in 2007, compared to 84% in the USA, 62% in Canada and a staggering 107% (more than one cell phone per person) in Argentina. While lagging slightly behind Guatemala where 76% of the population has a cell phone, a higher percentage of people in Mexico use cell phones than in China or India.

Cell phone use in Mexico has grown rapidly in the capital and other big cities but has also grown spectacularly in southern and rural areas where there are few wired telephones. Many rural villages with only a few fixed line phones now have dozens of cell phones, mostly used by those under age thirty. When asked why they don’t use cell phones more, some older rural adults say they find cell phones too complicated because of their many small buttons.

Many rural residents get cell phones from relatives who have migrated to the USA. They avoid monthly fees by buying pre-paid cell phone cards when they have the money. When the card runs out, they make no calls until they can afford to buy another one. Some enterprising rural residents use their cell phone as a pay phone. In short, cell phone technology has greatly improved communications in many Mexican rural areas.

Related posts:

Life expectancy and infant mortality: how does Mexico compare to other countries?

 Excerpts from Geo-Mexico  Comments Off on Life expectancy and infant mortality: how does Mexico compare to other countries?
Nov 032012
 

How long do Mexicans live? The 20th century brought dramatic increases in longevity. From under 30 years at the beginning of the century it rose to 38 by 1930. From there it went up to 50 by 1950 and reached 62 by 1970. By 2000 it was 72, almost double the 1930 value. Women live longer than men. Life expectancy for Mexican women is about 78; that for men is roughly 73 years. In the future Mexican longevity is expected to increase at about 2.5 years per decade. This is not as rapid as in the past but still significant.

Infant mortality and life expectancy for a range of countries and regions.

Infant mortality and life expectancy for a range of countries and regions, 2010. Fig 28.2 of Geo-Mexico; all rights reserved.

It is not easy to find an accurate and reliable indicator of health. One common indicator is infant mortality, the percentage of children who die before their first birthday. This usually provides a reasonable measure of the general quality of health in a society. Mexico has made impressive progress; its infant mortality rate dropped from 7.5% in 1970 to 1.7% by 2005. More improvements are expected in the years ahead.

Mexicans clearly are living longer and healthier lives than they did in past decades. How does Mexico compare to other major countries? Though Mexico trails Canada, the USA and Argentina (see graph), it is slightly ahead of Brazil, China and the weighted average for Latin America. Mexico is significantly ahead of Indonesia, the world average and its southern neighbor Guatemala.

Related posts:

Juchitán, Oaxaca: a town of sexual tolerance

 Excerpts from Geo-Mexico, Mexico's geography in the Press  Comments Off on Juchitán, Oaxaca: a town of sexual tolerance
Oct 182012
 

More than half (51.3%) of Mexico’s total population of is female. (There are 94.8 men for every 100 women.) However, with isolated exceptions, Mexico has been a male-dominated society for a long time and the spirit of machismo is still very strong in many parts of the country. There is ample evidence for this. For example, Mexico has never had a female head of state and very few female cabinet members have ever been appointed. There have been very few female candidates for president; they include Cecilia Soto González (1994), Dora Patricia Mercado (2006) and Josefina Vázquez Mora (2012). [Thanks go to Manuel and other alert readers for correcting an earlier version]. In business, male executives earn more than their female counterparts, though the wage differential is much smaller for lower-paid positions.

There are also vast differences across the country in the economic and social well-being of women. Some women, such as billionaire María Asunción Aramburuzabala, have proved that Mexican women can be incredibly successful in business, yet tens of thousands of women face a daily struggle against starvation and violence in the home.

The precise roles of women in Mexican society vary greatly from one region to another. The indigenous Zapotec community of Juchitán in the Isthmus of Tehuantepec region of Oaxaca is at one extreme. It functions as a matriarchal society where women play a much more important role than men in trading and decision-making.

Juchitán is also possibly the most tolerant place in Mexico in terms of attitudes to the gay and transgender community, especially to transvestite men, locally called muxes (pronounced moo-shays).

A 5-minute video, The Third Gender, produced by Deborah Bonello for GlobalPost, explores the extent to which the residents of Juchitán accept cross-dressing muxes as an integral part of society.

Want to read more?

  • Nicola Ókin Frioli. Princesses in a land of Machos (short essay and outstanding photographs by a highly accomplished photographer)
  • Bennholdt-Thomsen, V. 2005 A matriarchal society in the age of globalization: Juchitán/Southern Mexico.  Paper presented at 2nd World Congress on Matriarchal Studies, San Marcos and Austin, Texas. 2005
  • Isabella Tree. The women of Juchitán (Inside Mexico)
  • Marc Lacey. A Lifestyle Distinct: The Muxe of Mexico (New York Times)

Related posts:

Sep 172012
 

The 1991-96 cholera epidemic in Mexico originated in Peru in January 1991. It quickly spread northwards, reaching Central America by March and Mexico by July (see map). The cholera epidemic then spread slowly across Mexico before abating.

The spread of cholera in Mexico, 1991-1996

The spread of cholera in Mexico, 1991-1996 (Geo-Mexico Fig 18-6)

The incidence of cholera was much higher in the Gulf coast states than either inland or along the Pacific coast. By the time the epidemic was over in 1996, more than 43,500 cases had been reported in Mexico and 524 people had died.

Main Source:

PAHO 1997 (Pan American Health Organization) Cholera Situation in the Americas 1996, Epidemiological Bulletin, vol 18 (1)

Related posts: