Following our critique of the Maya Biosana chocolate megaproject (Maya Biosana or Maya Bio-Insana? Chocolate megaproject in Quintana Roo), a project which claimed it would plant four million cacao plants in four years, we have received additional information about developments in the Los Divorciados ejido where the project is based.
According to an insider, the project has now completely abandoned its plans for a massive cacao plantation. Jim Walsh, the former CEO of Maya Biosana, left the project in December 2012. Maya Biosana is now being managed by a Mexican firm AMSA (Agroindustrias Unidas de México, S.A. de CV) which is trying to convert the land into a profit-making venture producing corn and other grains.
Prior to the demise of the cacao megaproject, the organizers of Maya Biosana had released a short documentary detailing the project, and lauding its successful transformation of “a dwindling Mayan town” into a “now blossoming entrepreneurial city growing cacao fields and supporting their local community.” The film’s blurb claims that since the video was filmed, “the town has expanded and grown two-fold.”
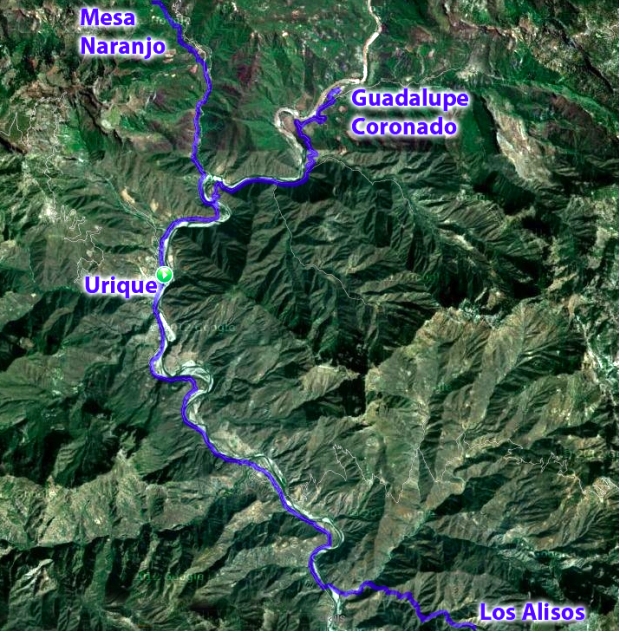
According to recent visitors to Los Divorciados (the ejido in question—see map), this could not be further from the truth. They report that in summer 2013, the Maya Biosana project, which had started out by employing around 200 people, now had 40 workers at most. One member of the group that visited Maya Biosana estimates, “based on the number of motorcyles parked there when we were there”, that the real workforce at Maya Biosana may be even smaller, perhaps 20-25.
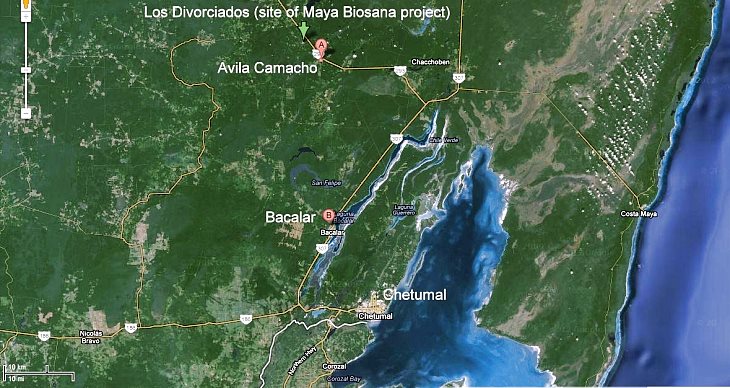
Google Earth image of southern Quintana Roo
The 13-minute documentary, “Maya Biosana – The Rebirth of Mexican Cacao, A short documentary,” can still be seen (as of August 2013) via http://intentionalchocolate-blog.com/2013/07/17/maya-biosana-the-rebirth-of-mexican-cacao-a-short-documentary/ on the Intentional Chocolate blog. However, note that many of the images included in the video are most definitely NOT from the Maya Biosana area, or even from Quintana Roo.
The film’s badly-written blurb claims that it, “follows Maya Biosana, as it repositions Mexico as the largest organic cocoa producer in the world and bringing the sacred plant back to it’s birth home. Improving the quality of life in Mexico with it’s vision of collaboration, co-creation and intention by providing the local and surrounding communities with a new model of business utilizing their own proprietary Well Being index as the marker of change.”
According to the Intentional Chocolate blog, “The film won the best short Award in 2012 at the Awareness Festival”, a claim it has also proved impossible to verify.
The original Maya Biosana is no more, but will the new management of this area by AMSA prove to be any better for the local ejidatarios than the original megaproject fiasco? We certainly hope so, but only time will tell.
In the interim, we received an e-mail a few weeks ago about a new megaproject underway in Avila Camacho, the next village to Los Divorciados (see map). Apparently, this megaproject is for plantations of exotic trees, which involves deforesting the jungle, extracting the wood, and planting a total of 6000 hectares with White Teak (Gmelina arborea, Spanish common name melina), a tropical hardwood, at the rate of 1000 hectares a year. So far, about 50 hectares have already been planted. The correspondent writes that they “stole the land of the Mayan people, cheating about the pay of rent: the rent is $45US for a hectare for a year. They are destroying the jungle and extracting the wood.” We have been unable to get independent verification of these claims as yet, but will continue attempting to do so.
Initially, some equipment from Maya Biosana was utilized on the Avila Camacho project, and our correspondent claims that it is the same Mexican-associated company that is responsible, though we have not yet been able to confirm this. According to a second source, the CEO of this project is Fernando Gonzalez, a “very good friend of Jim Walsh”, the former CEO of Maya Biosana, but there is no longer any direct connection between the two projects.
There may have been recent “developments” in this part of Mexico, but they certainly do not yet constitute any form of sustainable development.
Related posts: