admin

Jun 152015
 

Visitors to the De Young Museum in San Francisco can admire a wonderful mural showing the fauna and flora of the Pacific, painted by Mexican artist José Miguel Covarrubias (1904-1957) for the city’s 1939-1940 Golden Gate International Exposition on Treasure Island in San Francisco Bay.

Covarrubias Mural of the Pacific

Covarrubias Mural of the Pacific (Click image to enlarge)

Following conservation work performed by experts in Mexico, the mural is currently on loan to the De Young Museum from its owners, San Francisco’s Treasure Island Development Authority.

While the De Young Museum website continues to describe this mural as “one of a six-part series of fanciful, larger-than-life-size maps created by noted Mexican artist Miguel Covarrubias”, we sincerely doubt that these murals were ever really “larger-than-life-size”!

The mural is one of the five remaining murals painted by José Miguel Covarrubias for the exposition. The whereabouts of a sixth mural, which completed the series known as “Pageant of the Pacific”, are unknown.

The details are exquisitely painted, and the mural is as beautiful as it is educational.

covarrubias-flora-fauna-north-america-sm

Covarrubias: Mural of the Pacific (detail)

As ever-erudite Jon Haeber writes in his blog post about this mural, painted “at a critical juncture in America’s history”, its artist “was a confidante of Mexican greats Diego Rivera and Frida Kahlo. As a caricaturist for Vanity Fair and The New Yorker, it could easily be assumed that Covarrubias is largely ignored by fine art historians, but he was an anthropologist and geographer as much as he was an artist, which gave him a unique respect among art aficionados… Not only are they an informative lesson in Geography, but they are also a great piece of history – to say nothing about their creator.” [http://www.terrastories.com/bearings/covarrubias-art-forms-pacific viewed June 2015]

Covarrubias was indeed a geographer and ethnologist. Among other works, he authored Island of Bali (1937); Mexico South (1946); The Eagle, the Jaguar, and the Serpent – Indian Art of the Americas; North America: Alaska, Canada, the United States (1954); and Indian Art of Mexico and Central America (1957).

The temporary structures on Treasure Island were subsequently demolished and Covarrubias’ six murals sent to the American Museum of Natural History in New York. When they were brought back to California in the late 1950s, the series was missing the mural entitled “Art Forms of the Pacific Area”. The titles of the five surviving murals are The Fauna and Flora of the Pacific, Peoples, Economy, Native Dwellings, and Native Means of Transportation.

The River Santiago and the Juanacatlan Falls: from the “Niagara of Mexico” to the “Silent River”

 Books and resources, Mexico's geography in the Press  Comments Off on The River Santiago and the Juanacatlan Falls: from the “Niagara of Mexico” to the “Silent River”
Jun 112015
 

In summer 1987, while living in Guadalajara, I entertained a fellow UK geographer, who arrived with a long list of places he wanted to visit. Over the next few weeks, we ticked them off one by one. Near the end of his visit, he asked why I hadn’t yet taken him to see the famous Juanacatlán Falls, the “Niagara of Mexico”, despite them being in his “top ten” places to see. “OK”, I said, “let’s go!”

Traffic was heavy and as we drove across Guadalajara, I could see his impatience building. Finally, he asked me, “Where are they? How close are we?” I replied that we were “fairly close” but that I was absolutely certain that he would recognize them before they came into sight. A few minutes later and he screwed up his nose and said, “Ughh. What’s that smell?” “See?”, I said triumphantly, “I knew you’d recognize them before you saw them!”

Juanacatlán Falls in 1989. Photo: Tony Burton. All rights reserved.

Juanacatlán Falls in 1989. Photo: Tony Burton. All rights reserved.

Even thirty years ago, long before NAFTA, the Juanacatlán Falls were a sorry sight (and source of a worse smell). Since then, and since NAFTA, they have only become worse. These once-majestic falls, the first Mexican landscape on a postage stamp back in 1899, have been reduced to a trickle of foul-smelling effluent. At the start of the twentieth century, the falls provided hydro-electric power for Guadalajara and turned the wheels of a cotton and woolen mill, the ruins of which now stand to one side.

A recent piece of investigative journalism about the River Santiago, the river which created these waterfalls, makes for disturbing reading. It provides plenty of evidence that the rapid increase in factories along the river, mainly post-NAFTA, may have provided 50,000 new jobs, but has also led to worsening water quality to the point where exposure to the river presents a serious public health risk.

In “River of Death“, Steve Fisher lays bare the terrible reality faced by those living and working close to the river. This is a harrowing tale, with heart-rending testimony from several local residents. On a positive note, the related video, Fusion Investigates: Silent River (below) describes how Sofía Enciso and her family have defied death threats and are determined to confront the factories responsible, while demanding that the relevant authorities take action to enforce federal water quality regulations, and start to clean up the river.

Perhaps the most telling single statistic is that precisely zero companies were fined for failing to comply with water discharge regulations between 2005 and 2011.

In the video, the mayor of El Salto, the main town near the Juanacatlán Falls, claims that the river has become polluted in the past thirty years. I guess he must be too young to remember that they were seriously polluted long before that.

Is it too much to hope that the government, corporations and society in the El Salto area can all come together to remedy this appalling tale of willful mismanagement? Local residents are right to insist on the enforcement of existing water quality regulations and on the implementation of remedial measures to reverse the decline of this major river and its once-famous waterfalls. Even more importantly, urgent measures are needed to reverse the deteriorating public health situation faced by all those living or working nearby.

Related posts:

Jun 082015
 

Mexico’s official online database of all the country’s roads and highways has just been updated. As of May 2015, Mexico has a total of 322,859 kilometers of roads and highways.

They are all shown on a map accessed via this web-page. [Link to http://www.imt.mx/micrositios/sistemas-de-informacion-geoespacial/servicios-tecnologicos/red-nacional-de-caminos/ver-datos.html no longer working.]

Mexico's major highways (Fig 17-3 of Geo-Mexico, the geography and dynamics of modern Mexico).

Mexico’s major highways, 2009 (Fig 17-3 of Geo-Mexico, the geography and dynamics of modern Mexico). All rights reserved.

Here is a summary of some of the more useful statistics found in the database:

  • 158,180 km of paved highways, including
    • 48,685 km of federal highways,
    • 92,590 km of state highways
    • 9412 km of toll highways
  •  36,139 km of urban roads
  • 118,812 km of rural (unpaved) roads.

The highway network connects 25,844 places, and has links to 39 ferry routes. It also includes 847 toll stations, 3476 bridges and 178 tunnels.

According to the report, Mexico currently has 6480 gas stations. However, this number is expected to increase rapidly in the next few years as competitors enters a market over which PEMEX previously held a monopoly, prior to recent energy reform laws.

If you are planning to drive across Mexico, then the online system at http://ttr.sct.gob.mx/mappir/ will give you routes, distances and estimated times and costs.

Further reading:

Earthshots: Satellite Images of Environmental Change: Angangueo, Mexico

 Books and resources  Comments Off on Earthshots: Satellite Images of Environmental Change: Angangueo, Mexico
Jun 042015
 

In 2015, the USGS published a series of satellite images of environmental change [no longer online] of the area around the town of Angangueo in the eastern part of the state of Michoacán (very close to the border with the State of México) and the mountainous hillsides covered in pine-fir forest where the migrating Monarch butterflies spend their winters.

The pine-fir forests are found at an elevation of around 3000 meters (10,000 feet) above sea level. The butterflies congregate in a small number of locations, forming massive clumps on the trees. Any major disturbance, such as a windstorm or excessive snow, can cause the loss of (literally) millions of Monarchs. The overwintering Monarchs need just the right range of temperatures. On the one hand, they must not be so cold that they freeze or are not warm enough to flutter in search of food and water. On the other hand, if it is too warm, they may burn through their energy reserves or need to replenish too much moisture. The canopy of the pine-fir forest provides some protection, but even a partial thinning of this canopy will change the microclimate beneath.

In this post, we will will take a quick look at the images of Chincua reserve. This reserve includes the location where overwintering congregations of Monarch butterflies were reported for the first time in the mid-1970s. This is one of the areas where conservationists fear that the pine-fir forest (appearing vibrant red in the images) may have suffered too much clearing and thinning, which may have altered the area’s microclimate and made it unsuitable for successful overwintering.

When looking at the images, bear in mind that:

    • Red signifies healthy vegetation.
    • Landsat images are always taken in mid-morning, so shaded northwest slopes look darker. Shadows can vary slightly from one month to the next.
    • The images show forest clearance, but do not reveal forest thinning. The consequences of forest thinning (the removal of individual trees) may be just as significant in the context of the annual Monarch butterfly migration.
Satellite images of Chincua reserve, 1986, 2000 and 2011.

Satellite images of Chincua reserve, 1986, 2000 and 2011. Click to enlarge.

In the 2000 image, the Chincua reserve shows some rashy gray areas just above and to the right of the center of the image. These gray areas are not visible on the 1986 image. This may be evidence of a fire, or some other kind of clearing. The 2011 image seems to indicate that the vegetation in that area has recovered, at least to some extent.

A truly detailed examination of these images is beyond the scope of this short post, but high-resolution images (which can be downloaded from the USGS site) will repay a closer study. See, for example, the satellite images of Pelon.

Finally, it is worth remembering that the Monarch as a species is not endangered. There is, indeed, a year-round population of Monarchs in central and western Mexico that is non-migratory owing to the ready availability of milkweed, the only plant on which female Monarchs lay their eggs, throughout the year. It is only the butterfly migration that is considered an “endangered phenomenon”, and all three countries involved (Canada, USA and Mexico) have now instituted programs to try to ensure its long-term success.

Satellite monitoring of the areas of importance to the Monarch butterfly should help identify the key areas on which conservation efforts need to be focused.

Related posts:

Mexican-themed garden wins gold at UK’s Chelsea flower show

 Mexico's geography in the Press  Comments Off on Mexican-themed garden wins gold at UK’s Chelsea flower show
Jun 012015
 

The U.K. has declared 2015 as the “Year of Mexico” and is hosting numerous cultural and trade events this year related to Mexico. Not to be outdone, a Mexican-themed Pavilion exhibit has won gold at the prestigious Chelsea Flower Show, held in London in May. The show is organized each year by the Royal Horticulture Society and was first held more than a century ago.

The gold-medal winning garden design in 2015 was based on a very unusual garden created in Mexico by the eccentric Englishman Edward James at “Las Pozas” (the Pools), the home he built near Xilitla in the state of San Luis Potosí. James (1907-1984) was a sponsor of the surrealist art movement, as well as a surrealist artist in his own right. His entire estate in Mexico became his canvass for a marvelously-creative collection of sculptures and follies set in luxuriant, semi-tropical jungle.

The winning garden at Chelsea, entitled “Surreal Pillars of Mexico,” was designed by Jon Wheatley and sponsored by HSBC and the U.K.’s National Dahlia Collection. The dahlia is Mexico’s national flower:

Chelsea Garden Show

Surreal Pillars of Mexico (partial view)

“Surreal Pillars of Mexico” had a circular structure and pillars that emulated Edward James’s garden in Mexico. It included 50 different types of dahlias, surrounded by over 100 plants and vegetables such as lettuce, cactus and the exotic agave plant.

New varieties of dahlias, first described in Mexico in 1529, had been developed via selective breeding and propagation programs even in pre-Columbian botanical gardens. The dahlia arrived in the U.K. in the early nineteenth century, via Spain and only after several unsuccessful attempts at introducing it. The National Dahlia Collection in the U.K. cultivates and promotes the flower; all the varieties existing in the U.K. originated from just three types of dahlias.

The Year of Mexico to the United Kingdom includes more than 100 separate exhibitions, concerts, festivals, academic workshops and artistic residencies; as well as trade missions, research projects, grants and scholarships. These shows will highlight the creativity of Mexican writers and artists, while also showcasing the country’s history and its modern-day industrial strength.Events are being held at a number of cities, including London, Cardiff, Edinburgh, Belfast, Manchester, Oxford, Liverpool and Birmingham.

Related posts:

May 282015
 

Remittances sent home by Mexican migrants (almost all of them residing in the USA) rose to $2.26 billion in March 2015, 7.6% higher than the same month a year earlier. This was the highest monthly figure since May 2012, and the highest ever figure for March.

The average remittance sent to Mexico in March 2015 was $311.30, the highest figure since July 2012, and the number of transfers was 7.25 million.

The March figure brought the total remittances for the first quarter of this year to $5.7 billion, 4.9% higher than the same period in 2014.

Workers in California sent remittances worth $1.59 billion home during the first three months of this year, more than the workers in any other state. Texas came in second place with $763.9 million and Illinois placed third at $199.3 million.

The three main receiving states in Mexico were:

  • Michoacán – $603 million
  • Jalisco – $539 million
  • Guanajuato – $509 million

For an introduction to the topic of remittances, with links to some of the key posts on this blog, see

A comprehensive index page listing all the posts oon Geo-Mexico related to migration and remittances can be found at Migration and remittances: an index page.

May 252015
 

The Mexican government is funding a 100-million-dollar project to build Mexico’s first cruise ship home port at Puerto Peñasco (Rocky Point) in Sonora on the Sea of Cortés (Gulf of California). Construction began in 2013 and is scheduled to be completed by early in 2017.  Proponents hope that the port will help transform the existing town (population about 60,000) into a fully-fledged tourist resort, taking advantage of its proximity to Phoenix and Tucson in Arizona. The project includes a state-of-the-art terminal and convention center.

pinacate-map-google

The town already has a small international airport, inaugurated in 2008, which has a daily capacity of 2000 passengers and would need to be expanded if the port takes off.

Puerto Peñasco has an embryonic tourism industry at present, mainly attracting Arizonans (it is their nearest beach), fishing enthusiasts, and school and college students during spring-break (attracted, in part, by the legal drinking age being 18 in the town, compared to 21 in Arizona).

puerto-penasco

Puerto Peñasco also has research stations of the Universidad de Sonora: its Centro de Investigaciones Científicas y Tecnológicas (Scientific and Technological Research Center) and its Centro de Estudios del Desierto (Center for Desert Studies).

According to cruise line statistics, the number of Mexicans taking cruises in 2014 rose by 15%, but analysts argue that many Mexicans stay at home and are unable to take cruises at present because they lack a U.S. visa. Establishing a home port in Mexico, they argue, would therefore open up a significant new market. A cruise ship port at Puerto Peñasco would clearly have immense impacts on the town, boosting the local economy and generating up to 2,500 direct and 5,000 indirect jobs.

However, critics say this will come at a cost. They cite potential problems related to local residents, wildlife and biodiversity. They fear that development of the town will raise property prices beyond the level of affordability of local residents. A Tucson-based non-profit, The Intercultural Center for the Study of Deserts and Oceans is working with local fishermen and government agencies to “empower coastal communities in the Northern Gulf of California region with the knowledge and tools to create sustainable livelihoods that exist in concert with the surrounding natural and multicultural environment”. The research center believes the port development will lead to environmental changes adversely affecting important fishing grounds. The center has also expressed concern about the potential hazards to nesting sites used by sea turtles.

Related posts:

Mexico attracting significant inflows of FDI

 Mexico's geography in the Press, Updates to Geo-Mexico  Comments Off on Mexico attracting significant inflows of FDI
May 212015
 

According to the 2015 Direct Foreign Investment Confidence Index of consultancy A.T. Kearney, Mexico is currently the ninth most attractive country worldwide for FDI (Foreign Direct Investment). Mexico has risen 3 places in the rankings since the 2014 Index was released.

The report highlights the improving business climate in Mexico following the implementation of the government’s reform agenda, and says that “investors continue to be drawn to opportunities in many sectors, including manufacturing, energy, and telecoms”.

The top 10 countries in the overall FDI rankings (see graph) are U.S., China, U.K., Canada, Germany, Brazil, Japan, France, Mexico and Australia.

FDI-COnfidence-Index2015

The report says,

Mexico gains three spots to reach 9th, as President Enrique Peña Nieto’s reform agenda continues to improve Mexico’s business climate. Its 2013 FDI levels of $38 billion were an all-time high, with the majority of investment targeted at Mexico’s growing manufacturing sector, including high-value-added electronics. Mexico’s Economy Ministry has reported that flows fell to $22.6 billion in 2014, with inflows of $33.9 billion offset by $11.4 billion in outflows. Significant reforms in the energy sector will occur this year to allow foreign private investment.

As a result of the telecom reforms that targeted Carlos Slim’s América Móvil, which controls 70 percent of the market, customer prices fell nearly 17 percent between February 2013 and January 2015. In response to the policy changes, AT&T made a $5 billion divestment in América Móvil and subsequently acquired Grupo Iusacell SA, Mexico’s third-largest wireless operator, for $1.7 billion. Going forward, these reforms are expected to open up growth opportunities for smaller competitors.

In November 2014, the American chemicals maker PPG Industries acquired paints maker Consorcio Comex for $2.3 billion. This followed the rejection by the Mexican federal competition authority of the sale to Sherwin-Williams for a proposed $2.34 billion on the grounds that it would create unfair market conditions.

According to this recent press report, Mexico’s FDI during the first three months of 2015 totaled $7.573 billion, an all-time record for the first quarter. The figure comes from 1357 separate investments originating from the USA (59.4%), Spain (14.3%), Japan (8.2%), South Korea (4.8%), France (2.9%), and the Netherlands (2.3%), with the remaining 8.1% coming from 48 other nations.

May 182015
 

We have frequently commented on the importance of migration channels linking specific towns in Mexico to particular places in the USA.

quinonesIn his latest book, Dreamland: The True Tale of Americas Opiate Epidemic, journalist Sam Quinones, one of our favorite writers about Mexico, describes the fascinating details of how one particular migration channel – from the small, nondescript town of Xalisco in the western state of Nayarit, to the city of Denver – has fueled an innovative delivery network for black tar heroin, a network that now spreads its tentacles across much of the USA.

Quinones relates the work of narcotics officer Dennis Chavez, who joined the narcotics unit of the Denver Police Department, and was determined to understand the reasons behind the escalation of black tar heroin dealing. Chavez listened carefully to his informants and a key breakthrough came when one particular informant told Chavez that while “the dealers, the couriers with backpacks of heroin, the drivers with balloons of heroin”, all looked very random and scattered, they were not. They were all connected. “They’re all from a town called Xalisco.”

Indeed they were, and the system they had set up was enterprising, innovative, and designed to avoid undue attention.

Read an excerpt:

This excerpt from Dreamland: The True Tale of Americas Opiate Epidemic, published on Daily Beast, explains how “in the 1990s, innovative drug traffickers from Mexico figured out that white kids cared most about service and convenience.”

Sam Quinones’ latest book is a gripping account of many previously murky aspects of the U.S. drug scene. It should interest anyone who wants to understand the human stories behind drug trafficking, international migration and globalization. A must-read!

Related posts:

30 top geotourism sites in Mexico (Geo-Mexico special)

 Index page  Comments Off on 30 top geotourism sites in Mexico (Geo-Mexico special)
May 142015
 

Mexico has literally thousands of geotourism sites (locations where the primary recreational attraction is some phenomenon of geographic importance, such as a coral reef, mangrove swamp, volcano, mountain peak, cave or canyon. Many of Mexico’s geotourism sites are geomorphosites, where the primary attraction is one or more ”landforms that have acquired a scientific, cultural/historical, aesthetic and/or social/economic value due to human perception or exploitation.” (Panniza, 2001)

Here is a partial index (by state) to the geotourism sites described on Geo-mexico.com to date:

Baja California Sur

Chiapas

Chihuahua

Colima

Hidalgo

Jalisco

México (State of)

Michoacán

Morelos

Nayarit

Nuevo León

Oaxaca

Puebla

Querétaro

Quintana Roo

San Luis Potosí

Sonora

Tamaulipas

Veracruz

Reference:

  • Panizza M. (2001) Geomorphosites : concepts, methods and example of geomorphological survey. Chinese Science Bulletin, 46: 4-6

Ground subsidence in Mexican cities

 Books and resources  Comments Off on Ground subsidence in Mexican cities
May 112015
 

The sinking of parts of Mexico City into the former lake bed on which much of it is built is well documented, but to what extent does subsidence also affect other Mexican cities?

Estell Chaussard and her co-authors considered this question in their article entitled “Magnitude and extent of land subsidence in central Mexico revealed by regional InSAR ALOS time-series survey.” Subsidence, often resulting from over-depletion of ground water, has a range of human impacts, including decreased supply of safe water, an increase in flood risk, and a greater hazard threat from building or street failure.

In their time-series analysis of more than 600 Synthetic Aperture Radar (InSAR) images of central Mexico, the authors found evidence of significant subsidence in seventeen cities, including sixteen cities with a population of 100,000 inhabitants or more. The cities affected (with their population in parentheses) are listed here from east to west:

  • Puebla (2,500,000)
  • Mexico City (21,000,000)
  • Toluca (427,000)
  • Querétaro (825,000)
  • San Luis de la Paz (101,000)
  • Celaya (266,000)
  • San Luis Potosí (936,000)
  • Morelia (537,000)
  • Salamanca (144,000)
  • Irapuato (317,000)
  • Silao (147,000)
  • León (1,400,000)
  • Aguascalientes (735,000)
  • Zamora (186,000)
  • Guadalajara (3,800,000)
  • Ahuacatlán (6,500)
  • Tepic (261,000)

Their analysis suggested that the rates of subsidence over a two-year period were nearly constant at most locations, typically between 5 and 10 cm/yr. (In contrast, subsidence in Mexico City was around 30 cm/yr, in line with previous studies.)

ground-fissures

Ground failure by groundwater withdrawal subsidence. Credit: Natural Science, Vol. 6, No 3, 2014.

An earlier study – Subsidence risk due to groundwater extraction in urban areas using fractal analysis of satellite images – had found that the intense groundwater pumping regime in Irapuato for urban supply and agriculture (the area is one of Mexico’s main strawberry-growing centers) had resulted in 18 subsidence fault systems with a total length of 27 km, causing damages to more than 200 houses.

Meanwhile, previous work in nearby Celaya – Subsidence in Celaya, Guanajuato, Central Mexico: implications for groundwater extraction and the neotectonic regime – found that subsidence in that city was due to a complex combination of factors, and not entirely due to excessive groundwater extraction. Most earth fissures in the Celaya area were related to pre-existing structural features, and the authors suggested that thermal springs also appeared to play a role.

References:

Related posts:

May 042015
 

The Haciendas of Mexico: An Artist’s Record, by Paul Alexander Bartlett, first published in 1990 and now available as a free Gutenburg pdf or Epub, is a great starting point for anyone interested in the history, economics, art and architecture of the hundreds of colonial haciendas which still grace Mexico’s rural areas. Bartlett made one of the earliest artistic records of more than 350 of these haciendas, dragging his family around the country for years as he obsessively explored lesser-known places. The photographs and pen and ink illustrations in his outstanding book were made on site from 1943 to 1985.

Geo-Mexico is reader-supported. Purchases made via links on our site may, at no cost to you, earn us an affiliate commission. Learn more.
bartlett-hacienda-1

Pen-and-ink drawing of Hacienda de Teya, Yucatán, by Paul Bartlett.

Bartlett’s hacienda art work has been displayed at the Los Angeles County Museum, the New York City Public Library, the University of Virginia, the University of Texas, the Instituto Mexicano-Norteamericano in Mexico City, and at the Bancroft Library, among other places.

Paul Alexander Bartlett (1909-1990) attended Oberlin College and the University of Arizona, before studying art at the National University of Mexico (UNAM) and in Guadalajara. He was an instructor in creative writing at Georgia State College, Editor of Publications at the University of California Santa Barbara (1964-70) and wrote dozens of short stories and poems. His books include the short novel Adios, mi México (1983), and the novel When the Owl Cries (1960).

Writing must run in the family. Bartlett’s wife was the well-known poet and writer Elizabeth Bartlett (1911-1994). The couple met in Guadalajara in 1941 and married two years later in Sayula. Their son Steven James Bartlett is a widely published author in the fields of psychology and philosophy.

In the foreward to The Haciendas of Mexico: An Artist’s Record, novelist James Michener writes that:

I first became aware of the high artistic merit of Paul Bartlett’s work on the classic haciendas of Old Mexico when I came upon an exhibition in Texas in 1968. His drawings, sketches, and photographs evoked so effectively the historic buildings I had known when working in Mexico that I wrote to the architect-artist to inform him of my pleasure.”

Gisela von Wobeser observes, in her introduction, that,

When Bartlett began his hacienda visits in the 1940s, he found many of the hacienda buildings in ruins, exposed to the ravages of time and vandalism. Buildings had been converted into chicken coops, pigsties, public apartments, and machine shops. Others served as sources for construction materials, from which were scavenged rocks, bricks, beams, and tiles for the habitations of the local population. In some cases the destruction was total: All the hacienda’s structures were removed, and only the name of the place alluded to the fact that a hacienda had ever existed there.

At other haciendas, buildings were adapted to new uses. They were transformed into hotels, resorts, government buildings, barracks, hospitals, restaurants, and schools. The exterior of the buildings were generally left intact; interiors were completely changed.

The best—preserved hacienda buildings were those that continued to function as country properties or vacation homes. In these, Bartlett often found furnishings and utensils from the epoch of Don Porfirio, surrounded by the old traditions of Mexican country life.”

von Wobeser makes the useful distinction between three types of hacienda: those where grains were the main output, those specializing in cattle-rearing, and those for sugar-cane cultivation and processing.

The book describes haciendas in almost every state of the Republic. A handy map and list are provided of which haciendas are located in each state. There are more than 100 pen-and-ink illustrations and photographs in total in the book, which is arranged in seven chapters:

  1. The Hacienda System
  2. Through the Eyes of Hacienda Visitors
  3. Hacienda Life
  4. Fiestas
  5. Education
  6. The Revolution
  7. Mexico Since the Revolution

The accompanying text, written from a non-specialist perspective, is always lively, informative and interesting. The style of illustrations is varied, in keeping with the immense variety of haciendas that the author explored and sketched.

bartlett-hacienda-zapotitan

Pen-and-ink drawing by Paul Bartlett of Hacienda de Zapotitán, Jalisco

Coincidentally, the hacienda of Zapotitán in Jalisco (see illustration above), located close to Jocotepec and Lake Chapala, is the first hacienda to be featured in the on-going series of articles by modern-day hacienda explorer Jim Cook. Jim spends countless hours researching old haciendas, and regularly goes exploring with friends to see what is left on the ground today. His descriptions and photographs are easily the best contemporary accounts of the haciendas in western Mexico.

All in all, this is a really useful addition to the literature about Mexico’s haciendas, one guaranteed to answer many of the questions and doubts that visitors to Mexico often express about just how haciendas functioned and what working and living conditions were like, both for the owner’s family and the workers.

An archive of Bartlett’s original pen-and-ink illustrations and several hundred photographs is held in the Benson Latin American Collection of the University of Texas in Austin. A second collection of hacienda photographs and other materials is maintained by the Western History Research Center of the University of Wyoming in Laramie.

Want to visit some haciendas?

Chapter 9 of my Western Mexico, A Traveler’s Treasury (2013) focuses on the “Hacienda Route” to the south and west of Guadalajara, with an itinerary that includes visiting several haciendas within easy reach of the city.

Related posts:

A little bit of Mexico in Indonesia (Mexican botanic garden in Indonesia)

 Other  Comments Off on A little bit of Mexico in Indonesia (Mexican botanic garden in Indonesia)
Apr 302015
 

Like many geographers, I have long held a more than passing interest in botanical gardens. From a geographic standpoint, botanical gardens offer the chance to closely examine plants that can be very difficult, virtually impossible, to find in the wild. Many botanical gardens display the typical plant assemblages that are common in the local region, while also giving a plant-based snapshot of different environments elsewhere.

Mexico has an extraordinary variety of flowering plants, estimated (even twenty years ago) to include more than 20,000 different species.  Many garden plants commonly planted in Europe, the USA and elsewhere originated in Mexico.

Over the years I’ve looked at Mexican cacti and succulents in numerous botanical gardens around the world, but was pleasantly surprised when visiting Indonesia in 2013 to discover that the Purwodadi Botanic Garden in Pasuruan, East Java, actually has an entire section devoted to the Mexican flora characteristic of semi-arid conditions (see photos).

Entrance to the”Taman Mexico” (Mexico Park):

indonesia-0

The 85-hectare Botanic Garden was first established in 1941, and has plants collected from a wide range of areas in Indonesia, as well as smaller sections devoted to plants from elsewhere. I’m not sure how old the Mexican section is, but the plants are clearly thriving, despite showing some signs of neglect. This is mainly because the climate in the Botanic Garden (located at 8 degrees south of the equator and longitude 113 degrees east) is fairly similar to some parts of Mexico. The Garden has an elevation of 300 meters and an annual rainfall of 2366 mm.

indonesia-3

indonesia-4

indonesia-2

indonesia-5

indonesia-6

Assuming that the Mexican Embassy in Jakarta had some part in establishing this fine display of Mexican flora, perhaps it is time that embassy officials revisit their gift and see whether they can’t enhance the Mexican garden by sponsoring some information signs, so that visitors can truly appreciate these venerable plants, not only for their beauty, but also for their ecological and economic significance.

indonesia-1

There are lots of additional botanical goodies to be seen here in addition to the Mexican Park, including stately jacaranda trees and an amazing collection of banana plants. The Purwodadi Botanic Gardens are well worth a visit if you ever happen to be anywhere in the vicinity. They are located about 70 kilometers south of the city of Surabaya towards Malang. Allow at least 90 minutes for the drive.

Photos by Tony Burton; all rights reserved.

Details:

Purwodadi Botanic Garden, Jl. Surabaya-Malang Km.65 Purwodadi Pasuruan, Pasuruan, East Java 67163, Indonesia. Tel: +62341426046 www.krpurwodadi.lipi.go.id email: redaksiwebkrp@gmail.com

Embassy of Mexico in Jakarta: embmexic@rad.net.id / embmexico@gmail.com

Author David Lida on Mexico City’s transportation systems

 Books and resources, Mexico's geography in the Press  Comments Off on Author David Lida on Mexico City’s transportation systems
Apr 272015
 

David Lida is a well-known and highly respected author who has lived in Mexico City (on and off) for over twenty years. His books include First Stop in the New World: Mexico City, Capital of the 21st Century and the short-story collection Travel Advisory: Stories of Mexico. He also blogs about Mexico City:

lida-bookHis article a few months back in the Guardian about life in Mexico City – An urbanist’s guide to Mexico City: ‘Transport is an adventure and often a nightmare” – is an informative account of his love-hate relationship with the city. The following short extracts from his article, relating to the geography of the city, should sharpen your appetite to read more:

“The greater metropolitan area of Mexico City is home to about 22 million people (known as chilangos) and is laid out over about 600 square miles…. The most recent study, from 2007, says that it takes chilangos an average of an hour and 17 minutes to get from one place to another.”

“Half of the working population toils in the informal economy – parking cars, cleaning houses, packing groceries, selling things on the street. The middle class is squeezed month by month rather than daily, while perhaps 10% has a jolly time with plenty of discretionary income. According to Forbes, Mexico’s elite upper class is made up of 1.7% of the population.”

“Although it is not comprehensive, and the stations are spaced further apart than they are in some other places, if your destination is on the route the metro is the fastest, cheapest and best way to get around Mexico City…. Taxis are abundant and cheap, and depending on your route, can also be quick. As in any big city, you want to avoid getting stuck in rush-hour traffic whenever possible.”

“Bicycling has definitely become more popular in the city, but because of the way people drive cars, I think it is a terrifying prospect.”

“What I believe we are seeing here is a worldwide phenomenon in which the well-to-do are getting sick and tired of long commutes from gated communities on the outskirts and want to move closer to the centre. Many of the poor will probably end up being shunted further and further away from where they have to work.”

“In greater Mexico City there are about 85,000 streets and 5,000 neighbourhoods. Of those streets, about 850 are called Juárez, 750 are named Hidalgo, and 700 are known as Morelos. Two hundred are called 16 de Septiembre, while 100 more are called 16 de Septiembre Avenue, Alley, Mews or Extension…. Like London’s A to Z or Michelin’s Paris Plan, there is a street map in book form here called the Guía Roji, which weighs in at over 150 two-sided pages of maps. If you only own one book while you live here, better make it the Guía Roji.”

Extracts come from David Lida’s – An urbanist’s guide to Mexico City: ‘Transport is an adventure and often a nightmare”. Enjoy!

Related posts:

Mexico’s geomorphosites: Peñas Cargadas, Mineral del Monte, Hidalgo

 Other  Comments Off on Mexico’s geomorphosites: Peñas Cargadas, Mineral del Monte, Hidalgo
Apr 232015
 

This short Postandfly video of an area known as Peñas Cargardas (“Loaded Rocks”) in the state of Hidalgo is the perfect excuse to add to our posts about Mexico’s geomorphosites – sites where landforms have provided amazing scenery for our enjoyment. This area of Mexico is definitely one of my favorites, partly because it is crammed with interesting sights for geographers, including the Basalt Prisms of San Miguel Regla, only a few kilometers away from the Piedras Cargadas, and an equally-stunning geomorphosite.

A few minutes east of the city of Pachuca, the Peñas Cargadas (sometimes called the Piedras Cargadas) are located in a valley in the surrounding pine-fir forest. The rocks comprising the Peñas Cargadas have capricious shapes; some appear to be balanced on top of others. Their formation may well be due to the same processes that formed the Piedras Encimadas in Puebla, which are actually not all that far away as the crow flies.

The nearest town, Mineral del Monte (aka Real del Monte) has lots of interest for cultural tourists. Among many other claims to fame, it was where the first soccer and tennis matches in Mexico were played ~ in the nineteenth century, when the surrounding hills echoed to the sounds of Cornish miners, brought here from the U.K. to work the silver mines.

The miners introduced the Cornish Pasty, chile-enriched variations of which are still sold in the town as pastes. Real del Monte also has an English Cemetery, testament not only to the many tragic accidents that befell miners when mining here was at its peak, but also to the long-standing allegiance that led many in-comers to remain here to raise their families long after mining was in near-terminal decline. The town has typical nineteenth century mining architecture. The larger buildings retain many signs of their former wealth the glory.

pachuca-map

The following Spanish language video has some ground-level views, as well as more information about the scenery and the area’s flora:

How to get there

The Peñas Cargadas are about ten kilometers east of Pachuca (see map). From Pachuca, follow signs for Mineral del Monte, and then drive past the “Panteón Inglés” (English Cemetery) in that town on the road to Tezoantla. The Peñas Cargadas are about 3.5 kilometers beyond Tezoantla. This is a great place for a day trip from Mexico City.

Related posts:

Hurricane forecast and names for 2015

 Other  Comments Off on Hurricane forecast and names for 2015
Apr 202015
 

The 2015 hurricane season in Mexico for Pacific coast storms starts on 15 May and lasts until 30 November. For Atlantic storms, the hurricane season extends from 1 June to 30 November, though most hurricane activity is concentrated in the months from July to September. Hurricanes are also known as typhoons or tropical cyclones.

The table shows the World Meteorological Organization’s official list of 2015 tropical storm and hurricane names. Note that male and female names alternate. Names are often reused in future years, with the exception of the names of any particularly violent storms, which are officially “retired” from the list for a long time.

2015 Hurricane Names for the Atlantic, Gulf of Mexico and Caribbean
AnaGraceLarryRose
BillHenriMindySam
ClaudetteIdaNicholasTeresa
DannyJoaquinOdetteVictor
ErikaKatePeterWanda
Fred

2015 Hurricane Names for the Eastern Pacific
AndresGuillermoMartyTerry
BlancaHildaNoraVivian
CarlosIgnacioOlafWaldo
DoloresJimenaPatriciaXina
EnriqueKevinRickYork
FeliciaLindaSandraZelda

In their early season forecast for this year, Philip Klotzbach and William Gray, researchers at Colorado State University,  expect hurricane activity in the Atlantic to be below the 1981-2012 average. They predict that in the 2015 season 7 named storms will form in the Atlantic: 4 tropical storms, 2 moderate hurricanes (1 or 2 on the Saffir-Simpson scale), and 1 severe hurricanes (3, 4 or 5 on the Saffir-Simpson scale). These forecasts will be updated on 2 June and 31 July.

saffir-simpson-scaleAs expected, Pacific Ocean hurricanes were more common than usual in 2014, because it was an El Niño year. In 2014, there were 22 named storms (the highest total for 22 years), including a record-typing 16 hurricanes, of which 9 were major hurricanes. Hurricane activity in 2015 is also expected to be higher than the long-term average.

In 2015, for the Pacific coast, Mexico’s National Meteorological Service (Servicio Metrológico Nacional, SMN) is expecting 19 named storms: 8 tropical storms, 7 moderate hurricanes (1 or 2 on the Saffir-Simpson scale), and 4 severe hurricanes (3, 4 or 5 on the Saffir-Simpson scale). The SNM publishes regular updates on hurricane activity (in Spanish) on its webpage and via its Twitter account: @huracanconagua.

How accurate was the 2014 forecast?

The early season (May) prediction for 2014 (last year) was for 9 named storms in the Atlantic: 6 tropical storms, 2 moderate hurricanes and 1 severe hurricanes. This prediction proved to be the fairly accurate. In reality, the 2014 Atlantic season had 8 named storms: 2 tropical storms, 4 moderate hurricanes and 2 severe hurricanes

Related posts:

The art of Mexican volcanoes

 Other  Comments Off on The art of Mexican volcanoes
Apr 162015
 

An art exhibition entitled “Mexican Volcanoes” is opening in Mexico City next week. The show opens on Tuesday 21 April, at noon, at the offices of the Mexican Society for Geography and Statistics (Sociedad Mexicana de Geografía y Estadística) at Justo Sierra #19, in the Historic Center of the city. The Society is one of the world’s oldest geographic societies, having been founded 18 April 1833. (The Royal Geographical Society in the U.K. was founded in 1830; the National Geographic Society in the USA was founded in 1888).

Invitacion frente

This exhibition, which will close on 29 April, is being arranged by Lewinson Art, a Mexican art firm that specializes in promoting artists via a virtual gallery and exhibitions. Artists were invited to submit works (paintings, drawings, engravings, photographs) relating to the subject “Mexican Volcanoes”.

Detail of lithograph by Casimiro Castro of Railway near Orizaba, Veracruz

Detail of lithograph by Casimiro Castro of Railway near Orizaba, Veracruz, with Pico de Orizaba in the background

Historically, Mexico’s volcanoes have been especially fertile ground for Mexican artists, from the great landscapes of José María Velasco to Casimiro Castro and the colorful and energetic “aerial landscapes” of Dr. Atl (Gerardo Murillo).

dr-atl-paricutin

Dr. Atl (Gerardo Murillo): Paricutin Volcano

Artists represented in this interesting exhibition include:

Agustín Aldama, Mercedes Arellano, José Luis Briseño, Rosi Calderón, Argelia Castañeda, Becky Esquenazi, Gabriela Estrada, Tere Galván, Gabriela Horta, Ana Gabriela Iñiguez, Débora Lewinson, Manuel Martinez Moreno, Nadine Markova, Ausberto Morales, Francoise Noé, Merle Reivich, Fernando Reyes Varela, Homero Santamaría, Arcelia Urbieta, Ariel Valencia , Primo Vega and Lucille Wong.

The volcanoes depicted in the show include Popocatepetl, Iztaccihuatl, Cofre de Perote and the Nevado de Toluca (Xinantecatl).

Related posts:

Many of Mexico’s archaeological sites now on Google Street View

 Books and resources  Comments Off on Many of Mexico’s archaeological sites now on Google Street View
Apr 132015
 

An agreement between the National Anthropology and History Institute (INAH) and Google means that many of Mexico’s most famous archaeological sites can now be explored using Google’s Street View. Perfect for the armchair traveler!

The system allows for viewers to rotate street level views the full 360 degrees horizontally, and 290 degrees vertically to take a “virtual walk” through such major sites as Teotihuacan, Xochicalco, Monte Albán, Chichén Itzá, Tulum, Palenque, Tula and Paquimé.

Sites included in INAH/Google system

Sites included in INAH/Google system

Google’s images were captured by specially-designed equipment on bicycles that could navigate the paths and ruins without causing damage to the ancient structures.

Google Street Views can be accessed via either Google Earth or Google Maps.

The INAH/Google system includes the following sites in the Maya World region (Mundo Maya):

Dzibilchaltún
Uxmal (Street view) – Uxmal (article)
Kabah
Ek Balam
Chichén Itzá (Street view) – Chichén Itzá (article)
Kohunlich
Dzibanché
Chacchoben
Tulum (Street view) – Tulum (article)
El Rey
El Meco
Cobá
Becán
Palenque (Street view) – Palenque (article)
Bonampak
Comalcalco (Street view) – Comalcalco (article)

It also includes these noteworthy sites in other parts of Mexico:

Teotihuacan  (Street view) – Teotihuacan (article)
Xochicalco (Street view) – Xochicalco (article)
Monte Albán (Street view) – Monte Albán (article)
Mitla (Street view) – Mitla (article)
Yagul (Street view) – Yagul (article)
Peralta
Plazuelas
Tzintzuntzan (Street view) – Tzintzuntzan (article)
Tajín
Paquimé (Street view) – Paquimé (article)
Cuicuilco
Cholula, Puebla (Street view) – Cholula (article)
Xochitécatla
Tula

Related posts:

Apr 092015
 

The Institute for Economics and Peace (IEP) has published its Mexico Peace Index. The following excerpts come from the Executive Summary of the Mexico Peace Index Report 2015:

The Mexico Peace Index provides a comprehensive measure of peacefulness in Mexico from 2003 to 2014. The 2015 report aims to deepen the understanding of the trends, patterns and drivers of peace in Mexico while highlighting the important economic benefits that will flow from a more peaceful society.

Mexico Peace Index, 2015

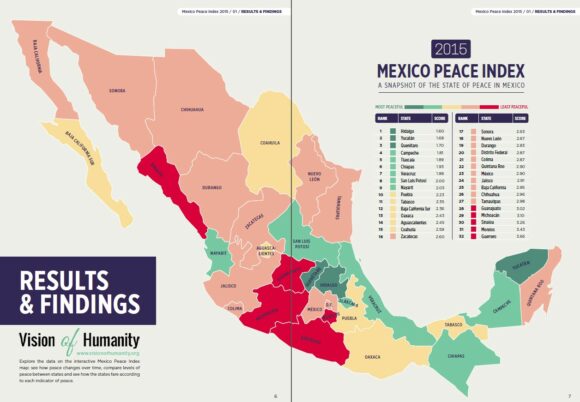
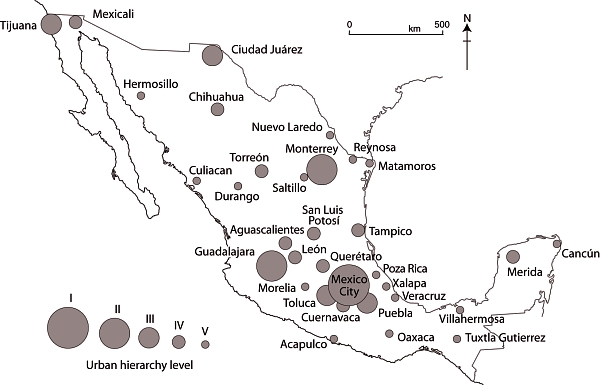
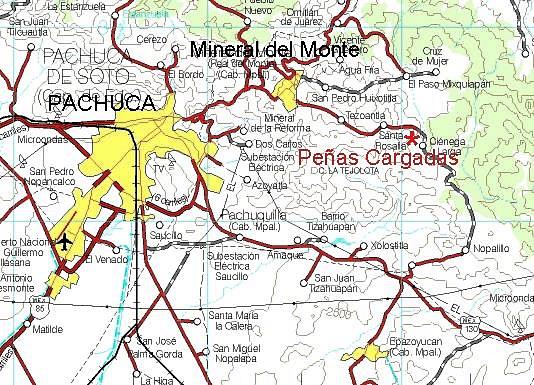
Mexico Peace Index, 2015. Credit: Institute for Economics and Peace.

The map above shows the relative values of the MPI by state, where dark blue means the most peaceful states and dark red the least peaceful (most violent) states.

Improvement since 2012

According to the report, Mexico’s peace has improved 10.5% since 2012, continuing the trend from 2011; however, 2014 saw very little improvement, improving only 0.7%. It is too early to determine whether this is a new trend. Mexico’s level of peace in 2014 approached 2007 levels, when homicide and violent crime began to increase rapidly.

The MPI indicators registering the largest improvements in the last two years were the homicide rate, which fell by 30%, and the level of organized crime, which improved by 25%. All three measures in the organized crime indicator (extortion, kidnapping and narcotics offenses) improved. There was also a significant reduction in the violent crime rate, which fell by 12%.

Furthermore, the recorded increase in peacefulness was widespread. In the last two years, 26 out of the 32 states saw improvements in peacefulness, with all of them recording reductions in the violent crime rate and 23 states recording reductions in the homicide rate. The biggest improvements were recorded in the least peaceful states; contrary to the overall trend, the most peaceful states became slightly less peaceful. These diverging trends resulted in a substantial narrowing of the gap between the least peaceful and the most peaceful states.

In contrast, during the same two-year period, weapons crime increased significantly and was up by 11%. The three other indicators that make up the MPI (justice efficiency, incarceration and police funding) have plateaued or slightly deteriorated and are now at record highs.

The justice efficiency indicator continued to decline, which is very concerning, with the number of homicides relative to the number of prosecutions doubling from 1.45 in 2006 to 3.43 in 2013. The justice efficiency indicator measures the ratio of homicide convictions to homicides in a given year and is used as a proxy for impunity.

Additionally, the rate at which people were sentenced to prison fell from 210 per 100,000 people to 104 from 2003 to 2014. Combined with the deterioration in the justice efficiency indicator, this is a troubling trend that highlights the urgent need to fully implement the current justice reforms.

It should be noted that the declines in homicides and gang-related violence do not necessarily mean that criminal organizations are less powerful; they may have become more circumspect in their activities. This reflects a paradox in Mexico: while indicators of peacefulness have greatly improved in the last four years, many Mexicans still report high perceptions of criminality. Additionally, officially recorded rates of homicide and violent crime are still very high by global standards.

Under-reporting of violent crime and other criminal activities is a serious issue in Mexico, with IEP estimating that rape is reported only eight percent of the time and assault only 23%. To create a more accurate index, IEP has adjusted all indicators for under-reporting rates.

For many, these concerns create doubt about the reliability of criminal justice statistics. To determine the veracity of the official data, IEP compared various alternative datasets and victimization surveys against the official data. The results tend to support the trend towards higher levels of peace, but with some qualifications.

Main findings of the Mexico Peace Index 2015

  • Mexico has experienced a large decrease in violence since 2011, with the national level of peace improving by 16%.
  • Progress in peace plateaued last year; it is too early to determine if this is the start of a new trend.
  • The level of peace as measured by the 2015 MPI is still 18% lower than in 2003.
  • The most peaceful state in Mexico is Hidalgo, followed by Yucatán, Querétaro, Campeche, Tlaxcala and Chiapas.
  • Of the 76 largest metropolitan areas of Mexico, the most peaceful is Orizaba in Veracruz, and the least peaceful is Culiacán in Sinaloa.
  • The eastern region remains the most peaceful in Mexico, while the northern region is still the most violent, although the gap between the north and the other regions is now at its lowest point since 2004.

Trends in Peace

Peace improved in the majority of states in Mexico in the last two years, with 26 out of 32 states improving. The largest improvements were in the northern region, which improved 17.8%. The gap in the levels of peace between the least and most peaceful states is now at its lowest point since 2006.

Over the last two years, the largest decreases in violence have been in the homicide rate, which fell almost 30%, and the level of organized crime, which fell by 25%.

The only indicator that recorded a significant deterioration in the last two years is weapons crime, which increased by 11%. The police funding indicator and the justice efficiency indicator recorded very slight deteriorations, reaching their worst levels in 2014.

The fall in the homicide rate is mainly due to a reduction in homicides related to organized crime, as the biggest reductions were recorded in the states with the worst levels of drug cartel activity.

While there is some doubt about the accuracy of government crime statistics, multiple data sources do support a decline in the homicide rate over the last two years. This strongly suggests the progress in peace is real.

On an international comparison, Mexico fell 45 places in the Global Peace Index between 2008 and 2013. It remains the least peaceful country in Central America and the Caribbean.

Economic Value of Peace in Mexico

The total economic impact of violence in Mexico in 2014 is estimated to be $3 trillion pesos or US$233 billion, equivalent to 17.3% of GDP. This represents $24,844 pesos, or almost US$1,946, per citizen. This is a 16.7% decrease from 2012, when the total economic impact of violence in Mexico was $3.57 trillion pesos.

The states with the highest per capita economic impact from violence are Guerrero, Morelos, Baja California and Tamaulipas, with the economic impact in Guerrero at $43,666 pesos/person. If the 16 least peaceful states in 2003 had experienced the same economic growth as the 16 most peaceful states in 2003, then the Mexican economy in 2014 would be $140 billion pesos or 13% larger.

Related posts:

Cueva Cheve, Oaxaca, is one of the world’s deepest cave systems

 Other  Comments Off on Cueva Cheve, Oaxaca, is one of the world’s deepest cave systems
Apr 062015
 

Even though most people have never heard of it, Cueva Chevé is one of the deepest cave systems in the world. In 2003, a team led by American speleologist Bill Stone, explored Cueva Chevé, located in the mountainous, pine-clad Sierra de Juárez region of Oaxaca, to a depth of 1484 m (4869 ft). The Cueva Chevé system is thought to have some tunnels (as yet unexplored) that extend even further, to depths beyond 2000 m (6500 ft). By way of comparison, at present the world’s deepest known cave is the Krubera Cave, in the Republic of Georgia, which has a maximum explored depth of 2197 m (7208 ft).

Profile of Cueva Cheve

Profile of Cueva Cheve

How deep might the Cueva Chevé be?

In 1990, colored dye trace experiments showed that there was a hydrological connection between the Chevé Cave and a distant spring (resurgence). This shows that the Cueva Chevé system (including parts not yet explored) has a total vertical fall of 2525 m (8284 ft) over a distance of (north to south) of almost 19 km (11.8 mi).

Because the major risks in exploring any cave system include the possibility of sudden rises in water level, or unexpected water flows through the caves, expeditions to this region are limited to the middle of the dry season (ie February-April). When an expedition gets underway, staging camps are set up underground at intervals, but only in locations believed to be well above flood stage water levels.

Cueva Chevé (see cross section) is shaped like a giant L. The vertical shaft is about 910 m (3000 ft) deep and roughly 3.2 km (2.0 mi) of passages are required to get to the bottom. The remainder is a long, gradually sloping passage that goes on for another 3.2 km and drops roughly 605 m (2000 ft). The cave’s deepest known point is about 11 km (7 mi) from the entrance, where explorers have so far failed to get past a terminal sump.

The air in the cave is relatively warm, with temperatures ranging from 47-52̊ F (8-11̊ C).

Chambers so far explored have been given prosaic names such as “Cuarto de las Canastas” (the Basket Room), “Cuarto del Elefante Negro” (the Black Elephant Room), and “Cañon Fresco” (Fresh Canyon), while named cave formations include the “Taller de Santa Claus” (Santa Claus Workshop). Several parts of the cave system have been found to contain human artifacts, the earliest dating back at least several hundred years.

How to get there

Cueva Chevé is about 140 km (86 mi) north of Oaxaca City via highways 190 and 131.

Related posts

Mar 302015
 

In a departure from our usual style, this post considers some of the more striking gifts available on the web that would surely please any Geo-Mexico fanatic. (Sadly, we do not receive any commission or recompense for making these recommendations, though we are always open to offers!)

First up is this framed, 5″ x 7″ stainless steel laser-cut map street map of Guadalajara:

Stainless steel, laser-cut map of Guadalajara

Stainless steel, laser-cut map of Guadalajara

Next is this stunning Mexico City Map, by modern artist Jazzberry Blue, reproduced as a Giclée Fine Art Print:

Mexico City street map by Jazzberry Blue

Mexico City street map by Jazzberry Blue

This map is available in four sizes, 13″x13″ (includes a 1″white  border); 17″x17″ (includes a 2″ border); 22″x22″ (includes a 2″ border); and 28″x28″ (includes a 2″ border). There is a similar, though less colorful, map of Guadalajara.

Alternatively, how about this Mexico typography map?

Mexico typography map

Mexico typography map

This more conventional Landform Map of Mexico, drawn by Erwin Raisz, is an absolute classic. Erwin J. Raisz (1893-1968) was an internationally renowned cartographer. The map is a hand drawn, pen and ink map, based on field observations and aerial photography.

raisz-map-mexicoThis incredibly detailed map is a bargain at $12 plus shipping, but is 28″ by 41″ in size and will cost you several times that to frame.

The online gifts site Etsy has many other arts and crafts maps related to Mexico. Which is your favorite?

 Tagged with:

Mexico’s vulnerability and readiness to adapt to climate change and other global challenges

 Other  Comments Off on Mexico’s vulnerability and readiness to adapt to climate change and other global challenges
Mar 262015
 

The ND-GAIN Index, a project of the University of Notre Dame Global Adaptation Index (ND-GAIN), aims to help businesses and the public sector better prioritize investments for a more efficient response to the immediate global challenges ahead.

The ND-Gain Index summarizes two key characteristics of a country:

  • its vulnerability to climate change and other global challenges, and
  • its readiness to improve resilience.

Both characteristics are compound indices, based on numerous indicators, scored on a scale of 0 to 1. For vulnerability, lower scores are better; for readiness, higher scores are better.

Vulnerability measures a country’s exposure, sensitivity and ability to adapt to the negative impact of climate change. ND-GAIN measures the overall vulnerability by considering vulnerability in six life-supporting sectors – food, water, health, ecosystem service, human habitat and infrastructure.

Three vulnerability components are considered (each has several indicators):

  • Exposure: The degree to which a system is exposed to significant climate change from a biophysical perspective. It is a component of vulnerability independent of socio-economic context. Exposure indicators are projected impacts for the coming decades.
  • Sensitivity: The extent to which a country is dependent upon a sector negatively affected by climate hazard, or the proportion of the population particularly susceptible to a climate change hazard. A country’s sensitivity can vary over time.
  • Adaptive Capacity: The availability of social resources for sector-specific adaptation. In some cases, these capacities reflect sustainable adaptation solutions. In other cases, they reflect capacities to put newer, more sustainable adaptations into place. Adaptive capacity also varies over time.

Readiness targets those portions of the economy, governance and society that affect the speed and efficiency of absorption and implementation of Adaptation projects.

Three Readiness components are taken into account:

  • Economic Readiness: Economic readiness captures the ability of a country’s business environment to accept investment that could be applied to adaptation that reduces vulnerability (reduces sensitivity and improves adaptive capacity).
  • Governance Readiness: Governance readiness captures the institutional factors that enhance application of investment for adaptation.
  • Social Readiness: Social readiness captures the factors such as social inequality, ICT infrastructure, education and innovation, that enhance the mobility of investment and promote adaptation actions.
ND-Gain Index: Trends in Mexico's vulnearablity and readiness

ND-Gain Index: Trends in Mexico’s vulnerablity and readiness

In the case of Mexico (see image), from 1995 to 2013, vulnerability has steadily improved, from a high of 0.362 in 1996 to 0.315 in 2013. Mexico’s vulnerability has decreased for each of the six sectors except infrastructure.

Over the same period of time, readiness in Mexico has also improved, from a low of 0.387 in 1995 to a high of 0.464 in 2013.

The trends of lower vulnerability scores and higher readiness score for Mexico mean that while adaptation challenges still exist, Mexico is well positioned to adapt to future challenges. On the overall ND-Gain Index, Mexico is the 47th least vulnerable country and the 91st most ready country, for an overall rank of #74, of the 190+ countries in the rankings.

Good news for Mexico’s little sea cow, the vaquita marina

 Mexico's geography in the Press  Comments Off on Good news for Mexico’s little sea cow, the vaquita marina
Mar 232015
 

Good news for Mexico’s “little sea cow”, the world’s smallest porpoise, known in Spanish as the vaquita marina, currently the most endangered cetacean in the world.

The federal government has approved a compensation plan designed to protect the vaquita marina, with a budget of 69 million dollars, spread over two years. Most of the funds will be used to pay 1,300 fishermen in San Felipe and Santa Clara in the upper Sea of Cortés (Gulf of California) not to fish.

There are thought to be fewer than 100 vaquitas remaining in the wild. Banning fishing in the main area where the little sea cows are found will eliminate the loss of further vaquitas as bycatch.

Map of sightings and acoustic detection spots. Adapted from North American Conservation Action Plan for the vaquita

Map of sightings and acoustic detection spots. Adapted from North American Conservation Action Plan for the vaquita

Besides paying compensation to fishermen in return for not fishing, some funds will be allocated to finance annual inspections and introduce surveillance drones to ensure compliance with the conservation plan and detect any illegal fishing. The unmanned drones will be managed by Mexico’s Environmental Protection Agency (Profepa).

Some funds will also go to research, with an emphasis on trying to develop a vaquita-safe shrimp net that can safely be used in the area.

Banning fishing for the 860 holders of fishing licenses in Santa Clara and the 494 licensed fishermen in San Felipe, may help the vaquita marina, but will bring some adverse consequences to the local economy since there no compensation is on offer for those workers, including many women, who are involved in fish processing and other parts of the production chain.

Not long enough

As Luis Fueyo, the head of Mexico’s National Protected Areas Commission (Conanp) has said in recent press interviews, the vaquita marina cannot possibly recover in two years because they only reproduce every two years and only 25 of those remaining are of reproducing age. Fueyo says that the plan needs to look ahead 20 to 30 years in order to create a viable population of 5,000 vaquita.

So, while a two year ban is nowhere near long enough to achieve any measurable increase in the vaquita marina population, it is a good first step in the right direction. Hopefully, the federal government will allocate additional funding in future years to ensure that the world does not lose this critically endangered porpoise.

Related posts:

An update on the Human Development Index in Mexico

 Updates to Geo-Mexico  Comments Off on An update on the Human Development Index in Mexico
Mar 192015
 

The latest United National Development Program (UNDP) report about the Human Development Index (HDI) in Mexico gives scores and ranks for each state. The full report, in Spanish, entitled “Índice de Desarrollo Humano para las entidades federativas, México 2015: Avance continuo, diferencias persistentes“, is readily available online, and is based on data up to and including 2012.

The HDI is a compound index based on several aspects of three major criteria: health, education and income.

HDI improved between 2008 and 2012 in all states except Baja California Sur. The greatest percentage increases in HDI were in Puebla (where HDI rose 3.7%), Chiapas (3.6%) and Campeche (3.6%). HDI in Baja California Sur fell 0.8%, mainly due to a lower score for education.

HDI in Mexico, with comparison countries for each state

HDI in Mexico, with comparison countries for each state. Click map to enlarge.

The pattern of HDI in Mexico, by state, is shown on the map. The highest HDI values in 2012 were for the Federal District with a score of 0.830, Nuevo León (0.790) and Sonora (0.779). At the other end of the spectrum, Chiapas had the lowest HDI (0.667), below Guerrero (0.679) and Oaxaca (0.681).

As noted previously on Geo-Mexico, the north-south divide in Mexico persists. In general, northern states, together with the Yucatán Peninsula states (Campeche, Yucatán and Quintana Roo) all have HDI values considered “medium” or higher, while southern Mexico (plus some other states, including Zacatecas, Guanajuato, Michoacán and Veracruz) all have “low” values.

The map includes international comparisons. For example, Oaxaca, one of most deprived states in Mexico, had a level of HDI in 2012 comparable to that of Botswana in Africa, even though that nation’s HDI is actually 38 positions below that of Mexico in the world rankings.

The report highlights the extent of disparities by calculating the number of years it will take each state, at the rates of change experienced from 2008 to 2012 to reach the HDI level of Mexico City. Interestingly, while it will apparently take Chihuahua 200 years to reach the HDI level of Mexico City, it will take Chiapas only 20 years to reach the same point.

The main conclusion that can be drawn is that the overall quality of life continues to improve in Mexico though not at equal rates throughout  the country. Disparities persist and current patterns of public spending have failed to make significant inroads into diminishing these disparities. The UN report considers it a priority to close the development gaps in Mexico, especially in the two southern states of Chiapas and Oaxaca.

Related posts:
Mar 122015
 

If you really want to learn more about Mexico’s economy and have a few hours to spare, then the free, open, online video course entitled Mexico’s Economy: Current Prospects and History by MRUniversity is the place to go. The lead instructor is Dr. Robin Grier of the University of Oklahoma. In a series of 51 short videos, she provides an outstanding analysis of Mexico’s economic history and current economic issues.

The course summary reads:

Is Mexico the most dynamic economy in Latin America?  After some tough times in the 1980s and 90s, Mexico has emerged as one of the economic leaders of the region.  Where does it stand among other emerging markets and what are its prospects for the future? In this four-week course, we will study the modern Mexican economy, some of the unique elements of development in a one-party, authoritarian regime, and some of the challenges the country faced in getting to this point.

No prior knowledge of economics (or of Mexico’s geography) is needed to follow the clear and concise min-lectures given by Dr. Grier, though many of her main lines of inquiry will be more than familiar to readers of Geo-Mexico.

There is lots of interesting material in these videos. For example, a short lecture under “Social Issues” entitled “Is There A Height Premium in Mexico?” looks at the evidence that taller people in Mexico earn more and have better economic opportunities than shorter Mexicans, before concluding that “each centimeter of height above the average is equivalent to 2% higher wages”. (Note: This video is a great follow-up to our April 2013 post, How tall is the average Mexican?)

The full list of videos in Mexico’s Economy: Current Prospects and History is

  • 1 An Overview of the Mexican Economy
    • Achievements
    • Challenges & prospects for reform
  • 2 Colonial Legacies: Obstacles to Growth after Independence
    • A reversal of fortune
    • Colonial Transportation Part I
    • Colonial Transportation Part II
    • Political Instability After Independence
    • The Economic Effects of the War of Independence
    • Transportation & Infrastructure in the 19th century
    • Slow Financial Development in Early Mexico
    • Law and Economic Development in Early Mexico
  • 3 Development Strategies
    • State-led development: an overview from 1917-1982
    • Commodity Driven Growth before the 1930s
    • Turning Inward: Industrial Policy after the Great Depression
    • Labor Unions and the PRI until democratization
    • What is a maquiladora?    An overview of Pemex
    • The problems of Pemex
    • Pemex’s poor performance
  • 4 Social Issues
    • Fertility and Demographic Change in Mexico
    • Is There A Height Premium in Mexico?
    • Conditional Cash Transfers
    • Migration and its Wage Effects in the US
    • Migration and Remittances
    • Economics of the Drug War
    • Finance, Law & Trust (Mexico)
    • Education Quality in Mexico
    • Education Inequality in Mexico
    • Why is Teaching Quality so Low?
  • 5 Land & Agriculture
    • Land Reform in an Authoritarian State
    • The Economic Life of the Tortilla
    • A Tomato Border Crossing
    • Watermelon Scale Economies
  • 6 The Debt Crisis of the 1980s
    • External Factors of the Debt Crisis
    • Domestic Factors of the Debt Crisis
    • Resolving the Debt Crisis
  • 7 The State Retreats: Reform in the 1980s & 1990s
    • External Factors Behind Reform
    • Privatization Part I: The state loosens its grip
    • Privatization Part 1a: Charges of Cronyism and Corruption
    • Privatization 2: Dealing with the Opposition
    • Privatization 3: Results
  • 8 The Peso Crisis
    • The Mexican Miracle? The Lead-Up to the Tequila Crisis
    • Tequila crisis
  • 9 NAFTA & the Mexican Economy
    • An Introduction to NAFTA
    • The effects of NAFTA on the Mexican economy
    • NAFTA and Mexican Agriculture
    • FDI & NAFTA
  • 10 Modern Mexico
    • Mexico & the Brics
    • Is Mexico the new China?
    • La Reconquista: Mexican direct investment in the US
    • Mexico as an open economy
    • Mexico and the 2008 Global Financial Crisis

The course is an outstanding resource for teachers and students of geography and economics, and worthy of wide use in a range of high-school A-level and IB courses as well as college and university programs.

Mar 092015
 

How much geography can you learn from a novel? In some cases, plenty! Robert Richter’s latest novel, Something for Nothing, is a case in point. Set in the swampy lowlands of coastal Nayarit, it is not only a fun read but provides armchair travelers with an easy introduction to the geography of western Mexico.

The book’s author has known this area intimately for more than forty years and his extensive knowledge and deep appreciation for the varied landscapes of this region are evident throughout. The novel is the third in a series of mysteries starring a small-time hustler named Cotton Walters. This particular tale revolves around archaeologists, drug smugglers and a motley crew of colorful local characters.

The history in this novel is entirely believable, and the plot entertaining, but it is the descriptions of the area’s geography that we focus on here.

richter-something-for-nothing-2015Early on, Richter offers an excellent overview of the landscapes in this region of Mexico:

“From the highway Mex-15 to the coast, between the San Blas turn on the south and the Tuxpan turn on the north, something was going on in that country of streams and gorges and farmers’ fields. Mex-15 wound through breakneck sierra jungle country where a spur of the Sierra Madre Occidental plunges to the coastal lowlands of mangrove estuaries and shrimp-spawning lagoons, banana plantations and  fishermen’s river-edge villages. Between Nayarit’s two major rivers, Río San Pedro on the north, and Río Santiago on the south, this was rugged backcountry known only by the farmers and jungle scroungers who carved an agricultural living from the wilds. From sierra peak plots to fertile lowland fields, from scattered wild fruit groves hacked from the jungle to smooth, cultivated fields and orchards, from blacktop roads to machete-hacked trails, it’s a country of explosive green growth and extreme geography, a native ground of small towns caught in colonial time warp and hidden bayou settlements as primitive as mythic Aztlan.” (Something for Nothing, 9)

The following paragraph provides the likely human and economic geography background to the “something was going on” phrase used earlier, neatly combining comments about accessibility (or lack thereof), drug smuggling routes, the economic importance of marijuana-growing and questions the possible links between the military and the drugs business:

This was October, end of the rain and hurricane season, and the engorged rivers were running full, impassable except at the few major bridges. The army was stationed at each traffic artery coming out of that country to the main highway. Area contained. It had to be a sweep for marijuana growers or a hunt for major harvest warehouses. Sinaloa to the north was known for its poppy fields and cartel trafficking, Michoacán and Guerrero farther south for Sinsemilla and Acapulco Gold. But the barrancas and jungle milpas of Nayarit were starting to contribute their share of quality pot to the Gross National Product and to the local economies. This year’s harvest had been coming in for some time, and this military presence all along the highway had the feel of maneuvers to eradicate or to confiscate. On the other hand, it could be to expedite the flow of product, too. Quién sabe? [Something for Nothing, 10]

Similarly, this extract from a later chapter links tourism to the volcanic landscapes and appraently laments the loss of wilderness that has accompanied tourism growth, before offering an evocative description of the lowland jungle:

We took an oyster shell road out a back street of Sayulita, not headed out toward the highway, but around a jungle-covered lava spill south into the bosque toward Punta Mita and the northern point of Banderas Bay. Today, that road is driven by Vallarta tourist families in rented Chevy Blazers to luxury hotels. In the winter of ‘72, it was a deer trail that died in an arroyo somewhere in the heart of darkness. Under old growth rain forest canopy we pried boulders out of the way, chopped through windfall palm trunks, and pushed on into an ever-closing tropical wilderness.

… Then suddenly, we entered a clearing under giant iguerra blanca trees and towering palms, draped with vines like decoration and full of grackle cries and parrot song, warblers answering and magpies chattering. Beneath the cathedral-like canopy, a village of stick and thatch huts appeared in the mist and smoke of kitchen fires. Dogs and naked children paused in mid-play to stare at the strange metal monster wheeling in from the twentieth century.

Our modern intrusion rent a momentary silence in the tapestry of village routine. Sunlight pierced the jungle crown with spears of silver light. A prehistoric dust hovered in the air. A rooster crowed. A jay answered. Time warped. As we opened our pickup doors kids scurried or stumbled forward, captured by a spell of awe. My own senses reeled under overload reception. I couldn’t tell the century or the hour of the day in the perpetual jungle shade. I simply absorbed the surroundings, only vaguely conscious and aware. (Something for Nothing, 25-26)

The swamps of lowland, coastal Nayarit comprise a region known in Spanish as the Marismas Nacionales. The area is one of the most distinctive of Mexico’s many extraordinary ecosystems, difficult to explore, teeming with insects, birds and aquatic life, and so far relatively untouched by tourism. Cotton Walters, the book’s main character, and his friend Miguel are navigating their way through the swamps when they are spotted by the Mexican Navy:

I crawled back to Miguel in the stern, pointing and screaming, “Navy! Navy! Ándale! We have to reach the first islands!” Miguel opened it up and cut sharply for shore and the first open passage of river between delta sand spits and jungle-covered islands.

The mouth of the Río San Pedro is more a maze of passages through lowland marshes than a distinctive channel of fast flowing current–except now at the height of the rainy season. The San Pedro oozes into the Pacific rather than runs, and the coast from there north to Mazatlan is an ever changing labyrinth of lagoons and meandering rivulets choked with water lilies and low islands thick with marsh grasses and crawling vines. The lowland character changes with the seasons of dryness and deluge, a seething cauldron of crustacean larvae, breeding shrimp, prawn, oyster, and fish during the rainy season, and arid scrub brush pasture for roaming herds of Cebu cattle and their retinue of herons in the dry months. (Something for Nothing, 31)

Richter’s less-than-flattering description of the town of San Blas nevertheless offers an astute summary of its historical significance:

Yeah, San Blas. The seediest backwater port town on Mexico’s west coast. A town as old as the first buccaneers and as ravaged by time as an old hag. An outpost town on the fringe of four or five different cultures, a smugglers’ town since the first Spanish customs house ran up a flag and started squeezing the citizens for coin of the realm. A place where four centuries of highwaymen have bought and sold their stock in trade, their particular treasure or scheme. (Something for Nothing, 53)

Much later in the novel, Cotton Walters breakfasts at McDonald’s restaurant in San Blas. But this particular McDonald’s has nothing to do with golden arches or globalization:

Breakfast at McDonald’s isn’t what you think if it’s in San Blas. No golden arches. No Happy Meal with a movie toy inside. Just a standard Mexican tile-floor, stucco-wall, wooden-tabled restaurant with the ceiling fan trying to cut its way through the thick October air; the waiter Jorge as grim-faced and slow-paced as ever; and Señora Tinzón de McDonald, long-time widow of some American-Scot refugee of the fifties, waiting to make huevos al gusto or hotcakes. The only restaurant near the plaza that served an early breakfast, by 8 a.m. most of McDonald’s tables were full when I arrived. A couple of expats tried to steady their morning shakes with that first cup of coffee, a few of the soccer-fan tourists in shorts and necklaces of long-nosed cameras were chowing down before a jungle trek chasing bright-colored birds, and a few local shop owners and municipal bureaucrats were hanging out over morning cups of caffeine conversation. An empty small table leaned against the far left wall, (Something for Nothing, 92)

I’ve had the pleasure of eating in the Restaurante McDonad’s of San Blas on several occasions, and, as always, Richter’s powers of observation and description are spot-on.

How much geography can you learn from a novel? Plenty, especially if it written by an observer such as Robert Richter who has such an obvious love for, and deep knowledge of, the locales described.

Related posts:

Mar 052015
 

The Nava brewery, which started operations in May 2010, was built by Grupo Modelo but subsequently sold in 2013 to Constellation Brands, the U.S. company that holds the rights to import Modelo products into the U.S.

Nava brewery

Nava brewery. Credit: Constellation Brands

Constellation Brands (founded in 1945 and based in Victor, New York) is a leading international producer and marketer of beer, wine and spirits with operations in the U.S., Canada, Mexico, New Zealand and Italy.

The Nava brewery is the world’s largest brewery of its kind (see this video overview from company webpage), with about 2000 employees and a brewing capacity of 20 million hectoliters of beer a year. A planned expansion (see 26-second video) will increase capacity to 30 million hectoliters.The plant produces Grupo Modelo brands such as Corona, Corona Light, Negra Modelo and Modelo Especial, under license for export to the U.S.

Where is it?

The beer brewery and bottling plant is located in the Nava municipality in the northern state of Coahuila, about 21 km (13 mi) from the border town of Piedras Negras. It is built alongside highway 57 and spreads over 334 hectares (825 acres) of a greenfield site.

Why is it located in Nava?

The major advantages of this location include:

  • the availability of good quality water
  • proximity to the U.S. border and the U.S. beer market
  • presence of good road, rail and power infrastructure

How does the brewery work?

The brewery is a three-story brewhouse with large metal silos, about 1.6 km (1 mi) of conveyors and four pasteurizers. The facility consists of two brewhouses with malt intake, vacuum evaporation and energy recovery systems, 70 cylindro-conical fermentation and storage tanks, seven clean-in-place (CIP) stations, a yeast cellar with 16 tanks and continuous microfiltration (CMF), 30 pressure tanks and three filtration lines with 1,200 hectoliters/hour capacity each, and a Siemens automated process control system.

The brewery uses rice, barley malt, corn grits and water to produce beer. The feedstock is transported by trains to the plant and stored in silos. A 60 km (37 mi) pipeline connects the brewery to a mountain aquifer supplying about 20 million cubic meters of water a year. The site includes its own wastewater treatment plant.

A raw materials supply system handles the raw materials in bulk and conveys them to the brewhouse, where they first enter a collection bin, and then a mash tun, where water is added. The mixture is then pumped along a pipeline to the cereal cooker of the brewhouse.

Two brew systems consisting of mash tuns and cereal cookers are designed to efficiently use the internal heat. These heaters can also clean them automatically by CIP (clean-in-place) technology. Fermentation takes place in unitanks configured with automated clarification, purging systems and turbidity monitoring. The brewery consumes less than 3 liters of water for each liter of beer. The carbon dioxide reclamation capacity of the brewhouse is about 4,000 kg/hour.

The three bottling lines have the capacity to handle 144,000 bottles/hour, while a canning line outputs up to 66,000 cans/hour.

Filling, pasteurizing and cap feeding is handled by 37 robotic machines. Output is linked to the warehouse by automated trolleys. The automated warehouse is equipped with digisat satellite, a state-of-the-art warehouse management system, and can store about 63,000 pallets.

The high level of automation means that this beer manufacturing and bottling plant has operational costs about 40% lower than the seven older breweries that still belong to Grupo Modelo.

Related Posts:

Beach replenishment needed in Quintana Roo

 Mexico's geography in the Press  Comments Off on Beach replenishment needed in Quintana Roo
Mar 022015
 

Officials in Quintana Roo claim that beach replenishment in the state requires the investment of at least 500 million pesos (about 35 million dollars) in the next few years, and are asking for federal help.

After Hurricane Wilma in 2005, many beaches in Quintana Roo were badly damaged. Following the hurricane, initial beach restoration efforts were funded by the federal Tourism Secretariat, with maintenance then passed over to local (municipal) authorities and the state government. The restoration program included the planting of more than 8,000 palm trees in an effort to help stabilize the coast. However, storms in late 2014 caused considerable damage to beaches, especially the Gaviota Azul beach in Punta Cancún, prompting tourism representatives to call for renewed investment in restoration.

State officials have singled out five areas where the beaches are of particular concern:

  • Cancún
  • Playa del Carmen
  • Isla Mujeres
  • Cozumel
  • Holbox Island

Quintana Roo has budgeted 5 million pesos in this year’s budget to complete the five Environmental Impact studies needed prior to applying for federal funding.

In related news, four Quintana Roo towns have applied for Magic Town status:

  • Tulum
  • Holbox
  • Isla Mujeres
  • Felipe Carrillo Puerto

Quintana Roo currently has only one Magic Town: Bacalar.

The Tourism Secretariat has previously announced that it plans to add 17 towns to the list this year, bringing the total by year-end to 100. Towns that have applied for Magic Town status will be evaluated in June this year, with decisions expected to be announced in July. Given the number of towns submitting applications, some locations are clearly going to be disappointed in this round of nominations.

Related posts:

Which cities in Mexico have the highest cost of living?

 Mexico's geography in the Press  Comments Off on Which cities in Mexico have the highest cost of living?
Feb 262015
 

The recently published ‘Costo de Vida Nacional 2014-2015’ report from Recursos Humanos Mercer (Mercer Human Resources) provides a comparison of the cost of living in 42 cities, based on the cost of 182 different products and services. The study is released annually to provide a basis for corporations to decide on employee remuneration to reflect the varied living costs in different parts of the country.

The products and services used for comparison are divided into 9 different groups:

  • Housing
  • Food
  • Education
  • Public Transport
  • Clothing and footwear
  • Entertainment
  • Health
  • Domestic appliances
  • Personal care
Part played by different products/services in the cost of living of cities in Mexico

Part played by different products/services in the cost of living of cities in Mexico. Source: Mercer

The values for each city reflect differences from the cost of living in Mexico City, which is assigned an index value of 100. The cities with the highest cost of living in 2014-2015 were Los Cabos, Cancún, Monterrey, Mexico City and Cuernavaca (graph below). In the 2013-2014 version, the cities with the highest cost of living were Cancún, Los Cabos, Monterrey, Mexico City and Puebla.

Cities with the highest cost of living in Mexico

Cities with the highest cost of living in Mexico. Source: Mercer

The cities with the lowest cost of living in 2014-2015 were Tlaxcala, Zacatecas, Tepic, Guanajuato and Tuxtla Gutiérrez (graph below). In 2013-2014, the cities with the lowest cost of living were Zacatecas, Tuxtla Gutiérrez, Guanajuato, Tepic and Veracruz.

Cities with the lowest cost of living in Mexico

Cities with the lowest cost of living in Mexico. Source: Mercer

Related posts:

Feb 232015
 

Consultancy PwC, the world’s second largest multinational professional services network has published an updated edition of The World in 2050. In the latest edition, The World in 2050: Will the shift in global economic power continue?, the authors present economic growth projections for 32 of the largest economies in the world, accounting for around 84% of global GDP.

world-2050-updated-version

“We project the world economy to grow at an average of just over 3% per annum in the period 2014 – 50, doubling in size by 2037 and nearly tripling by 2050.

But we expect a slowdown in global growth after 2020, as the rate of expansion in China and some other major emerging economies moderates to a more sustainable long-term rate, and as working age population growth slows in many large economies.

The global economic power shift away from the established advanced economies in North America, Western Europe and Japan will continue over the next 35 years. China has already overtaken the US in 2014 to become the largest economy in purchasing power parity (PPP) terms. In market exchange rate (MER) terms, we project China to overtake the US in 2028 despite its projected growth slowdown.

We project new emerging economies like Mexico and Indonesia to be larger than the UK and France by 2030 (in PPP terms) while Turkey could become larger than Italy. Nigeria and Vietnam could be the fast growing large economies over the period to 2050.”

A summary table in the PwC report shows the firm’s predictions for major economies in 2050 have Mexico continuing to progress up the world ladder, with its economy reaching world rank #6 by 2050, ahead of Japan, Russia, Nigeria and Germany.

Will the PwC forecasts turn out to be accurate? If this blog is still going strong in 2050, we promise to include an update…