climate | Geo-Mexico, the geography of Mexico - Part 2

A Happy New Year to all our readers!

 Other  Comments Off on A Happy New Year to all our readers!
Jan 012015
 

We had no idea when we first published Geo-Mexico, the geography and dynamics of modern Mexico, and started this associated blog, how many readers we would reach.

Geo-Mexico-ThumbnailOn the one hand, very few U.S. or Canadian universities have courses devoted specifically to Mexico. There are quite a number of geography courses with titles such as “The Geography of Mexico, the Caribbean and Central America”, or “The Geography of Latin America”, but very few that focus mainly or solely on Mexico. This is unfortunate and means that most geography students graduating from USA universities will have only a partial knowledge, at best, of their southern neighbor. It also means that Geo-Mexico was not adopted by as many university courses as we might have hoped.

On the other hand, the book has been used in several courses that were not part of its target market, including courses in “The Politics of Mexico” and at least one International Affairs program. Equally, it has exceeded our expectations in providing a basic guide for non-specialists interested in getting a better knowledge of Mexico; the frequent feedback from readers has been overwhelmingly positive and gratifying. (Please keep it coming!)

The blog has proved to be very popular, and its audience continues to grow ~ don’t forget to recommend it to friends and colleagues. We welcome all comments and suggestions for future posts. We also welcome 400-800 word submissions (which will be published with your byline), but please contact us first.

Maps from Geo-Mexico have been included in many academic publications and a number of graduate theses. Publications that referred to the book, and/or blog, cover an amazing range of topics. A random sampling includes:

  • “Environmental risk, resilience and migration: implications for natural resource management and agriculture” in Environmental Research Letters  (2012)
  • “Texas and Mexico: Sharing a Legacy of Poverty and Neglected Tropical Diseases” in PLoS Neglected Tropical Diseases (2012)
  • “Zapatista Autonomy in Cartel Mexico: Preserving Smallholder Viability”, in Culture, Agriculture, Food and Environment (2011)
  • “NAFTA: The Mexican Economy, and Undocumented Migration” a research paper of Naval War College Newport, RI, Joint Military Operations Dept. (2011)
  • The Future of Entrepreneurship in Latin America (Palgrave Macmillan, 2012)
  • “Climate Change, Migration and Security, Best Practice Policy and Operational Options for Mexico”, an Interim Report from the Royal United Services Institute, Whitehall, London (2012)
  • “Vulnerability and Surviving Pattern of Elderly Migrants in Urban Mexico”, in Journal of Sociological Research (2012)
  • OECD Reviews of Risk Management Policies: Mexico 2013 Review of the Mexican National Civil Protection System (OECD 2013)

To all our readers, thanks for your support, and we wish you all a

Happy New Year! ¡Feliz año nuevo!

The production of Christmas trees in Mexico

 Other  Comments Off on The production of Christmas trees in Mexico
Dec 182014
 

According to consumer surveys, only one out of every five Mexican households decorates a natural Christmas tree during the holiday season; the other 80% of households decorate artificial trees. About 75% of natural trees are bought from traditional retailers, with the remaining 25% purchased from informal street vendors. Almost all purchases of natural Christmas trees are made between 10 December and 25 December.

As of mid-December 2014, sales of trees are reported to be down on previous years. Retailers claim that the prices for imported trees (ranging from 330 pesos (about 25 dollars) for a 1-meter-high tree to 1,500 pesos (110 dollars) for a large tree) have led to greatly diminished demand. Prices for domestically grown trees range from about 100 to 1,000 pesos.

The total annual demand for natural Christmas trees is about 1.8 million. Mexico currently imports about 1 million trees a year, almost all from the USA and Canada. Annual imports are worth about $12 million. Imports are governed by strict standards, last revised in 2010, to ensure that no unwanted pests or diseases are brought into the country.

As of mid-December, at least 5500 trees had failed the health inspection at the border and had been returned to the USA. Officials from Mexico’s Federal Environmental Protection Agency (Procuraduría Federal de Protección al Ambiente, Profepa) identified several problems in shipments of Douglas Fir and Noble Fir trees. At Tijuana, one shipment of Douglas Fir was found to be infected a resin moth (Synanthedon sp.), and one with flatheaded fir borer (Buprestidae). In Mexicali, a shipment of Douglas Fir was infested with the Douglas-fir Twig Weevil (Cylindrocopturus furnissi), while in Nogales, imported trees were found to be accompanied by unwanted European Paper Wasps (Polistes dominula). None of these pests are normally found in Mexico.

Mexicali is the busiest border crossing in terms of Christmas tree imports, accounting for 35% of the total, followed by Tijuana (25%), Nogales (16%), Colombia (15%), Nuevo Laredo (4%), San Luis Río Colorado (3%), Reynosa (1%) and Puente Zaragoza-Isleta (in Chihuahua) (0.4%).

In the 1970s and 1980s, most natural Christmas trees sold in Mexico came from Mexico’s natural forests. Beginning in the 1990s, specialist Christmas tree nurseries and plantations were started.

Pruning young Christmas trees in Mexico

Pruning young Christmas trees in Mexico to ensure they keep a good shape. Credit: CONAFOR.

According to the National Forestry Commission (CONAFOR), Mexico has almost 17,000 hectares of land planted in Christmas trees. The area of Christmas trees has increased very rapidly in recent years. This year, CONAFOR has provided some degree of financial assistance to farmers with 4,551 hectares of tree plantations in 18 states.

The main areas of Christmas tree plantations are in the interior highlands in the states of Mexico, Veracruz, Nuevo León, Mexico D.F., Puebla, Michoacán, Durango, Coahuila and Guanajuato. These states share temperate climate conditions and are close to the main markets in major cities.

The most common species grown in Mexico are Mexican White Pine (Spanish: Pino ayacahuite), Douglas Fir (Abeto douglas), Mexican Pinyon (Pino piñonero), Sacred Fir (Oyamel) and Aleppo Pine (Pino alepo).

Trees are harvested at between five and ten years of age. Mature plantations of Christmas trees can generate revenue of between 300,000 pesos and 500,000 pesos ($23,000-$38,000) for each hectare. This means that Christmas tree farming has become a profitable form of sustainable development in some rural communities, offering greater profit potential than using the same land to grow traditional rain-fed crops.

The planting of Christmas trees is supported by CONAFOR’s ProArbol program, which offers landowners incentives to conserve, restore, and sustainably exploit forest resources. CONAFOR claims this helps to limit urban sprawl, and counteract forest clearance for arable land, as well as to increase the capture and storage of carbon, thereby mitigating climate change. In addition, conifer plantations generate rural employment, reducing the effects of one of the key “push” factors behind rural-urban migration.

Note: This is an updated version of a post that was first published in 2012.

Main source:

USDA Foreign Agricultural Service GAIN report: Mexico: Christmas Trees, by Dulce Flores, Vanessa Salcido, and Adam Branson. 12 May 2011.

Related posts:

Access to safe water is a human right in Mexico

 Mexico's geography in the Press  Comments Off on Access to safe water is a human right in Mexico
Dec 132014
 

Earlier this year, David Korenfeld, the director of Mexico’s National Water Commission (Conagua), was chosen to head the inter-governmental council that oversees UNESCO’s International Hydrological Program (IHP). The IHP is the only inter-governmental program of the U.N. system devoted to water research, water-resources management, and education and capacity building.

In his acceptance speech, Korenfeld called for “greater synergy between decision makers and specialists to combine theory and practice” and stated that “significant challenges remain [in the water sector], including integral basin management, application of the human right to water and water security and sustainability in the context of climate change.

Recent events demonstrate that Mexican courts are happy to uphold the view that water is a basic human right. The 5 Dec 2014 issue of the OOSKAnews, a newsletter dedicated to water industry professionals, included the following short piece about a landmark recent decision by Mexico’s Supreme Court that represents the first ever Supreme Court decision in Mexico upholding the nation’s stance that “water is a basic human right.”

The Supreme Court has for the first time awarded an “amparo” (similar to an injunction, a remedy for the protection of constitutional rights), based on the human right to water.

In this case, members of the court unanimously sided with Lidia Velázquez Reynoso, a resident of the Ampliación Tres de Mayo area in the municipality of Xochitepec, in the state of Morelos.

In their ruling, the court said authorities must meet their obligation to provide Velázquez’s residence with “access, availability, and sanitation of water for personal and domestic consumption in a sufficient, safe, acceptable, and affordable form.” A lower court had already ruled in favor of Velázquez, but the case was appealed.

The Supreme Court said responsible authorities had failed to guaranteed regular delivery of water, since merely connecting Velázquez’s residence to the water system was not good enough. Water quality and volume must also be taken into account. The court said that the water must meet World Health Organization standards, and the volume provided must be at least 50 to 100 liters per person per day.

The court ordered authorities to not only deliver the water to Velázquez, but also to remit records showing that the water meets national and international standards.

(OOSKAnews, 5 December 2014)

Related posts:

The geography of dengue fever in Mexico

 Updates to Geo-Mexico  Comments Off on The geography of dengue fever in Mexico
Dec 112014
 

Preventing, diagnosing and treating dengue fever is a major public health issue in many parts of the world, including central America and Mexico. The disease is transmitted by mosquitoes. Infected patients develop a sudden high fever, usually accompanied by generalized body pain and a skin rash. The pain can be very severe, hence the disease’s common name of breakbone fever.

Several species of mosquito can transmit dengue, but female Aedes aegypti mosquitoes are the main transmitter of dengue in Mexico. These mosquitoes bite during the day, mostly in the period two hours either side of dawn and dusk. The mosquito bites an infected person and ingests blood with the dengue virus, which incubates in the mosquito for a period of 8 to 12 days. After that the mosquito can begin to transmit the virus by biting other people. From 5-7 days later any newly infected person is likely to have symptoms.

The graph below shows the monthly number of dengue cases in Mexico from 2000 to 2006. It is clear that most cases are reported between July and November, with very few cases occurring between December and May. This can be explained by Mexico’s climate. Almost of all of Mexico receives most of its rainfall between June and October. The mosquitoes that spread dengue need stagnant water to breed. There are far more small pools of water available for mosquito breeding in and immediately after the annual rainy season. Eliminating potential locations where water can collect and stagnate is an important element of dengue prevention programs.

Monthly incidence of dengue cases in Mexico, 2000-2006

Monthly incidence of dengue cases in Mexico, 2000-2006. Source: San Martín, Brathwaite et al (2014).

The graph also shows that the number of cases of dengue was increasing rapidly between 2000 and 2006. Indeed, numbers continued to rise until 2013 when more than 50,000 cases were reported for the year (an average of more than 4000/month). At first sight, this suggests that dengue prevention programs have not been very successful, but in fact the rise echoes what was happening worldwide. One possible, at least partial, explanation may be that changes in climate have allowed dengue mosquitoes to thrive in environments where they were previously scarce. People in such areas are unprepared for dengue; they may not have instituted prevention programs, and may have been slow to receive correct diagnosis. The migration of people affected by dengue from one region to another may also have helped the disease spread, provided there were host mosquitoes in the destination region.

The good news is that the number of dengue cases in Mexico in 2014 has fallen from its 2013 level by about 50%, so the dengue epidemic may finally be on the wane. As of 24 November 2014, 28,109 cases had been reported for the year, an average nationwide rate of 23.47 cases/100,000 people. Dengue is fatal in a relatively small number of cases, with 33 deaths reported in Mexico so far this year..

The total number of cases may finally be on the decline, but the figures for 2014, when looked at state by state, suggest that the spatial pattern of dengue cases in Mexico is changing. The two maps below compare the rate of cases per 100,000 people on a state-by-state basis for 2007 and 2014. (The color-coded key is identical for both maps).

Rates of dengue by state, 2007 and 2014

Rates of dengue by state, 2007 and 2014. Rates are cases / 100,000 population

In 2007, the highest rates of dengue were found in the states of Veracruz and Quintana Roo, with Oaxaca, Guerrero and Colima comprising the next category. (Those five states are the ones colored red on the 2007 map). At the other extreme, no cases were recorded in 2007 in the state of Baja California, or in several tiny states including Aguascalientes.

The pattern shown on the 2014 map is quite different. In general, rates of dengue at the state level have not increased in Mexico, but decreased. However, there is a clear shift in emphasis towards the north-west, where several states had much higher rates in 2014 than in 2007. The extreme example is Baja California Sur, where the rate for 2014 (up to 24 November) was a whopping 549.9 cases / 100,000 people, more than five times the rate registered in any other state. Equally apparent is the belt of low-rate states (from Chihuahua to the State of México) down the center of the country from the U.S. border to Mexico City. These states are at relatively high elevation where fewer mosquitoes are found.

The states of Baja California Sur, Veracruz, Sinaloa, Sonora and Guerrero account for 55% of the 28,109 confirmed cases of dengue fever reported in Mexico as of 24 November 2014.

Mexico’s Health Secretariat publishes maps of each state showing which municipalities have reported cases of dengue. These maps are updated weekly. The link is to a pdf document with maps for 2014 up to 24 November.

There is some good news. In 2015, Mexico will be the first nation in the world to get a new dengue vaccine, developed by French company Sanofi Pasteur. The company hopes to have manufactured more than 40 million doses by the first half of 2015, and has decided to introduce it first in Mexico, with the first vaccinations likely to be offered to the public late next year or early in 2016. In trials, the vaccine proved 60.8% efficient in preventing the disease.

Reference for graph:

José Luis San Martín, J.L., Brathwaite, O., Zambrano B, et al (2014): “The Epidemiology of Dengue in the Americas Over the Last Three Decades: A Worrisome Reality”; Am. J. Trop. Med. Hyg., 82(1), 2010, pp. 128–135

Related posts

How fast are mangroves disappearing in Mexico?

 Updates to Geo-Mexico  Comments Off on How fast are mangroves disappearing in Mexico?
Sep 012014
 

It is surprisingly difficult to give a single, definitive response to this seemingly simple question, so in 2008, Arturo Ruiz-Luna and a group of researchers set out to answer the question once and for all, by taking a close look at the available data and its reliability.

The first challenge is to define precisely what counts as “an area of mangroves”. Since the edges of any one type of vegetation tend to merge gradually into the next, the boundaries between types are often not clear or discrete. The second challenge is to find comparable maps or records of the extent of mangroves in former times. In many cases, earlier maps were based on simple aerial photography as opposed to the more sophisticated satellite imagery available today. Equally, studies relying on different technology may produce quite different results.

Ruiz-Luna and his colleagues concluded that there was a high degree of uncertainty over the true extent of mangrove cover in Mexico and over the rates of mangrove depletion.  The unreliability stemmed from the very different estimates of mangrove cover given in earlier studies.

Opposition to mangrove destructon

Opposition to the destruction of mangroves, Cancún climate summit, 2010

They found that the earliest estimate of the extent of mangroves in Mexico, made in 1973, was 700,000 ha (1.7 million acres). From 1980-1991, a figure of 660,000 ha was widely quoted. This is thought to have been derived from the previous figure using a linear regression to include estimated deforestation rates.

On the other hand, a study in 1992, based on 1:3,800,000 scale maps, arrived at an areal extent of 932,800 ha. A 1993 government estimate, based on satellite imagery and supporting ground survey, came up with a figure of 721,554 ha. A 1994 estimate, also using satellite data, arrived at a similar figure.

Since 2000, estimates vary from a low of 440,000 ha (based on deforestation rates and linear regression) to a high of 955,866 (almost all of it mangrove, with a small area of secondary mangrove succession).

According to Ruiz-Luna and his co-authors, it is therefore likely that the true value of the extent of mangroves lies somewhere between 600,000 and 900,000 ha, with the authors plumping for 800,000 ha as a reasonable estimate.

Why are mangroves lost?

Mangrove habitats are lost due to damage (deforestation) from logging and land use changes. Examples of land use changes adversely affecting the extent of mangroves are:

  • the conversion of mangroves to harbors, as in Manzanillo (Colima)
  • mangroves being converted for hotels and tourist use (Cancún)
  • mangrove swamps being reassigned for aquaculture (San Blas)

The loss of mangroves can also result from changes to hydrological systems on the landward side of the mangroves. For example, when an artificial channel was opened in the 1970s in Cuautla (Nayarit) to connect the Marismas Nacionales with the sea, the channel was originally about 50m wide. It is now about 600m wide in the middle, and more than 1000m wide at its mouth, due to damage caused by the river flow, and from the greater exposure of mangroves to higher salinity water, as well as increased mangrove mortality from storms and hurricanes.

While there are some small-scale projects to replant mangroves in some tourist area, this is unlikely to be a good substitute for the original mature mangrove ecosystem. This is why Geo-Mexico is happy to help publicize public protests against mangrove destruction, such as the one pictured above which took place at the Cancún climate summit in 2010.

Reference:

Arturo Ruiz-Luna, Joanna Acosta-Velázquez, César A. Berlanga-Robles. 2008. “On the reliability of the data of the extent of mangroves: A case study in Mexico.” Ocean and Coastal Management 51 (2008) 342-351.

Related posts:


Raymond Craib’s “Cartographic Mexico, a history of state fixations and fugitive landscapes”

 Books and resources  Comments Off on Raymond Craib’s “Cartographic Mexico, a history of state fixations and fugitive landscapes”
Jul 192014
 

This book by Raymond Craib (Duke University Press, 2004) is one-of-a-kind. Craib combines archival analysis of mainly 19th century documents with perceptive comments on the relationships between history and geography in Mexico from the mid-19th century until about 1930.

craib-coverIn “Cartographic Mexico, a history of state fixations and fugitive landscapes”, Craib emphasizes the significance of map-making in post-Independence Mexico as a means towards furthering nationalism and as a development tool. He traces the changing motives of map-makers, focusing especially on the key area of Veracruz-Puebla which served as Mexico’s main gateway to Europe for centuries.

Craib considers why certain place names acquired more prominence than others, and examines a case study of a mining area where the granting of water rights hinged on precisely where a particular river flowed, and which tributary had which name, a case where cartographic ‘proof’ proved to be impossible and where a pragmatic solution was required.

This is an important study, with meticulous footnotes and bibliography.

“Cartographic Mexico, a history of state fixations and fugitive landscapes” is available via amazon.com

(Note: This short review was first posted on sombrerobooks.com)

Other books reviewed on Geo-Mexico.com:

UNESCO appoints Mexico to oversee its International Hydrological Program

 Other  Comments Off on UNESCO appoints Mexico to oversee its International Hydrological Program
Jul 102014
 

Mexico has been chosen to head the inter-governmental council that oversees UNESCO’s International Hydrological Program (IHP). The IHP is the only inter-governmental program of the U.N. system devoted to water research, water-resources management, and education and capacity building.

A joint statement issued by Mexico’s Environment Secretariat and Foreign Relations Secretariat says that David Korenfeld, the director of Mexico’s National Water Commission (Conagua) has been named the council’s president for the next two years. In his acceptance speech, Korenfeld called for “greater synergy between decision makers and specialists to combine theory and practice” and stated that “significant challenges remain [in the water sector], including integral basin management, application of the human right to water and water security and sustainability in the context of climate change.

Korenfeld said that one of the IHP’s main objectives must by to strengthen “a confluence of science, technology and public policy aimed at reducing the social and environmental vulnerability of emerging and developing countries amid the challenges of climate change.”

Related posts:

How similar are Mexico’s two major deserts, the Sonoran Desert and the Chihuahuan Desert?

 Other  Comments Off on How similar are Mexico’s two major deserts, the Sonoran Desert and the Chihuahuan Desert?
May 292014
 

There are four desert areas in North America. Two of these areas (Great Basin and Mojave) are in the USA. The other two (the Sonoran Desert and the Chihuahuan Desert) are almost entirely in Mexico, but extend northwards across the border. The Sonoran Desert includes most of the Baja California Peninsula, together with the western part of the state of Sonora. The Chihuahuan desert is the northern section of the Central Plateau, including the northern parts of the states of Chihuahua.

The Chihuahuan Desert has been intensively studied by scientists interested in the possibility of life on Mars – see this New York Times article: Learning About Life on Mars, via a Detour to Mexico.

In a previous post – Why is northern Mexico a desert region? , we saw how the combination of the descending air of the Hadley Cell, which results in surface high pressure, and the effects of rain shadows resulting from neighboring mountain ranges contribute to the low annual rainfall total characteristic of both Mexico’s desert areas.

deserts-colorWhile these two deserts both experience an arid climate, they also have many differences.

Area

The Sonoran Desert has an area of about 311,000 square kilometers (120,000 sq mi). The Chihuahuan Desert has an area of about 362,000 square kilometers (139,769 sq mi).

Elevation

The Sonoran Desert is lower in elevation that the Chihuahuan Desert, with some parts (in the USA) lying below sea level. The Chihuahuan Desert varies in elevation from 600–1675 m (1969–5495 ft).

Summer temperatures

The Sonoran Desert tends to have higher summer temperatures than the Chihuahuan Desert, though even in the Chihuahuan Desert, daytime temperatures in summer are usually between 35 and 40̊C (95-104̊F).

Seasonal rainfall patterns

The ratio of winter to summer rainfall decreases from west to east. Most of the Sonoran Desert (to the west) has a bimodal rainfall regime with spring and summer peaks. On the other hand, most of the limited rain that falls in the Chihuahuan Desert comes in late summer.

The Chihuahuan Desert has a mean annual precipitation of 235 mm (9.3 in), though annual totals vary from 150 to 400 mm (6–16 in).

Vegetation, fauna and biodiversity

These seasonal rainfall differences result in significant differences in the vegetation of the two areas.

The bimodal precipitation in the Sonoran Desert provides two flowering seasons each year. Some plants bloom in spring, following winter rains, while others flower in late summer, following summer rains. Typical plants in the Sonoran Desert include columnar cacti (Cereus spp.) such as sahuaro, organ pipe, and cardon, as well as many other types of cacti, including barrels (Echinocereus), chollas (Opuntia spp.) and prickly pear (Opuntia spp.). Other succulent plants are also common.

More than 60 mammal species, 350 bird species, 20 amphibian species, 100 reptile species, 30 native fish species, 1000 native bee species, and 2000 native plant species have been recorded in the Sonoran Desert. The Sonoran Desert includes the Colorado River Delta, which was once an ecological hotspot within the desert, fueled by the fresh water brought by the river, though this flow has become negligible in recent years. See, for example, Will the mighty Colorado River ever reach its delta?

The vegetation of the Chihuahuan Desert is dominated by grasslands and shrubs, both evergreen and deciduous. Common species include tarbush (Flourensia ternua), whitethorn acacia (Acacia constrictor) and creosote bush (Larrea tridentata). The Chihuahuan desert has small cacti; succulent agaves (Agave spp.) and yuccas. Plants bloom in late summer, following the summer rains.

The Chihuahuan Desert is home to about 350 of the world’s 1500 known species of cactus, and includes the fascinating area of Cuatro Ciénegas, which has an unusually high number of endemic plant species and is one of the world’s richest hotspots for locally endemic cacti.

The Chihuahuan Desert is considered to be one of the three most biologically rich and diverse desert ecoregions in the world, rivaled only by the Great Sandy Tanmi Desert of Australia and the Namib-Karoo of southern Africa. However, settlements and grazing have heavily degraded the natural vegetation of some parts of the Chihuahuan Desert.

he Chihuahuan Desert has about 3500 plant species, including up to 1000 species (29%) that are endemic. The high rate of endemism (true for cacti, butterflies, spiders, scorpions, ants, lizards and snakes) is due to a combination of the isolating effects of the basin and range topography, climate changes over the past 10,000 years, and the colonization of seemingly inhospitable habitats by adaptive species. See here for more details of the flora and fauna of the Chihuahua Desert.

Landforms

This basin and range landscape of the Sonoran Desert trends north-northwest to south-south-east. Parallel faulted blocks are separated by alluvial bajadas (broad, debris-covered slopes), pediments and plains, which become wider approaching the coast. Despite being a desert area, this region exhibits many features that have resulted from water action, including wadis, salt flats, stream terraces and alluvial fans.

For a fuller description of the landforms of the Sonoran Desert, see this extract from A Natural History of the Sonoran Desert (edited by Steven J. Phillips and Patricia Wentworth Comus) published by the Arizona-Sonora Desert Museum.

The Sonoran Desert includes the subregion of the Sierra of Pinacate (part of El Pinacate and Gran Desierto de Altar Biosphere Reserve) with its distinctive volcanic cones, craters and lava flows. For more details, see The landforms of the El Pinacate and Gran Desierto de Altar Biosphere Reserve.

The landforms of the Chihuahuan Desert have been molded by tectonic uplift and erosion. Steep-sided but low hills are separated by wide bajadas from former lake beds and alluvial plains, occupying inland basins known as bolsons. Many parts form closed, interior basins with no external drainage. South of Ciudad Juárez, at Samalayuca, is one of Mexico’s most extensive areas of sand dunes. This is one of the most arid parts of the country, with high levels of salinization.

Related posts:

Mexicans drink more bottled water per person than anywhere else in the world

 Updates to Geo-Mexico  Comments Off on Mexicans drink more bottled water per person than anywhere else in the world
May 032014
 

Mexicans are the world’s largest consumers of bottled water, both in individual small bottles (1.5 liters or less) and in garrafones (large, 20-liter bottles).

The main reason is a lack of confidence in the purity of public water supplies, resulting in part from perceived inefficiencies in how city water systems are managed and maintained. These concerns may be valid in some parts of Mexico, but are certainly not the case in all areas. Other factors resulting in a high acceptance of bottled water are the convenience, Mexico’s warm climate, and the vigorous publicity and advertising campaigns carried out by bottled water companies. It does not help that consumer groups repeatedly express concerns even about the quality of water in garrafones, claiming that some companies apparently take insufficient precautions to prevent its contamination.

For its part, the National Water Commission repeatedly claims that the problem of water quality is not due to the main distribution lines in Mexico, but to problems at a local level, in the final stages of the network between supply and consumers.

garrafon

Typical 20-liter garrafon

According to Euromonitor International, bottled water consumption in Mexico in 2013 averaged 186.7 liters/person, well ahead of Italy (175.1 liters/person), Nigeria (163.1), Turkey (147.7) and Spain (143.2). [Note that an earlier estimate in 2010 by Beverage Marketing Corporation put per person consumption of bottled water in Mexico at 234 liters a year, with equivalent figures for Italy, Spain and the USA of 191 liters, 119 liters and 110 liters respectively; the difference from 2010 to 2013 is almost certainly due to methodological differences].

Mexico consumes about 13% of all bottled water sold in the world! The only countries consuming more bottled water (in total volume) than Mexico were the much more populous countries of the USA, China and Nigeria.

Bottling water is a highly profitable business. The cost of 1,000 liters from the tap is 25 pesos (about 2 dollars); the same water, sold in bottles, is worth between 6000 and 8500 pesos (450 to 650 dollars).

The bottled water market in Mexico has grown from 6.5 billion dollars in 2009 to 10.4 billion in 2013, according to Euromonitor.  It is dominated by three foreign firms: Danone (France), Coca-Cola (USA) and PepsiCo (USA). Between them, they supply 82% of the market, according to a Euromonitor report, with the three leading brands being Bonafont (Danone) which accounts for 38% of the market, followed by Ciel (Coca-Cola) which has a 25% share and Epura (PepsiCo) 19%.

The cost of bottled water in an average Mexican household is considerable. For instance, assuming an average consumption of 15.55 liters/month/person, and that all water is bought in 1-liter bottles (which cost about 8 pesos each), then the monthly cost per household would be close to 500 pesos (38 dollars).

An industry dominated by four multinationals

Inside the Bottle: An Exposé of the Bottled Water Industry, a book by Canadian activist Tony Clark, provides a vivid and disturbing portrayal of how, worldwide, four big companies – Nestlé, PepsiCo, Coca-Cola and Danone – dominate the bottled water industry. As summarized by infinitewaterinc.com, the book examines several key issues of public concern about the operations of these companies, including how they:

  • pay little or nothing for the water they take from rural springs or public systems;
  • turn ‘water’ into ‘water’ through elaborate treatment processes;
  • produce a product that is not necessarily safer then, nor as regulated as, tap water;
  • package it in plastic bottles made of environmentally destructive toxic chemicals;
  • market it to an unsuspecting public as ‘pure, healthy, safe drinking water’; and
  • sell it at prices hundreds, even thousands of times more costly than ordinary tap water.

Related posts:

Mexico’s geomorphosites: Ceboruco Volcano

 Other  Comments Off on Mexico’s geomorphosites: Ceboruco Volcano
Apr 072014
 

A short distance west of the crater lake of Santa María del Oro, in the west Mexico state of Nayarit, is Ceboruco volcano which has a cobblestone road to the top. The road starts from the old and picturesque village of Jala, eight kilometers off the main highway (Highway 15). The cornfields around Jala yield some of the largest ears of corn in the world, more than 30 centimeters (one foot) in length, a cause for celebration in the village’s annual August festival. Jala was declared a Magic Town in 2012.

The road up Ceboruco is a geologist’s or biologist’s dream come true, a slowly unfolding series of volcanic forms and different types of vegetation with abundant surprises even for the scientifically expert. Small wonder, then, that the great German botanist Karl Theodor Hartweg was so impressed with Ceboruco when he collected plants here in the nineteenth century. To read more about his discoveries, see The geography of garden flowers, many of which originated in Mexico.

ceborucoNear the top are several short but interesting walks, some in shady, thickly vegetated valleys hidden between towering walls of blocky lava, some along the many overlapping rims of the various old craters of which this complex peak is comprised. Wherever you choose to walk, a multicolored profusion of flowers and butterflies will greet your eyes.

On the south side of an attractive grassy valley at kilometer sixteen, fumaroles send hot gases and steam high into the air reminding us that this volcano is not yet irrevocably extinct. A massive Plinian eruption in about the year 1000 sent ash plumes into the air and devastated a wide area around the volcano. The huge blocks of lava near the summit date from a prolonged series of eruptions in the early 1870s.

Highway 15 cuts through Ceboruco’s lava field a few kilometers after the Jala junction. For those not wishing to brave the cobblestone road up to the volcano, this is a good place to stretch the legs and marvel at the inhospitable, black lava blocks which were spewed out more than a hundred years ago.

This is a lightly edited extract from my “Western Mexico: A Traveler’s Treasury” (link is to Amazon’s “Look Inside” feature), also available as either a Kindle edition or Kobo ebook.

Want to read more about Mexico’s geomorphosites? The link uses Geo-Mexico’s “Site Search” feature.

Related posts:

Apr 052014
 

How are bananas grown commercially?

Banana plants (their lack of a central woody stem means they are plants, not trees) can grow to heights of 10 meters (30 ft), with leaves up to 4 meters (12 ft) in length. Banana plants grown commercially are usually much lower in height for ease of management and to limit wind damage.

Each individual plant produces a single stem. Each stem contains six to nine clusters of bananas (“hands”), each with 10 to 20 individual bananas (“fingers”). Commercial banana stems each produce six or seven hands with 150 to 200 bananas. Each stem weights between 20 and 50 kg.

A typical banana plant grows to a size with harvestable fruit in nine to 18 months. Harvesting bananas is often done by workers in pairs, with one cutting the fruit off the stem and the other catching the bananas to prevent them striking the ground and being damaged.

After the fruit is harvested, the stalk dies or is cut down. In its place one of more “daughter” (or “ratoon”) plants will sprout from the same underground rhizome that produced the mother plant. These shoots are genetic clones of the parent plant.

Banana plants require rich soil, nine to 12 months of sunshine and frequent heavy rains (2000-4000 mm/yr), generally more than can be provided by irrigation. Bananas are either spayed with pesticides or wrapped in plastic for protection from insects. Wrapping the fruit also reduces the bruising caused by friction with leaves in windy conditions.

Bananas are easily bruised and damaged in transit, but can be picked green (unripe) and ripened quickly at destination. They are generally picked and packed on or close to the plantation.

Commercial plantations of bananas often use very large areas of land, with 2000-2400 plants/hectare. Good access to transportation routes (roads or railways) is essential in order to avoid damage after packaging. Banana cultivation is very labor intensive. Banana plants are often used as shade for crops such as cacao or coffee.

Banana packing plant. Credit: Sagarpa.

Banana packing plant. Credit: Sagarpa.

Challenges for the commercial cultivation of bananas

Weather and climatic hazards

Banana plants can easily be damaged by strong wind and entire plantations can be destroyed by tropical storms and hurricanes.

Disease

Bananas are susceptible to a wide variety of pests and diseases. For example, Panama disease (aka Black Wilt), an infection in the soil, ravaged banana plantations throughout the Caribbean and Central American in the 1950s, virtually wiping out the Gros Michel variety cultivated at that time. The more fragile Cavendish bananas proved resistant, though they required more specialist packing. A new strain of Panama disease (Tropical race 4) capable of killing Cavendish bananas has emerged in Asia, but has yet to reach Latin
America.

Fungal diseases such as black sigatoka are one of the current major issues faced by banana producers. To combat black sigatoka, plantations may be aerially sprayed with pesticides from helicopters. Black sigatoka has already reduced banana yields in some parts of the world by up to 50%. Fighting this disease apparently now accounts for about 30% of Chiquita’s costs.

Commercial bananas have limited genetic variability and limited resistance to disease. This has led some experts to argue that fungal diseases may wipe out commercial banana plantations permanently, though the Food and Agriculture Organization (FAO) disagrees. The FAO argues that export varieties of bananas make up only about 10% of the total world banana crop, and that considerable genetic diversity remains in the plants grown for local consumption by small-scale farmers in developing countries.

Pesticide applications and pollution

Numerous studies have suggested that commercial banana production is often accompanied by high levels of pollution, both of the soil and of water courses. For example, the authors of “Soil and Water Pollution in a Banana Production Region in Tropical Mexico” studied an area of 10,450 hectares in Tabasco where the “agricultural activities are primarily banana production and agro forestry plantations (Spanish cedar and bananas).”

The area had been sprayed weekly with the pesticide Mancozeb for a decade at an application rate of 2.5 kg/ha/week. The study monitored soil, surface, subsurface and groundwater pollution. It found that there was a “severe” accumulation of manganese in the soil, while surface and subsurface water was “highly polluted” with ethylene thiourea, the main metabolite of Mancozeb. The authors concluded that “The level of pollution in the region presents a worrisome risk for aquatic life and for human health.”

Banana research

In Latin America, the Honduran Foundation for Agricultural Research is a leading banana breeding center and the source of many promising hybrids, including some that can either be cooked when green (like plantains) or eaten as ripe bananas. It usually takes decades to develop and introduce a new hybrid. Scientists are also working on genetically-engineered (GE) bananas that will remain ripe longer, and are trying to develop dwarf hybrids that produce large amounts of fruit for their weight, are easy to work, and less susceptible to storm damage.

Sources for science of cultivation methods and issues:

  • Morton, Julia. 1987. Banana, chapter in Fruits of warm climates.
  • Violette Geissen, Franzisco Que Ramos, Pedro de J. Bastidas-Bastidas, Gilberto Díaz-González, Ricardo Bello-Mendoza, Esperanza Huerta-Lwanga, and Luz E. Ruiz-Suárez, 2010. “Soil and Water Pollution in a Banana Production Region in Tropical Mexico”, in Bull. Environmental Contamination and Toxicology, October 2010, 407–413.

Related posts:

Apr 032014
 

Geo-Mexico agrees entirely with Joseph Kerski (a key member of ESRI’s Education Team), that it is amazing “how little American students really know about their neighbor to the south.” In order to help remedy this situation, ESRI’s Witold Fraczek has created a series of online “story maps” about Mexico. The maps can be accessed in several different ways, including as an ArcGIS Online presentation and an iPad iBook, or via this webpage.

The six stories are entitled:

Each “story” includes several maps (covering topics such as population, landforms, climate, historical landmarks, caves, indigenous cultures, tourist attractions), some of which are interactive in the sense that clicking on a marked point brings up a pop-up panel with a photograph and/or additional information about that place. The maps, linked by short commentary notes, can be viewed at a variety of scales.

This series of maps has many strong points, and could certainly be useful in some geography classes, but it also has some weaknesses that should be taken into account when using them. Brief comments follow on each of the six stories.

1 Explore Mexico (Crime vs. Tourism)

The first map in this mini-series depicts “tourism attraction density” based on “650 major points of interest”. No clues are offered as to how the 650 points were selected, and indeed, some can not really be shown by points on a map since they cover larger areas. The map appears to weight all 650 points equally, though some are major, major tourist attractions (like the pyramids of Teotihuacan) that attract thousands of visitors a day, while others are very much less significant.

The second map, showing the “20 cities with most murders” uses data from 2011 (now out-dated) to conclude that “crime, measured by the total number of murders” appears to be “spatially isolated from the areas most attractive to tourists”. Surely murder rates (per 100,000 people) are a better measure than the number of murders in each city?

Murder rate per 100,000 is used as the basis for comparing Mexico with its regional neighbors, but Mexico is so large (and the murder rates across the country so varied) that comparisons at this scale mean relatively little, especially when some of the nations are tiny Caribbean islands, where one or two murders extra in any year can mean a significant spike in their murder rate.

2. Mexico’s Natural Wonders

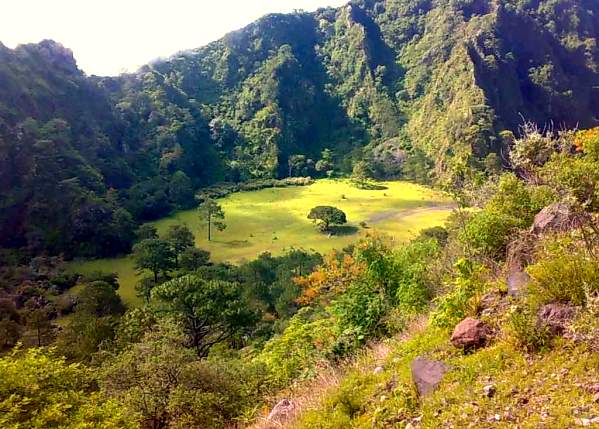
The introductory text to this section rightly highlights how “the natural world of Mexico varies amazingly, from tropical jungles and coral reefs to deserts and glaciers.”

However, the statement that “Central Mexico is home to billions of Monarch Butterflies, whose 2 year /4 generation long trip to Canada and back amazes both scientists and the general public” is misleading. First, there may be millions of Monarch Butterflies, but there are not billions. Secondly, not all Monarch Butterflies migrate. Thirdly, those that do migrate are part of an annual (1 year) cycle involving 4 or 5 generations, not a two year cycle.

The text later claims that the Monarch Butterfly reserves “are located on old volcanic hills covered with pine-oak forest”. Actually, they overwinter in pine-fir forests. Mexico’s pine-oak woodlands occur only at much lower elevations.

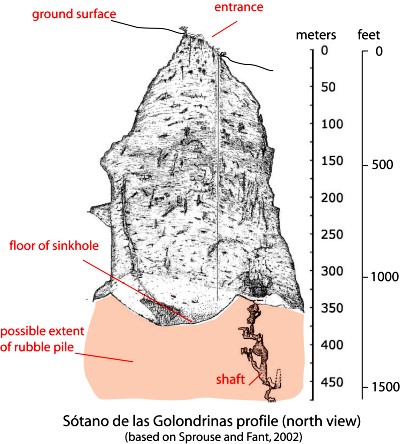
The only birds incorporated into Mexico’s “biological wonders” are its pink flamingos, yet there are dozens of other bird species that are equally worthy of inclusion. Fortunately, the texts accompanying the maps of caves and cenotes (sinkholes), waterfalls, volcanoes, canyons and geologic sites appear to be much more accurate.

Screenshot from ESRI's story maps of Mexico.

Screenshot of ESRI’s story maps of Mexico.

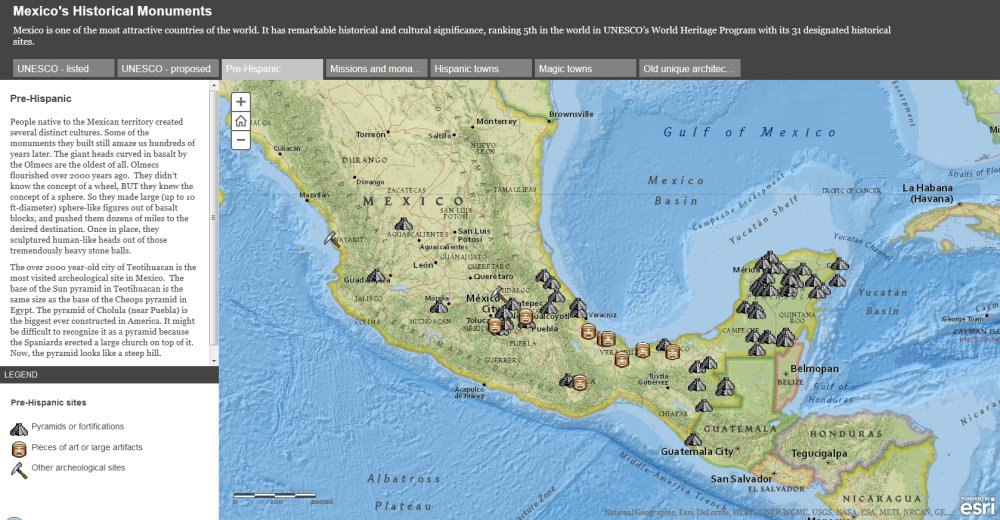
3. Historical monuments

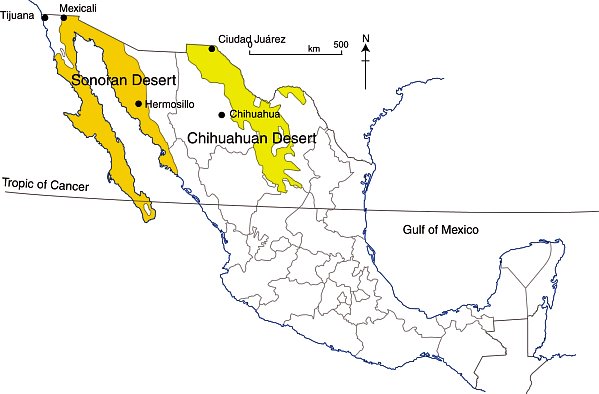
This section includes a useful map of Mexico’s World Heritage sites, though absent (from both the declared sites and the proposed sites) is the El Pinacate and Gran Desierto de Altar Biosphere Reserve in Sonora, which in June 2013 became Mexico’s 32nd World Heritage Site.

The great weakness of the maps of “archaeological sites” and “missions and monasteries” is that no clues are given as to how and why particular locations were selected for inclusion. This leads to some anomalies in the distribution. For example, Oaxaca is almost a no-show for “missions and monasteries” according to the map, despite such buildings being the subject of an excellent and extensive book by Richard Perry published as long ago as 2006, Exploring Colonial Oaxaca: The Art and Architecture.

The map of Magic Towns is also a useful map, though many more towns have been added to the list since 2012.

4. Geography of Mexico – Did You Know?

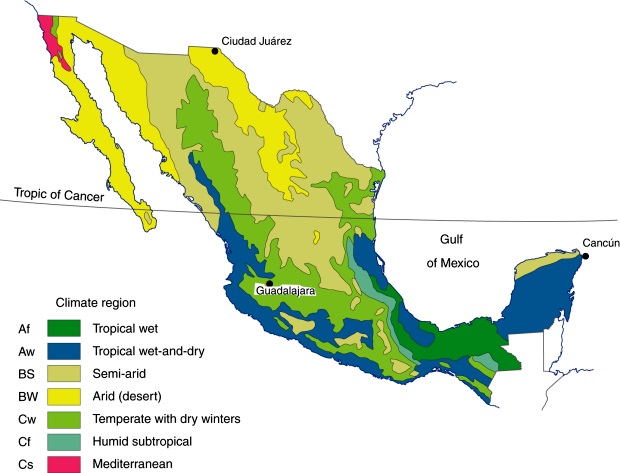
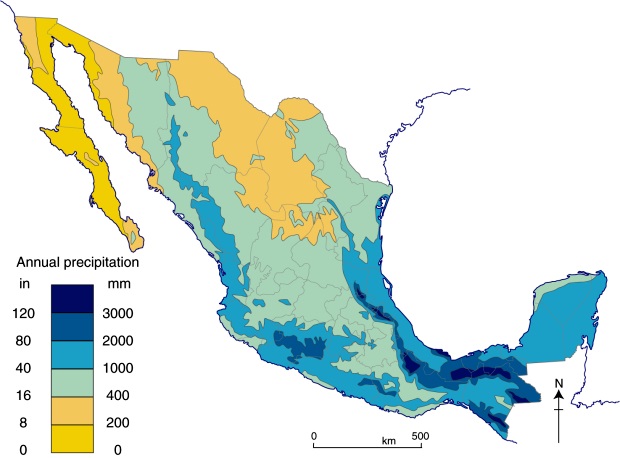
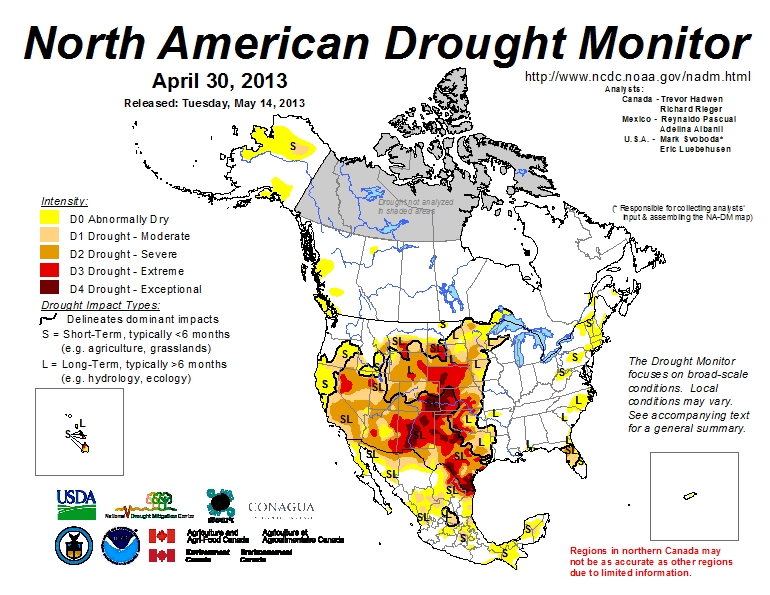
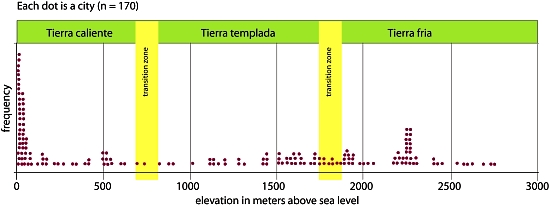
This series of maps will be quite useful to many classes as a quick way to introduce the basic physical and settlement geography of the country. Maps of relief and precipitation are accompanied by one of time zones and a simple map of states (though these are not named on the “map story” version) and major cities.

The introductory text to this section claims that “the array of Mexican volcanoes stretches along the same latitude as the volcanoes of Hawaii. Analogously, those located at the eastern ends are the newest and highest.” This may be true for Hawaii, but is not the case for Mexico. There is no simple pattern to the heights of Mexico’s major volcanoes, and certainly those in the east are not significantly younger than those in the west.

5. Indigenous People of Mexico

The single map in this section attempts to show the location of about 25 of Mexico’s many indigenous groups. The colors chosen for each group are in many cases confusingly similar, though the names of each group do appear as you zoom in on parts of the map.

The introductory text makes a strong case for Mexico’s attractiveness to tourists, yet concludes with the strange (and unanswered) question, “So why isn’t Mexico a major tourist destination?” Mexicans would beg to differ. Mexico is a major tourist destination. In 2013, for example, it received 23.7 million international visitors who spent 13.8 billion dollars. In fact, Mexico is ranked #11 in the world in terms of tourist arrivals (and that number excludes the 70 million or so border tourists each year).

6. Cartograms of Mexico

The cartograms in the last section certainly add interest to the map stories, but the basis of the “travelers attractiveness” map (those 650 tourist attractions again) means that the map is not a very good reflection of tourist numbers across the country. The significance of the State of Mexico is greatly exaggerated, while states such as Quintana Roo (with the resort of Cancún) and Baja California Sur (with Los Cabos) fail to stand out.

The final “fictional map” purports to portray Mexico as perceived by Californians. Based on the author’s personal impressions, in some ways this is the single most interesting map in the entire collection!

All in all, these maps are a mixed bag. The idea behind them is great, as is the decision to produce them in a flexible GIS system. If the details were refined a little, and more explanation offered about the basis for selecting places for inclusion, they would be even more useful in geography classes, and might go some way towards helping American students gain a better appreciation for their southern neighbor.

Latin America’s biggest solar energy plant helps power La Paz

 Mexico's geography in the Press, Updates to Geo-Mexico  Comments Off on Latin America’s biggest solar energy plant helps power La Paz
Mar 312014
 

Latin America’s largest solar power plant is now supplying power to the city of La Paz in Baja California Sur. The Aura Solar I photovoltaic power plant has an installed capacity of 30 MW. The plant was officially inaugurated on 19 March 2014, and will supply about 82 GWh/year of electricity to around 164,000 residents of La Paz, more than two-thirds the city’s total population of 220,000. It is located a short distance east of the city, and replaces an old, air-polluting thermoelectric plant.

Auro Solar 1 project, La PazThe new power plant, owned by Corporación Aura Solar, is the largest photovoltaic power plant in Latin America, according to company chairman Daniel Servitje Montull. The 100-million-dollar plant occupies 100 hectares (250 acres) and was constructed by engineering firms Gauss Energía and Martifer Solar. The project relies on about 131,800 solar panels and has an estimated operational life of 30 years. About 25% of Mexico’s electricity is currently generated using clean energy sources. Mexico has set a national target of 35% clean energy by 2024, in order to minimize Mexico’s contribution to global climate change.

This 2-minute YouTube video shows various stages in the building of the plant:

Related posts:

Mar 062014
 

In The market for commercial and industrial real estate in Mexico, we looked at a recent snapshot of the industrial real estate market in the last quarter of 2013, and saw how cities in the Bajío Region were outpacing cities in Central Mexico or Northern Mexico. (The snapshot came from the report ‘Industrial Markets in México (Q4 2013)‘ by Jones Lang LaSalle, a global real estate services firm.)

In this post, we take a look at the “Industrial Property Clock” for the same period, from the same report.

Industrial property clock (Jones Lang LaSalle)

Industrial property clock (Jones Lang LaSalle)

In general, cities in Central Mexico and in the Bajío are well “ahead” of cities in northern Mexico on this clock. The analysis by Jones Lang LaSalle suggests that the commercial and industrial property markets in Mexico City, Guanajuato, Guadalajara, San Luis Potosí, Puebla and Toluca are “peaking”. The two remaining cities in the Bahío (Querétaro and Aguascalientes) are joined by several cities in northern Mexico in the “rising market” portion of the graph, while Reynosa, Matamoros, Nuevo Laredo and Chihuahua are anchored in the “bottoming market” portion.

The following quotes are taken from the report:

Mexico City’s industrial market grows its footprint annually; rents have grown to pre-crisis levels

Puebla market is very tight; land is scarce and vacancy is at a low

Toluca market has been growing as an alternative to Mexico City, it is also attracting local businesses

Guanajuato is growing in several submarkets like Silao and Celaya thanks to car manufacturing and food related businesses

Guadalajara keeps occupying space and growing at El Salto and South Periférico

San Luis Potosí keeps attracting new industries related to consumer goods. The car manufacturing industry is taking advantage of the city’s communications and infrastructure

Querétaro has been active inaugurating new developments near the airport both for the aerospace business and for car manufacturing. These industries have taken advantage of the local educated labor force

Aguascalientes seems to be the new frontier for developers: at least three major national developers have inaugurated parks in this market, one of them is Nissan’s supplier park

Tijuana continues its path towards quickly becoming a speculative development marketplace once again. It is the first border city to regain this business climate

Nogales, the smallest of the Northwest Border region cities, is also enjoying the expansion of Kimberly Clark (KCI) leasing vacant space within the Nuevo Nogales Industrial Park

Ciudad Juárez keeps lowering the existing vacancy rate

Monterrey submarkets have been improving, especially Apodaca and Santa Catarina, where land prices and rents are growing

Nuevo Laredo, Reynosa and Matamoros have seen a slow down in their activities, however, tenants have stayed at their buildings; there are no new developments on the horizon and vacancy rates are around 10%

Related posts:

The pattern of farm sizes in Mexico: is there a north-south divide?

 Other  Comments Off on The pattern of farm sizes in Mexico: is there a north-south divide?
Feb 242014
 

In 2007, INEGI census recorded 2.4 million “units of production” (farms) under 2 hectares in size. This number is 43.5% of all farms, and includes farms not being actively worked. 22.9% of farms were between 2 and 5 hectares in area and a further 23.4% between 5 and 20 hectares. In sum, almost 90% of all farms had an area of 20 hectares or less. At the other end of the size spectrum, 2.2% of farms were larger than 100 hectares.

In terms of land tenure, 68.5% of all farms were in ejidos (a form of collective farming), 28.5% held privately and the remaining 3% were other (communal, public, mixed). Almost three-quarters of all farms under 20 hectares in area are ejidos, whereas about three-quarters of all farms over 100 hectares in size are private.

Map of average farm size in Mexico, by state, 2007

Map of average farm size in Mexico, by state, 2007. Data: INEGI. Credit: Tony Burton/Geo-Mexico

The choropleth map (above) shows the average size of farms (in hectares) by state. It is very clear that larger farms are concentrated in northern Mexico. All the states along the US border have average farm sizes in excess of 100 hectares. At the other extreme, a ring of states in central Mexico (centered on the Federal District) have average farm sizes that are below 5 hectares. The average farm size is slightly larger to the south of that ring of tiny farms, and significantly larger towards the east, including those states comprising the Yucatán Peninsula.

The general pattern is of a north-south division, which becomes even clearer when the average farm sizes are plotted as an isoline map. With minor exceptions, the “surface” represented by these isolines slopes steeply away form the highest values in north-western Mexico towards the south-east.

Average farm size in Mexico

Average farm size in Mexico. Data: INEGI Credit: Tony Burton / Geo-Mexico

Classroom exercise

Having recognized this pattern in farm sizes, can you think of reasons that might explain it? The short answer is that farm sizes vary in response to a multitude of factors, These include historical, demographic, and socioeconomic factors as well as relief, climate, natural vegetation and soils.

Q1. Compare the maps in this post with maps for some of the factors you think might be important. (Try our Geo-Mexico Map Index as a starting point). For example, the northern area of Mexico, the area with largest farms, is primarily semi-arid or arid. Why might farms in arid and semi-arid areas be larger than in other areas?

Q2. Have a class discussion about the relative importance of the factors that have been identified or suggested.

Q3. Discuss the relative merits of the two mapping methods used in this post (choropleth and isoline) to portray average farm sizes.

Related posts:

Geo-Mexico has many other agriculture-related posts (easily found via our tag system). They include posts about the geography of growing/producing Christmas trees, cacao, honey, sugarcane, coffee, chiles, floriculture, tomatoes, tequila, horticultural cropsand oranges. Also worth reading are:

Mexico and US agree to work together to fight trans-border wildfires

 Mexico's geography in the Press  Comments Off on Mexico and US agree to work together to fight trans-border wildfires
Feb 222014
 

Mexico’s National Forestry Commission (Comisión Nacional Forestal, Conafor) and the US Forest Service have signed an agreement aimed to ensure more efficient fire-fighting when dealing with wildfires on the border of Sonora/Arizona. The agreement, the Bi-national Convention on Forest Fires (Convenio Binacional de Incendios Forestales) is designed to increase public safety on either side of the border, reduce habitat loss, and facilitate the exchange of information about wildfires, leading to improved preventative measures and firefighter training.

The Convention establishes that when a fire is detected in the municipalities of Nogales, Naco, Agua Prieta or Santa Cruz, a united bi-national command can be established to ensure effective collaboration between the two countries’ firefighters. Firefighting brigades, together with supporting vehicles and aircraft, will be authorized to cross the border by up to 16 km (10 miles) in either direction when battling wildfires, provided they give prior notice to the relevant migration, security and customs agencies in the country concerned.

Coahuila wildfire, April 9, 2011 (Earth Observatory, Landsat-5)

Coahuila wildfire, April 9, 2011 (Earth Observatory, Landsat-5)

Mexico’s worst ever year for forest fires was in 1998, when 14,400 were recorded. In the past three years, 2011 was easily the most disastrous in terms of wildfires, with more than 12,000 fires reported:

  • 2011 – 12,113 fires, affecting  956 square km
  • 2012 –  7,170 fires, affecting 347 square km
  • 2013 – 10,406 fires, affecting 413 square km

In 2013, 99% of wildfires were attributed to “human actions”, with 36% of all fires resulting from deliberate agricultural burn-offs getting out of control.

The main wildfire season is from February to May each year. May is the critical month because it marks the end of the dry season in most of Mexico, the time when the natural landscape looks parched. During May, as the landscape waits for the start of the rainy season, precursor electrical storms are relatively common. Electrical storms can easily trigger wildfires if they ignite the tinder-dry vegetation.

Related posts:

Retirees and “residential tourism”: a case study of Chapala-Ajijic in Jalisco

 Excerpts from Geo-Mexico  Comments Off on Retirees and “residential tourism”: a case study of Chapala-Ajijic in Jalisco
Jan 162014
 

Retirees, mainly from the USA and Canada, form a special subgroup of tourists. About 1 million US visitors to Mexico each year are over the age of 60. Their total expenditure is about $500 million a year. Three-quarters arrive by air; half of these stay 4-8 days and almost one in ten stays 30 days or longer. Half stay in hotels, and one-third in time-shares; the remainder either stay with family or friends, or own their own second home. Of the 25% arriving by land, almost one in three stays 30 days or more. For Canadians, the patterns are broadly similar except that a higher percentage arrive by air.

The number of retiree tourists is relatively easy to quantify. However, it is extremely difficult to place accurate figures on the number of non-working, non-Mexicans who have chosen to relocate full-time to Mexico. Technically, these “residential tourists” are not really tourists at all but longer-term migrants holding residency visas. They form a very distinct group in several Mexican towns and cities, with lifestyle needs and spending patterns that are very different from those of tourists. Their additional economic impact is believed to exceed $500 million a year.

Map of Lake Chapala, Jalisco, Mexico

Map of Lake Chapala, Jalisco, Mexico. Credit: Tony Burton; all rights reserved.

The largest single US retirement community outside the USA is the Guadalajara-Chapala region in Jalisco, according to state officials (see map). The metropolitan area of Guadalajara, Mexico’s second city, has a population of about 4 million. The villages of Chapala and Ajijic (combined population about 40,000) sit on the north shore of Lake Chapala some 50 km (30 mi) to the south. Historically, Chapala was the first lakeshore settlement to attract foreign settlers, as early as the start of the 20th century. Today the area is home to a mix of foreign artists, intellectuals, escapees (of various non-judicial kinds), pensioners and ex-servicemen. In the last 40 years, Ajijic has become the focal point of the sizable non-Mexican community living on the lakeshore. Depending on how they are defined, there are probably between 6000 and 10,000 foreign residents in the Chapala-Ajijic area, the higher number reflecting the peak winter season. About 60% of retirees in the area own their own homes or condos, though many still own property in the USA or Canada as well, and many make regular trips north of the border.

The main pull factors for residential tourists are an amenable climate; reasonable property prices; access to stores, restaurants and high quality medical service; an attractive natural environment; a diversity of social activities; proximity to airports; tax advantages, and relatively inexpensive living costs.

David Truly has suggested that conventional tourist typologies do not work well with Ajijic retirees. He identified migrant clusters with similar likes and dislikes. Retirees vary in education, travel experience and how they make decisions about relocation. Early migrants tended to dislike the USA and Canada and adapted to life in Mexico. They were generally content with anonymity unlike many more recent migrants. Traditional migrants appreciate all three countries, but have chosen Mexico as their place of permanent residence. Many new migrants do not especially like the USA or Canada but are not particularly interested in Mexico either. They seek familiar pastimes and social settings and are content to have relatively little interaction with Mexicans.

The large influx of residential tourists into small lakeside communities like Ajijic inevitably generates a range of reactions among the local populace. From empirical studies of regular tourism elsewhere, George Doxey developed an “irritation index” describing how the attitudes of host communities change as tourist numbers increase. His model applies equally well to residential tourists. In the initial stage the host community experiences euphoria (all visitors are welcome, no special planning occurs). As numbers increase, host attitudes change to apathy (visitors are taken for granted) and then annoyance (misgivings about tourism are expressed, carrying capacities are exceeded, additional infrastructure is planned). If numbers continue to grow, hosts may reach the stage of antagonism, where irritations are openly expressed and incomers are perceived as the cause of significant problems.

Residential tourism in the Chapala-Ajijic area has certainly wrought great changes on the landscape. Residential tourists have created a distinct cultural landscape in terms of architectural styles, street architecture and the functions of settlements. (Browse the Chapala Multiple Listing Service New Properties). Gated communities have been tacked on to the original villages. Subdivisions, two around golf courses, have sprawled up the hillsides. Swimming pools are common. Much of the signage is in English. Even the central plazas have been remodeled to reflect foreign tastes. Traditional village homes have been gentrified, some in an alien “New Mexico” style.

On the plus side, many retirees, as a substitute for the family they left behind, engage in philanthropic activities, with a particular focus on children and the elderly. Retiree expenditures also boost the local economy. Areas benefiting from retirees include medical, legal and personal services, real estate, supermarkets, restaurants, gardening and housecleaning. Employment is boosted, both directly and indirectly, which improves average local living standards.

On the minus side, decades of land speculation have had a dramatic impact on local society. Land and property prices have risen dramatically. Many local people have become landless domestic servants, gardeners and shop-keepers with a sense that the area is no longer theirs. Crime levels have risen and some local traditions have suffered. The abuse of water supplies has resulted in declining well levels. Over zealous applications of fertilizers and pesticides have contaminated local water sources.

Other locations besides Chapala-Ajijic where a similar influence of non-Mexican retirees on the landscape can be observed include San Miguel de Allende (Guanajuato), Cuernavaca (Morelos), Mazatlán (Sinaloa), Puerto Peñasco (Sonara), Rosarito (Baja California) and Todos Santos (Baja California Sur). The most preferred locations are all on the Pacific coast side of Mexico.

As more baby-boomers reach retirement age, residential tourism offers many Mexican towns and cities a way of overcoming the seasonality of conventional tourism. Lesser-developed regions have an opportunity to cash in on their cultural and natural heritage and improve their basic infrastructure.

This is a lightly edited excerpt from chapter 19 of Geo-Mexico: the geography and dynamics of modern Mexico.

References:

  • Boehm S., B. 2001 El Lago de Chapala: su Ribera Norte. Un ensayo de lectura del paisaje cultural. 2001. Relaciones 85, Invierno, 2001. Vol XXII: 58-83.
  • Burton, T. 2008 Lake Chapala Through the Ages, an Anthology of Travellers’ Tales. Canada: Sombrero Books.
  • Doxey G.V. 1975 A causation theory of visitor‑resident irritants: methodology and research inferences. Proceedings of the Travel Research Association, San Diego, California, USA: 195‑8.
  • Stokes, E.M. 1981 La Colonia Extranero: An American retirement Community in Ajijic, Mexico. PhD dissertation, University of New York, Stony Brook, cited in Truly, D. 2002.
  • Truly, D. 2002 International Retirement migration and tourism along the Lake Chapala Riviera: developing a matrix of retirement migration behavior. Tourism Geographies. Vol 4 # 3, 2002: 261-281.
  • Truly, D. 2006 The Lake Chapala Riviera: The evolution of a not so American foreign community, in Bloom, N.D. (ed) 2006 Adventures into Mexico: American Tourism beyond the Border. Rowman & Littlefield: 167-190

Related posts:

Water management progress in the Lerma-Chapala basin

 Books and resources  Comments Off on Water management progress in the Lerma-Chapala basin
Jan 112014
 

The Lerma-Chapala Basin (see map) is one of Mexico’s major river systems, comprising portions of 127 municipalities in five states: México, Querétaro, Michoacán, Guanajuato and Jalisco.

The basin has considerable economic importance. It occupies only 2.9% of Mexico’s total landmass, but is home to 9.3% of Mexico’s total population, and its economic activities account for 11.5% of national GDP. The basin’s GDP (about 80 billion dollars/year) is higher than the GDP of many countries, including Guatemala, Costa Rica, Honduras, Paraguay, Bolivia, Uruguay, Croatia, Jordan, North Korea and Slovenia.

Lerma-Chapala Basin

The Lerma-Chapala Basin. Click map to enlarge. Credit: Tony Burton / Geo-Mexico

Given this level of economic activity, it is probably not surprising that the pressures on natural resources in the basin, especially water, are enormous. Historically, the downstream consequence of the Lerma Basin’s agricultural and industrial success has been an inadequate supply of (heavily polluted) water to Lake Chapala.

Following decades of political inactivity or ineffectiveness in managing the basin’s water resources, solid progress finally appears to have been made. Part of the problem previously was a distinct lack of hard information about this region at the river basin scale. The statistics for such key elements as water usage, number of wells, replenishment rates, etc. were all (to put it politely) contested.

Fortunately, several scientific publications in recent years have redressed the balance, and the Lerma-Chapala Basin is now probably the best documented river basin in Mexico. This has allowed state and federal governments to negotiate a series of management agreements that are showing some positive signs of success.

The first of these key publications was “The Lerma-Chapala Watershed: Evaluation and Management“, edited by Anne M. Hansen and Manfred van Afferden (Klewer Academic/Plenum Publishers, 2001). This collection of articles featured contributions from researchers in several universities and research centers, including the University of Guadalajara, Mexican Institute of Water Technology, Autonomous University of Guadalajara, Baylor University, the Harvard School of Public Health and Environment Canada. Click here for my comprehensive description and review of this volume on MexConnect.com.

Perhaps the single most important publication was the Atlas de la cuenca Lerma-Chapala, construyendo una visión conjunta in 2006. Cotler Ávalos, Helena; Marisa Mazari Hiriart y José de Anda Sánchez (eds.), SEMARNATINE-UNAM-IE, México, 2006, 196 pages. (The link is to a low-resolution pdf of the entire atlas). The atlas’s 196 pages showcase specially-commissioned maps of climate, soils, vegetation, land use, urban growth, water quality,  and a myriad of other topics.

More recently, a Case Study of the Lerma-Chapala river basin: : A fruitful sustainable water management experience was prepared in 2012 for the 4th UN World Water Development Report “Managing water under uncertainty and risk”. This detailed case study should prove to be especially useful in high school and university classes.

The Case Study provides a solid background to the Lerma-Chapala basin, including development indicators, followed by a history of attempts to provide a structural framework for its management.

In the words of its authors, “The Lerma Chapala Case Study is a story of how the rapid economic and demographic growth of post-Second World War Mexico, a period known as the “Mexican Miracle”, turned into a shambles when water resources and sustainable balances were lost, leading to pressure on water resources and their management, including water allocation conflicts and social turbulence.”

On a positive note, the study describes how meticulous study of the main interactions between water and other key development elements such as economic activity and social structures, enabled a thorough assessment on how to drive change in a manner largely accepted by the key stakeholders.

The early results are “stimulating”. “Drawbacks and obstacles are formidable. The main yields are water treatment and allocation, finances, public awareness, participation and involvement. The main obstacles are centralization, turbid interests, weak capacity building, fragile water knowledge; continuity; financial constraints; and weak planning.”

Sustainable water usage is still a long way off. As the Case Study cautions, “There is still much to do, considering the system Lerma-Chapala responds directly to a hydrologic system where joint action and especially abundant involvement of informed users is required, to achieve sustainable use of water resource.”

One minor caveat is that the Case Study does not offer full bibliographic reference for all of the maps it uses, which include several from the previously-described Atlas de la cuenca Lerma-Chapala, construyendo una visión conjunta.

Related posts:

Mexico’s January weather serves as a long-range forecast

 Other  Comments Off on Mexico’s January weather serves as a long-range forecast
Jan 042014
 

Many Mexicans use January’s weather to forecast what the weather will be like for the rest of the year.

Many Mexicans, especially campesinos (peasant farmers), who are closer to the land than most, believe that the weather during the month of January serves as a long-range forecast for the entire year. The precise prediction system, known as las cabañuelas, is thought to be based on long cycles of observations carried out in an age when people depended far more on the weather than they do today. The system is quite complicated.

The first twelve days of January are known as las cabañuelas “a derechas”. The weather on January 1 foretells the likely weather for the rest of the month. The weather on January 2 predicts the weather for February and so on, with the weather of January 12 suggesting likely conditions for December. The next twelve days (January 13 to 24 inclusive) are known as las cabañuelas “a rataculas”. This time, the weather of January 13 foretells December, that of January 14 November, and so on.

Jan 18: Pondering a miserable July

Next, each of the six days from January 25 to January 30 inclusive is divided at noon. The morning of January 25 represents January, the afternoon February. The morning of January 26 hints at March’s weather, while the afternoon applies to April’s, and so on.

Finally, even the 24 hours of January 31 are used. Each hour in the morning will be reflected in the weather from January to December. (Presumably the weather from midnight to 1.00am is a true reflection of what has already happened in January!) Then, each hour in the afternoon can be used to forecast future weather in the reverse direction. Hence, noon to 1.00pm gives us clues for December, 1.00 to 2.00pm for November and so on. Apparently, an alternative version, used in some parts of northern Mexico, divides January 31 into 12 periods of 2 hours each, with each division corresponding to the months in reverse order.

Whatever the details, the system is said to be at least as reliable as scientific forecasts over the same time period. (Though, thinking about it, perhaps that is not that hard!)

The same cabañuelas system is used in various parts of Spain, but the annual forecast does not always begin on the same day. For instance, in Alcozar, las cabañuelas “a derechas” begin on December 13. Elsewhere in Spain, they start on August 2 or August 13. According to Divina Aparicio de Andrés, predictions in Alcozar based on las cabañuelas lasted until well into the 1940s, but their use has declined since.

See also: The origins of the cabañuelas system of weather forecasting

This is an edited version of an article originally published on MexConnect.com

The climate of Mexico is discussed, with several maps,  in chapter 4 of Geo-Mexico: the geography and dynamics of modern Mexico. Climatic hazards, such as hurricanes, droughts and floods, are looked at in detail in chapters 4 and 7. Mexico’s cultural geography and cultural landscapes are discussed in chapter 13.

Dec 052013
 

After studying 22 countries with sizable retirement communities, International Living (a consultancy group) rated Mexico as the fourth most attractive country for foreigners to retire to in 2013, after Ecuador, Panama and Malaysia. The study looked at eight factors: real estate, benefits for retired people, cost of living, integration, entertainment, health, infrastructure and climate.

According to the US Census Bureau, there are 41 million people of retirement age in the USA. More than half of them have annual incomes of between 70,000 and 150,000 dollars, and they are expected, on average, to live to the age of 83; 80% are home owners. This number will swell to 72.8 million by 2030, 40% of whom may have difficulties maintaining their previous lifestyles during retirement. Given its proximity, this makes Mexico an attractive destination for many baby-boomers seeking a comfortable retirement lifestyle.

But where in Mexico will these retirees choose to live?

According to this analysis by the consultancy Aregional, there are 36 specific areas in Mexico where the real estate market is targeting US baby boomers seeking a place to retire. About half of these locations (see map) are in central and western Mexico. Locations in these regions include Guanajuato and San Miguel de Allende (both in the state of Guanajuato), Colima, Comala and Manzanillo (Colima); Chapala, Ajijic and Puerto Vallarta (Jalisco); and Nuevo Vallarta and Punta Mita (Nayarit).

Locations of retiree real estate developments. Credit: Aregional

Locations of retiree real estate developments. Credit: Aregional

Locations in northern Mexico important for retiree real estate include Rosarito, Ensenada and Los Algodones (Baja California); Los Cabos, La Paz and Loreto (Baja California Sur); Puerto Peñasco (Sonora) and Mazatlán (Sinaloa). [Kudos to RickS for noticing that Puerto Peñasco is not located very accurately!]

Retiree real estate is also prominent in several places in the south and south-east of Mexico, including  Acapulco and Punta Ixtapa (Guerrero); Huatulco (Oaxaca); Playa del Carmen and Cancún  (Quintana Roo); Puerto Progreso (Yucatán), as well as the cities of Campeche and Veracruz.

It is not known how many US retirees have already chosen to live in Mexico. While it is relatively easy to quantify the number of retiree tourists (those staying more than one night, but less than six months), it is impossible to accurately quantify the number of non-working, non-Mexicans who have chosen to relocate full-time to Mexico. Technically, these “residential tourists” are not really tourists at all but longer-term migrants holding residency visas.

Residential tourists already form a very distinct group in several Mexican towns and cities, with lifestyle needs and spending patterns that are very different from those of regular tourists. Their additional economic impact is believed to exceed $500 million a year.

A case study of residential tourism, and its pros and cons, in Chapala-Ajijic on the northern shore of Lake Chapala is an integral part of chapter 19 of Geo-Mexico: the geography and dynamics of modern Mexico.

Posts related to retirees in Mexico:

Why is northern Mexico a desert region?

 Excerpts from Geo-Mexico  Comments Off on Why is northern Mexico a desert region?
Oct 102013
 

Much of northern Mexico experiences either an arid (desert) climate (less than 250 mm [10 in] of rain/year) or a semiarid (semi-desert) climate (250–750 mm [10–30 in] of rain/year). Areas with an arid (desert) climate (see map) include most of Baja California and western Sonora (together comprising the Sonoran desert), as well as the northern section of the Central Plateau (the Chihuahuan desert). These areas can experience frost and freezing during the winter.

Major climate regions in Mexico. (Fig 4-5 of Geo-Mexico, the geography and dynamics of modern Mexico). All rights reserved.

Major climate regions in Mexico. (Fig 4-5 of Geo-Mexico, the geography and dynamics of modern Mexico). All rights reserved.

Areas of semiarid (dry steppe) climate include most of the Central Plateau as well as western sections of the Western Sierra Madre, northern Yucatán and scattered inland areas as far south as Oaxaca. The rains in this region fall mostly in the summer, and localized heavy thunderstorms are quite common. The southern parts of this climatic region are warmer than the northern parts. (Mexico’s seven climate regions)

Why do parts of northern Mexico receive very little precipitation, making them deserts?

The major reason is that the zone between the Tropic of Cancer (latitude 23.5 degrees N) and latitude 30 degrees N is influenced by the Hadley Cell. This is the name given to the atmospheric circulation in tropical regions, named after George Hadley, the English amateur meteorologist who first proposed its existence, in 1735.

The Hadley Cell

The functioning of the Hadley Cell

The Hadley Cell is the driving force behind many aspects of Mexico’s weather and climate. How does it operate? Solar heating is at a maximum near the equator and diminishes towards the poles. The area near the equator is the Intertropical Convergence Zone or ITCZ (see diagram). The heating of the ITCZ makes the air there rise, leaving an area of low pressure on the surface. This low pressure sucks in air along the earth’s surface from the subtropical high pressure areas about 30 degrees N and S of the equator creating the trade winds. The trade winds pick up moisture and latent heat over the oceans before converging from either side of the equator in the ITCZ. As the air in the ITCZ rises vertically, its water vapor condenses and rain falls from the towering convective clouds. This is the ascending limb of the Hadley cell. At a height of 10–15 km above the surface, the air, now minus its moisture, returns polewards as high level anti-trade winds. Sunbathers on Mexican beaches who notice two sets of clouds above them at different heights traveling in opposite directions are witnessing the trade winds and anti-trade winds in action.

In the subtropics, this air then descends again towards the surface to complete the cell and initiates the surface trade winds again. The descending air warms up as it sinks; its relative humidity decreases, and so no precipitation occurs; hence these high pressure subtropical areas are arid. Mexico’s arid and semiarid areas coincide with the descending air segment of the Hadley Cell and these high pressure subtropical areas.

In addition, the climate of the west coast of the Baja California Peninsula is influenced by the cool Californian current, which flows towards the south. The relative humidity of the air above it drops as the current enters warmer waters, so it is not likely to bring rain to the peninsula.

The aridity of the Sonoran desert is also partly due to its position in the rain shadow of the Western Sierra Madre. The Chihuahuan desert is in an even more marked rain shadow, protected by both the Western Sierra Madre and the Eastern Sierra Madre.

Stunning stream patterns in northern Baja California

Photographer Adriana Franco from Querétaro has taken several truly stunning artistic images of stream patterns in the semi-arid region of northern Baja California (near Mexicali). The photos, taken from an ultralight, show the details of the dendritic (= tree-like) stream patterns in this region. Dendritic stream patterns are common worldwide, but these images are exceptional. In general, dendritic stream patterns are associated with relatively gentle gradients where the underlying rocks are similar throughout the drainage basin.

Related posts

Jul 242013
 

The map below shows a regional division of Mexico by precipitation regime (the amount and seasonal distribution of precipitation). The small graph for each region shows the typical average precipitation amounts for each month of the year. (For example, region A has most precipitation in the first three or four months of the year, and very little after that). The map comes from Ernesto Jáuregai’s 1970 article about wind and water erosion in Mexico (full reference is given below).

Precipitation regimes in Mexico (Fig 2 of Jáuregai 1970)

Precipitation regimes in Mexico (Fig 2 of Jáuregai 1970)

It is clear from the map that the distribution of precipitation across Mexico is very uneven. In general the north and central plateaus are dry while the southeast receives by far the most rain. Parts of Tabasco, Northern Chiapas and Veracruz get over 4000 mm (160 in) of rain a year. This is a direct effect of the onshore north-east trade winds, which collect moisture as they cross the Gulf of Mexico and then deposit it as they reach land.

Average annual rainfall figures conceal great differences from one year to the next. In general, the variability of rainfall is indirectly proportional to the long-term average. This means that areas with low totals tend to experience high variability, greatly increasing their drought hazard.

The map also reveals that there is a marked seasonality to precipitation in almost all of Mexico, with a clear division into a wet and a dry season. Most places get almost all their rain between June and October, while January through May are dry months. Because most rainfall is in the summer months, about 71% of rainfall evaporates soon after falling. This figure can be even higher in urban areas. Only about 26% runs off into rivers and lakes, and 3% seeps down to recharge subterranean aquifers.

One apparent anomaly to the pattern shown on the map is that the extreme north-west corner of Baja California (region A) has a Mediterranean climate where summers are dry and most rain falls in winter. Elsewhere in Mexico winter months are relatively dry. Southern and central Mexico have markedly dry winters, receiving less than 5% of their annual precipitation totals in the first three months of the year. The northern half of Mexico and the eastern coastal strip, including the Yucatán peninsula, have slightly more balanced precipitation, receiving between 5 and 18% of annual totals between January and March.

Map reference:

Ernesto Jáuregai. 1970. “La erosión hidráulica y eólica en México y sus efectos en las estructuras hidráulicas y en los núcleos de población.” UNAM: Boletín del Instituto de Geografía, Vol III, pp 39-60.

 Related posts

The three main causes of precipitation in Mexico

 Excerpts from Geo-Mexico  Comments Off on The three main causes of precipitation in Mexico
Jul 222013
 

The three basic types of rainfall (convectional, orographic and cyclonic) all play a role in determining the amount and timing of precipitation in Mexico.

Why does it rain?

In Mexico, most precipitation falls as rain, though snowfalls are not uncommon in parts of northern Mexico or at the highest elevations where air temperatures are cooler. For precipitation to occur, the air must first acquire moisture. Warm air absorbs water through evaporation from nearby bodies of water and through evapotranspiration from plants. The amount of water the air holds compared to the maximum amount it can hold at that temperature is the relative humidity. If warm moist air rises, it will cool. As it cools, its relative humidity rises. If relative humidity reaches 100% and condensation nuclei (particles such as dust or contaminants) are present, then water vapor will condense out of the air to form clouds. As clouds develop, water molecules coalesce until individual drops are heavy enough to fall out of the cloud as precipitation. Ice crystals fall as snow, water falls as raindrops, frozen ice pellets fall as hail.

For precipitation to occur, the weight of the individual drops must be sufficient for the effects of gravity to overcome the upwards thrust of the surrounding air. In very unstable conditions where air is rising rapidly, individual raindrops must become much larger before they can fall out of the cloud. The largest raindrops will have traveled up and down inside the cloud repeatedly, gaining size, before they finally fall to the ground. The same principle applies to hailstorms which gather an additional layer of ice for every trip they make inside the cloud before falling.

Though Mexico is considered to be relatively arid, the country as a whole receives an average of about 760 mm (30 in) of rain per year. This is a considerable amount of precipitation, almost exactly the same amount as Toronto, and considerably more than the average for either Canada or the USA.

Annual precipitation in Mexico (Fig .4.3 of Geo-Mexico)

Annual precipitation in Mexico (Fig .4.3 of Geo-Mexico, the geography and dynamics of modern Mexico) All rights reserved.

The three main causes of precipitation in Mexico

Convectional rain is associated with hot afternoons. During the morning, warm air near the surface collects great quantities of moisture. As temperatures increase towards mid-day, pockets of moist warm air are sent upwards, quickly leading to condensation and clouds. As the clouds continue to rise, they cool to the point where precipitation becomes inevitable. Afternoon and evening rain showers result, often heavy and accompanied by thunder and lightening. Convectional rain occurs throughout Mexico but is a summer phenomenon since this is the time of year when solar radiation and ground heating is at a maximum. The effects of convectional rain are enhanced by the presence at that time of year over southern Mexico of the Intertropical Convergence Zone, a broad belt of generally rising air which migrates seasonally either side of the equator.

Orographic rainfall, the second type of rainfall, is associated with mountains. Mountains block the movement of clouds and force them to rise. This has a profound impact on precipitation. As the clouds rise, further condensation occurs and precipitation becomes extremely likely, as they cool to the point where they can no longer hold their moisture. Therefore, it rains a great deal on the windward or wet side of the range. By the time the air passes over the mountain range to the other side, it has lost much of its moisture. As it descends, it warms up and its relative humidity falls, so that there is little chance of any precipitation on the leeward side, known as the rain shadow.

For example, the summer north-east trade winds blow moist clouds from the Gulf of Mexico towards the Southern Sierra Madre and Chiapas Highlands. The eastern side of these mountains receives heavy rainfall. The mountain slopes in central Veracruz, eastern Oaxaca and parts of Chiapas have about 150 cloudy days and get about 2000 mm (80 in) of rain a year. However, the western slopes get only half as much rain and have only 90 cloudy days a year. Orographic precipitation sets virtually all the rainfall and snowfall records, even more than hurricanes. Tenango, Oaxaca is the rainiest place in Mexico; it receives about 5000 mm (16.4 ft) of rain each year. The orientation of mountain ranges is therefore critical to understanding precipitation patterns. The differences between windward and leeward sides of a mountain range can be very dramatic. For instance, El Chico and Pachuca in the state of Hidalgo are only 10 km apart but have 1500 and 400 mm of precipitation respectively each year.

The third type of rainfall is called cyclonic or frontal precipitation. This is the form of precipitation brought by the mid-latitude storms known as nortes, and the tropical storms that sometimes evolve into hurricanes. Nortes occur when the polar air behind a cold front displaces the warmer surface air, forcing it to rise as the cool air pushes its way underneath. At the surface, a sudden drop in temperature and the advent of cold winds marks the passage of the front, followed by several days of overcast skies with light rains or drizzle, onomatopoeically called chipichipis in some areas of Mexico.

 Related posts

Mexico and the Happy Planet Index

 Excerpts from Geo-Mexico, Updates to Geo-Mexico  Comments Off on Mexico and the Happy Planet Index
Jun 202013
 

Chapter 30 of Geo-Mexico, the geography and dynamics of modern Mexico includes a look at the Happy Planet Index (HPI). The HPI is a compound index that combines three measures:

  • life expectancy
  • life satisfaction
  • ecological footprint

In essence, the HPI shows how successfully people are achieving the good life without having to consume a disproportionate share of the Earth’s resources. The unbridled global pursuit of economic growth over the past fifty years has left more than a billion people in dire poverty. Far from bringing economic stability, it has encouraged the rampant abuse of resources while increasing the very real risks of unpredictable global climate change.

The HPI attempts to quantify an alternative vision of progress where people strive for happy and healthy lives alongside ecological efficiency in how they use resources. A high HPI score is only possible if a country is close to meeting the targets for all three components.

Environmental Sustainability Index and Happy Planet Index for selected countries. (Geo-Mexico. Figure 30.4) All rights reserved.

Environmental Sustainability Index and Happy Planet Index for selected countries. (Geo-Mexico. Figure 30.4) All rights reserved.

HPI scores (see graph) paint a very different picture to that suggested by either the ecological footprint or the Environmental Sustainability Index (ESI). While happy and healthy lives often go hand in hand, many countries with high values for those components (such as the USA and Canada) have disappointingly high ecological footprints, and end up with low HPI scores. The lowest HPI scores of all are found in sub-Saharan Africa where several countries do badly on all three components.

At the other end of the scale, nine of the top ten HPI scores are for countries in Latin America and the Caribbean where relatively high life expectancy and high personal lifestyle satisfaction is combined with modest footprints. Mexico ranks 22nd of the 151 countries studied, behind Argentina and Guatemala but well ahead of the UK, Canada and the USA.

Life expectancy

The life expectancy figure for each country was taken from the 2011 UNDP Human Development Report and reflects the number of years an infant born in that country could expect to live if prevailing patterns of age-specific mortality rates at the time of birth in the country stay the same throughout the infant’s life.

Mexico’s life expectancy is 77.0 and ranks #36 among the 151 countries analyzed. This is below the USA, which has a life expectancy of 78.4, but higher than Malaysia, which has a life expectancy of 74.2.

Life satisfaction

The data for life satisfaction (experienced well-being) draws on responses to the ladder of life question in the Gallup World Poll, which was asked to samples of around 1000 individuals aged 15 or over in each of the countries included in the Happy Planet Index.

Mexico’s experienced well-being score is 6.8 out of a possible 10. This is lower than the average level of experienced well-being in the USA (7.16), but higher than that of Germany (6.72).

Ecological footprint

Ecological Footprint is a metric of human demand on nature, used widely by NGOs, the UN and several national governments. It measures the amount of land required to sustain a country’s consumption patterns. For a majority of the countries (142 of the 151), Ecological Footprint data were obtained from the 2011 Edition of Global Footprint Network National Footprints Accounts. For the nine other countries, Ecological Footprint figures were estimated using predictive econometric models.

Mexico’s Ecological Footprint is 3.30 global hectares per capita. If everyone in the world had the same Ecological Footprint as the average citizen of Mexico, the world’s Ecological Footprint would be 20% larger and we would need to reduce our Ecological Footprints by around 80% in order to stay within sustainable environmental limits.

Summary

In summary, countries often considered to be ‘developed’ are some of the worst-performing in terms of sustainable well-being.

Unfortunately, given that the HPI scores for the world’s three largest countries (China, India, and the USA) all declined between 1990 and 2005, it does not seem that the situation is improving or will improve any time soon. Business as usual is literally costing us the Earth.

Related posts:

Jun 172013
 

Today (June 17) is the UN’s “World Day to Combat Desertification and Drought.”

How does Mexico stand right now in relation to drought? Drought currently affects about 40% of the country (see map). Some parts of northern Mexico have been experiencing a severe drought for almost three years. The worst affected states are Chihuahua, Nuevo León, Coahuila, Durango, Zacatecas, Tamaulipas, San Luis Potosí, together with parts of Querétaro, Aguascalientes, Sinaloa and Sonora.

Areas suffering from short-term and long-term drought, April 2013. Click map to enlarge.

Areas suffering from short-term and long-term drought, April 2013. Click map to enlarge.

Last year’s rains did reduce the area suffering from drought from 55.9% of Mexico to 38.6%, but that figure has risen to well over 40% this year.

In 2012, and earlier this year, many major cities, including Mexico City and Guadalajara, had to enforce water rationing for several months, supplying water to individual households only on certain days each week.

As this year’s rainy season begins in central Mexico, dozens of reservoirs are at critically low levels. Reservoirs in Coahuila average only 10% of their capacity, only slightly better than those in San Luis Potosí (12%). Even the populous state of Jalisco faces problems; its reservoirs are at 27% of capacity.

Things are unlikely to improve any time soon since the current long range forecast for this rainy season is for 30% less precipitation than the long term average.

The drought has already caused significant losses to farmers. Livestock owners in northern Mexico have culled herds and are having to buy in supplies of water to top up their private wells. Rainfall so far in 2013 has been well below long-term averages in central and northern Mexico, which may limit the region’s productivity of rain-fed agriculture (mostly wheat, corn, sorghum and other fodder crops).

Authorities at the three levels of government (federal, state and municipal) in many regions are calling for urgent concerted action to help farmers as well as to ensure supplies of drinking water to towns, cities and rural communities.

In Tamaulipas, at least 60 rural communities are confronting a critical water shortage. Farming representatives argue that while the National Water Commission (Conagua) has guaranteed water supply for urban areas, many rural areas remain vulnerable, and lack both potable water and food support on account of harvest failures due to lack of rain. In Tamaulipas alone, drought has affected 22,000 hectares and killed 800 head of livestock in the past year.

In Nuevo León, citrus farmers fear that their harvest, which begins in October will be 40-50% lower than usual. The state government is supporting a 35-million-dollar support program for farmers which includes supplying water by truck, rehabilitating deep wells and offering subsidies for water that farmers buy direct from private suppliers. The spring harvest in Nuevo León was lost completely, and a “severe drought emergency” has been declared in at least 14 municiapliites (Allende, Cadereyta, Dr. Arroyo, General Terán, Higueras, Juárez, Lampazos, Rayones, Sabinas Hidalgo, Santa Catarina, Villaldama, Hidalgo, García and Mina) allowing them access to federal aid.

Besides loss of livestock and crops, the prolonged drought in Mexico is having many other effects, which include:

Migration – In Durango state, more than 1500 Mennonites have left their homes due to the drought, according to Mennonite leader Enrique Peter Klassen, with some of the migrants headed for neighboring state of Chihuahua and others emigrating to Canada.

Wildfires – The first four months of 2013 was the third worst season for forest fires (more than 7000 were reported) in recent history, after 1996 and 2011. According to the National Forestry Commission (Conafor), wildfires ravaged 170,000 hectares, mostly grassland and wooded pastureland, in the first four months of this year. The states which suffered most were Oaxaca (21,000 ha), Baja California Sur (16,000), Guerrero (13,857) and Jalisco (13,697).

Lake Chapala – In the past two years, the level of Mexico’s largest natural lake, Lake Chapala, has once again fallen to crisis levels. (The lake has a long history of fluctuations in level, discussed in detail in our Geo-Mexico, the geography and dynamics of modern Mexico). The lake currently holds 2.84 million cubic meters of water, about 36% of its capacity. Its level has fallen 1.43 meters since last year’s rainy season, the lake’s most dramatic decline for 20 years. The rainy seasons in 2011 and 2012 raised the lake level by only 24 cm and 50 cm respectively, so unless this year’s rains are exceptionally heavy, the lake will continue to drop.

Previous posts related to drought:

Mexico’s geomorphosites: the Primavera Forest, Guadalajara, Jalisco

 Other  Comments Off on Mexico’s geomorphosites: the Primavera Forest, Guadalajara, Jalisco
Jun 012013
 

The Primavera Forest (aka Bosque de la Primavera, Sierra de la Primavera) is a volcanic region located immediately west of Mexico’s second-largest city, Guadalajara. The Primavera Forest occupies an ancient volcanic caldera, where the last eruptions are thought to have been about 30,000 years ago. The Primavera is a wilderness area of pine and oak woodland, with hot-water rivers, nature-trails and thermal spas. The park, which is about 30 km (19 mi) across (see map), serves as the lungs of Guadalajara and is popular, especially on weekends, for activities such as picnics, birdwatching, hiking, climbing, mountain biking and motocross.

The Primavera Forest. Credit: Semarnat, 2003

Basic map of the Primavera Forest. The distance between Tala and Guadalajara is about 35 km (22 miles). Credit: Semarnat, 2003

The main geographic and geological attractions of the Primavera Forest include:

Scenery, views, flora and fauna

The average elevation of the Primavera Forest is about 2200 m above sea level, rising to 2270 m (7447 ft) towards the eastern edge of the forest which overlooks the city of Guadalajara. The three main summits are El Pedernal, San Miguel and Las Planillas. There is easy access to the 30,000 ha of protected natural area from various points, including the town of Tala and from Highway 15 (the main Guadalajara-Tepic highway) which skirts the northern edge of the Primavera. Agriculture and settlement have made incursions into the edges of the park, with land cleared for subdivisions or for fields of sugarcane and agave (for tequila). A major wildfire raged through parts of the forest in 2012.

The park is home to about 1000 different plant species as well as 137 different birds and at least 106 terrestrial animals, including deer, puma, opossums (tlacuaches), armadillos and rabbits.

Hot springs

Thermal springs are common throughout the Volcanic Axis of Mexico, and the hot river and many hot springs in the Primavera Forest are a legacy of its volcanic history. Río Caliente, the main developed spa in the Primavera Forest, famous for several decades as one of the country’s top vegetarian and health spas, closed in 2011, following some years of uncertainty regarding its land tenure status and increasing security concerns because of its relatively remote location.

The hot springs in the park have been subject to numerous exploratory studies by the Federal Electricity Commission (CFE) which considers the park a potential source of geothermal power. The CFE drilled a dozen wells in the 1980s, finding that six of them offered sufficient flow for power production. The CFE believes the park could support at least three 25 megawatt geothermal plants. Drilling was suspended between 1989 and 1994 when the Jalisco state government ordered the CFE to carry out environmental restoration to areas damaged by drilling activities, and the plants have not yet been approved.

Pumice deposits

As veteran explorer-author John Pint points out in “A geopark in my back yard?”, the Primavera Forest is well known to geologists for its giant blocks of pumice, up to several meters across, which are among the largest found anywhere in the world. One of the best locations for seeing these is in the 50-meter-high walls of the Río Seco arroyo on the northern edge of the park, on the outskirts of the small community of Pinar de la Venta. The cliff face has a thick band of pumice overlying numerous thin layers of lake sediments. The pumice blocks are highly vesicular (full of holes) and therefore surprisingly light for their size.

Obsidian deposits

The Primavera Forest is also well known to geologists (and archaeologists) because it has significant amounts of obsidian, a hard, glassy, usually black rock. Obsidian is easy to find (often in big chunks) in several parts of the park. The obsidian formed when blocks of hot lava, still molten, rained into the cold waters of a lake, cooling instantaneously. When fractured, pieces of obsidian acquire very, very sharp edges. Even today, some surgeons still prefer obsidian scalpel blades, recognizing that they are far sharper than those made from even the best steel.

Obsidian was in great demand in precolonial times for use as mirrors, arrowheads and knives, as well as jewelry:

“Among the people to prize obsidian were the residents of Iztépete (often spelt Ixtépete), “hill of obsidian or knife blades”, located just outside the eastern edge of La Primavera. This small, largely forgotten, and poorly-signed archaeological site in a southern suburb of Guadalajara is within a stone’s throw of the city’s periférico (ring-road).”

“Large, angular chunks of obsidian litter the slopes of Cerro Colli, the hill rising behind the 6-meter-high pyramid, which conceals at least five earlier pyramids, each superimposed over the one before. Ceramics found here suggest that occupation stretches back at least to the fifth century, but little is known about the people who built this site.”  [Quotes are from the recently published 4th edition of the author’s “Western Mexico, A Traveler’s Treasury”]

Obsidian is found throughout this region, and while usually black in color, it can also be found in a range of hues, including red and even rainbow patterns. Not far from the western edge of Primavera, at the foot of a steep-sided knoll called El Picacho is El Pedernal, reputed to be the largest obsidian deposit in the world, covering 4 square kilometers, from which an astonishing 40,000 cubic meters of rock have been extracted over the centuries. Sophisticated chemical techniques have shown that El Pedernal obsidian was widely used in Mesoamerica, finding its way as far north as California and as far south as Oaxaca!

The pre-Columbian obsidian jewelry from this region, consisting of very thin wafers of rock, is unique to this area, and clearly the work of highly skilled specialist craftsmen. One particularly fine example (now in the museum in Tala) is a necklace fashioned out of wafer-thin obsidian carvings of human figures, each pierced by a tiny hole. In the absence of metal tools, the patience and dexterity required to have made these is truly amazing.

The art of obsidian carving has not been lost. Skilled artisans in Navajas, another nearby village, continue to this day to chip and shape chunks of obsidian into spheres, chess boards and beautiful works of art, often representing animals.

In future posts we will consider the formation of the La Primavera Forest in more detail, and also look at the extent to which the pressures resulting from its proximity to the city of Guadalajara threaten the park’s long-term health.

Want to read more?

John Pint is one of those spearheading the proposal of seeking UNESCO designation for La Primavera as a GeoPark.

U.S. Peace Corps Volunteer and geologist Barbara Dye has written a beautifully-illustrated  72-page guide (in Spanish) to the geology of the Primavera Forest: “La Apasionante Geología del Área de Protección de Flora y Fauna La Primavera”.

Related posts:

Mexico’s geomorphosites: El Sótano de las Golondrinas (Cave of the Swallows)

 Other  Comments Off on Mexico’s geomorphosites: El Sótano de las Golondrinas (Cave of the Swallows)
Apr 112013
 

El Sótano de las Golondrinas, in the municipality of Aquismón in the state of San Luis Potosí, is a massive limestone sinkhole (pit cave), one of the largest known in the world. In terms of depth, it is thought to be the second deepest sinkhole in Mexico and is probably in the world’s top 20.

The depth of sinkholes can be difficult to determine. For example, in the case of El Sótano de las Golondrinas, its surface opening is about 50 meters by 60 meters (160 by 200 ft) in size, but is on a slope. The depth on the high side is about 376 meters (1220 ft); the depth on the low side is about 330 meters (1090 ft).

sotano-de-las-golon

Below the surface (see profile) the sinkhole is roughly bottle-shaped. The floor of the sinkhole is about 300 x 135 meters (990 by 440 ft) in area. However, the sinkhole is believed to have formed from the collapse of the roof of an underground cave. As a result, the floor of the sinkhole is not solid rock but rubble that presumably came from the walls and former roof. A shaft on one side extends down at least another 100 m, suggesting that the true floor of the original cave lies at least that far beneath the current rubble-strewn floor.

US photographer Amy Hinkle shot some spectacular images earlier this year in this cave.  The accompanying article highlights the “secret garden” that “nestles 300 meters beneath the surface of the earth”.

The cave’s name (literally “basement of the swallows”) derives from the thousands of white-collared swifts that inhabit the overhanging walls of its interior. They spiral out of the cave every morning over a period of 25-30 minutes and return to their cave homes close to sunset. Large numbers of green parakeets also live in the cave.

The floor of the sinkhole is home to a rich plant life, as well as a diverse selection of  fungi, millipedes, insects, snakes, and scorpions.

The original cave is thought to have been formed by a lengthy period of water erosion along a major fault line in the lower Cretaceous limestone in the Sierra Huasteca (part of Mexico’s Eastern Sierra Madre). Over time, the cave became larger as a consequence of both the water erosion and due to mass movements (landslides, rockfalls) on its walls. Eventually, the size of the cave was so large that its walls could no longer support its roof which then collapsed into the cave, leaving the open air sinkhole seen today. Following heavy rain, short-lived waterfalls cascade down the sides of the sinkhole.

The first documented exploration of El Sótano de las Golondrinas was apparently in 1966. Since that time, the cave has become a popular destination for various adventure sports including rappelling, abseiling and base jumping (no longer allowed).

There are several other very deep sinkholes in the same general area, including Hoya de las Guasguas (with a 202 m deep entrance shaft) and Sótano del Barro (402 m in depth).

Some ornithological studies have found that the bird population of El Sótano de las Golondrinas is decreasing, perhaps due to the disturbance caused by the increasing number of human visitors. To limit disturbance, access and activities are more tightly controlled. For instance, descents into the cave are now strictly limited to daylight hours when the birds are absent, and a no-fly zone has been established around the cave, primarily to avoid helicopter disturbance.

El Sótano de las Golondrinas is yet another outstanding example of a geomorphosite in Mexico. Mexico has literally thousands of geomorphosites. Among those described in previous Geo-Mexico posts are:

References:

Related article:

Environmental news briefs relating to Mexico

 Mexico's geography in the Press  Comments Off on Environmental news briefs relating to Mexico
Apr 022013
 

This post describes several newsworthy developments relating to Mexico’s natural environment.

Financing to fight deforestation

The Inter-American Development Bank is giving Mexico $15 million in financial and technical assistance to support climate change mitigation efforts. The program will help communities and ejidos finance low carbon projects in forest landscapes in five states, all of which have high levels of net forest loss: Oaxaca, Yucatán, Quintana Roo, Jalisco and Campeche.

The program includes a $10 million loan for financing projects that must reconcile economic profit for the communities and generate environmental benefits through reducing the pressure on forests and promoting enhancement of carbon stocks. In addition, a $5 million grant will provide financial and technical assistance to support the viability of individual projects, by strengthening technical, financial and management skills.

The IDB says that the program is a pilot project that will allow lessons to be learned for its replication in other key geographic areas in Mexico. It should demonstrate a viable business model that promotes the reduction of deforestation and degradation while increasing economic returns. [based on an IDB press release]

Mexican company converts avocado seeds into biodegradable plastic

A Mexican company called Biofase has developed a way to turn avocado pits into 100% biodegradable plastic resins. Avocado pits are normally discarded as waste. Biofase will collect some of the estimated 30,000 metric tons of avocado pits discarded each month for processing. The company has patented the technology and is looking for additional raw material containing some of the same chemicals as avocados.

Huichol Indians oppose peyote conservation measure

A presidential decree signed last November prohibits the harvesting of the hallucinogenic peyote cactus from two protected areas in the state of San Luis Potosí. The decree has met fierce opposition from the indigenous Huichol (Wixarika) people, for whom the peyote is a sacred plant. The Huichol undertake a lengthy pilgrimage each year to gather peyote for subsequent use in their ceremonies.

The restriction on peyote harvesting is the latest in a long line of problems faced by the Huichol including the incursion by a large number of mining companies onto traditional territory. The Regional Council for the Defense of Wirikuta has demanded that the government guarantee the Huichol’s right to pick peyote, and called for the cancellation of 79 mining concessions (most of them to Canadian companies) that impinge on their sacred land. Critics claim that mining is having a devastating impact on the local environment, especially because the companies involved are using large quantities of highly toxic cyanide.

Expand the port or protect the coral reef?

In Avalan destruir arrecifes para ampliar puerto de Veracruz published in Mexico City daily La Jornada, Luz María Rivera describes how one of the final acts of the previous administration was to redraw the boundaries of the protected area of coral reef off the coast of Veracruz state. The new boundaries have reduced the protected offshore area near the cities of Veracruz, Boca del Río and Alvarado by about 1200 hectares (3000 acres). The redrawing of the protected area is to enable the expansion of the port of Veracruz, one of the country’s largest, and almost double its capacity. Government officials claimed that the area affected was already “damaged” and that the reef system was 98% or 99% “dead”.

Government-NGO accord to protect Mexican whale sanctuary

The Mexican government has signed an accord with the NGO Pronatura Noroeste to improve the protection of Laguna San Ignacio, the Pacific coastal lagoon which is a major breeding ground for gray whales. The lagoon has 400 kilometers (250 miles) of coastline, bounded by wetlands and mangroves, and is part of the El Vizcaino Biosphere Reserve in the northern part of the state of Baja California Sur. The accord calls for joint development of plans for protection, monitoring and tracking the whales and other species that inhabit the lagoon, as well as  establishing protocols for resolving any eventual environmental contingencies.

Related posts:


What is the elevation of Mexico’s cities?

 Other  Comments Off on What is the elevation of Mexico’s cities?
Feb 042013
 

The short answer to “What is the elevation of Mexico’s cities?” is “somewhere between zero and 3000 meters (8200 ft) above sea level!” Mexico’s extraordinarily varied relief provides settlement opportunities at a very wide range of elevations. Many Mexican cities are at or near sea level. This group includes not only coastal resort cities such as Acapulco, Cancún and Puerto Vallarta, but also Tijuana on the northern border and, at the opposite end of the country, Mérida, the inland capital of Yucatán state.

Mexico City, the nation’s capital, has an average elevation of about 2250 meters (7400 ft.), similar to that of nearby Puebla. Toluca, the capital city of the state of México, is almost 400 m higher, while both Huixquilucan and Zinacantepec (also in the state of México) are at an elevation of over 2700 meters. Moving northwards from Mexico City, numerous major cities are at elevations of between 1500 meters and 1850 meters above sea level. The cities nearer the lower end of this range include Saltillo, Oaxaca and Guadalajara, while Aguascalientes, Querétaro, Guanajuato, Morelia and León are all situated at elevations close to 1800 meters.

Frequency plot of city elevations in Mexico. Credit: Geo-Mexico

Frequency plot of city elevations in Mexico. Credit: Geo-Mexico

Are there more cities at some elevations than others? Each dot on the graph above represents one of Mexico’s 170 largest cities and towns, plotted against its average elevation. The two major clusters of cities occur at elevations of close to sea level and at 2250 meters, with another smaller, more spread out cluster between 1500 meters and 2000 meters. Perhaps somewhat surprisingly, there are relatively few Mexican cities at elevations of between 100 and 1500 meters (4920 ft.).

  • Q. Can you suggest any reasons for this? [Hint: Look at a relief map of Mexico to see how much land surface there actually is at different elevations].

The graph also shows the division of Mexico’s climate and vegetation zones by elevation first proposed by Alexander von Humbuldt following his visit to Mexico in 1803–1804. The terms tierra caliente, tierra templada, and tierra fría are still widely used by non-specialists today to describe the vertical differentiation of Mexico’s climatic and vegetation zones (see cross-section below).

Altitude zones

Altitude zones. Copyright John Wiley & Sons Inc. 2000.

The tierra caliente (hot land) includes all areas under about 900 m (3000 ft). These areas generally have a mean annual temperature above 25°C (77°F). Their natural vegetation is usually either tropical evergreen or tropical deciduous forest. Farms produce tropical crops such as sugar-cane, cacao and bananas. Tierra templada (temperate land) describes the area between 900 and 1800 m (3000 to 6000 ft) where mean annual temperatures are usually between about 18°C and 25°C (64°F to 77°F). The natural vegetation in these zones is temperate forest, such as oak and pine-oak forest. Farms grow crops such as corn (maize), beans, squash, wheat and coffee. Tierra fria (cold land) is over 1800 m (6000 ft) where mean annual temperatures are in the range 13°–18°C (55°–64°F). At these altitudes pine and pine-fir forests are common. Farm crops include barley and potatoes. On the highest mountain tops, above the tierra fría is tierra helada, frosty land.

Interestingly, the tierra templada appears to have fewer cities than might be expected. Equally, while archaeologists have sometimes argued for the advantages of siting settlements close to the transition zone between climates, where a variety of produce from very distinct climates might be traded, the graph shows no evidence for this.

It would be misleading to read too much into this superficial analysis of the elevations of Mexican settlements. First, we have only considered the 170 largest settlements. Second, an individual settlement may extend over a range of elevation, so using an average figure does not reveal the entire picture. Thirdly, the precise elevations for tierra caliente, templada and fria all depend on the latitude and other local factors. Even so, it might be interesting to extend this analysis at some future time to include far more settlements to see if the patterns identified are still present or if others emerge.

Related posts:

Decision about GM corn in Mexico postponed until 2013

 Mexico's geography in the Press  Comments Off on Decision about GM corn in Mexico postponed until 2013
Dec 012012
 

Mexico’s new president Enrique Peña Nieto took office earlier today. His single, six-year term will end in 2018. The change of government means that a final decision about the commercial planting of genetically modified (GM) corn in Mexico has been postponed until sometime early next year.

As we have seen in several previous posts, GM corn is a hotly disputed topic in Mexico.

Corn poster

“Without corn there is no nation” (Conference poster, Autonomous University of Chihuahua)

Proponents argue that GM corn will lead to higher yields and reduce losses from pests and diseases. In their view, the commercial planting of GM corn in Mexico is inevitable and will help Mexico “catch up” with Brazil and Argentina, where GM crops are already being grown.  Opponents argue that GM corn will inevitably reduce the genetic diversity of corn, meaning that corn will have less resilience in future to unexpected (and unpredicted) changes (climate, pests, soil conditions, etc). They also argue that GM corn will make corn growers even more dependent on commercial seed producers.

US farmers have found that GM corn lives up to its advertised higher yields and disease resistance. Farmers organizations in northern Mexico have come out in public support of this view, though many farmers in the center and south of the country remain vehemently opposed to GM corn on the basis that cross-contamination would deplete the plants’ gene pool, and possibly lead to the eventual extinction of traditional corn varieties.

Mexico was the world’s 6th largest grain producer in 2010, but fell to 8th spot in 2011. In just 20 years, Mexico has gone from a nation that needed to import less than 400,000 metric tons of corn a year in order to satisfy its domestic market to one where, in the 2012-12 season, it will need to import about 11,000,000 tons. Mexico’s corn imports, mainly of yellow corn for animal feed, are expected to rise to 15,000,000 tons by 2020. Corn prices are also likely to rise since an increasing portion of the annual US corn crop is  destined for biofuel production rather than human consumption.

Mexico currently produces about 22 million metric tons of corn (mainly white corn for human consumption) from 7.2 million hectares nationwide. According to press reports, there are five applications for planting GM corn on a commercial scale. The total area involved is 2.5 million hectares (6.2 million acres).

  • The transnational seed firm Monsanto has two proposals, each for 700,000 hectares, in Sinaloa, Mexico’s leading corn-producing state
  • Pioneer Hi-Bred International (currently owned by DuPont) has submitted three applications, each for around 350,000 hectares, in Tamaulipas
  • Dow Agrosciences (a unit of Dow Chemical) has applied to grow GM corn on 40,000 hectares, also in Tamaulipas.

It is widely believed that the new government will approve the large-scale trials of GM corn that the companies are requesting. It is likely, however, that GM corn will be confined to certain areas of Mexico only, with other areas designated “centers of origin” for corn where cultivation of GM seeds would not be permitted.

Among the most vocal opponents to the plans for GM corn is the ETC (Action Group on Erosion, Technology and Concentration) group. They set out their views in a multi-page news release. Verónica Villa, of ETC’s Mexico Office, says that,

“If Mexico’s government allows this crime of historic significance to happen, GMOs will soon be in the food of the entire Mexican population, and genetic contamination of Mexican peasant varieties will be inevitable. We are talking about damaging more than 7,000 years of indigenous and peasant work that created maize – one of the world’s three most widely eaten crops.”

Geo-Mexico will continue to report on this issue as it develops in coming months.

Want to learn more? This short open letter from the Unión de Científicos Comprometidos con la Sociedad (Union of Socially-Committed Scientists)  ~ Call to action vs the planting of GMO corn in open field situations in Mexico ~ has an extensive bibliography.

Related posts: