The Codex Mendoza, a key resource about Aztec times, can now be viewed online

 Books and resources  Comments Off on The Codex Mendoza, a key resource about Aztec times, can now be viewed online
Jan 192015
 

The Codex Mendoza, which we have referred to in several previous posts, can now be viewed via an amazing online interactive resource organized by INAH, Mexico’s National Institute of Anthropology and History, in association with Oxford’s Bodleian Library and King’s College, London.

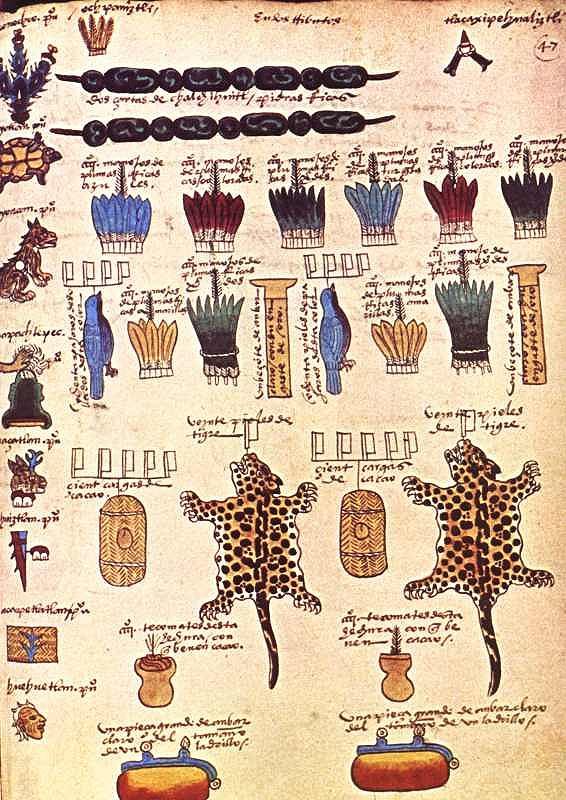
Compiled in 1542, and richly illustrated, the Codex Mendoza is one of the key primary sources from Aztec times. It was completed at the instigation of Spanish viceroy Antonio de Mendoza and provides exquisite details about Aztec history, the expansion of their “empire” and the territorial tributes that they received from every quarter of their dominions. The Codex also chronicles daily life and social dynamics.

Tribute page from the Codex Mendoza

Tribute page from the Codex Mendoza

The interactive online version has images of the entire document and allows viewers to mouse-over the original text for translations into English or modern Spanish. Clicking on individual images offers more detailed explanations and information.

The digital codex can be viewed online, or downloaded through Apple’s App Store as a 1.02-gigabyte app.

The original Codex Mendoza resides in the library of Oxford University.  (The ship carrying it from New Spain (Mexico) back to Spain in colonial times was attacked by French buccaneers. The booty was subsequently divided up, with the Codex eventually reaching the university library.)

The online Codex Mendoza is  a truly amazing resource. Hopefully, some of the other Mexican codices that currently reside in Europe, too also be “virtually repatriated” in the near future, making it much easier for Mexican scholars to consult them.

Related posts:

Video documentation of the Lacondon Indians in Chiapas

 Books and resources  Comments Off on Video documentation of the Lacondon Indians in Chiapas
Jan 162015
 

The Lacondon Maya are one of the most isolated and culturally conservative of Mexico’s numerous indigenous peoples. Their homeland is in the remote Lacondon Jungle in eastern Chiapas, close to the Guatemalan border. The Lacondon were the only Mayan people not conquered or converted by the Spanish during the colonial era. Until the mid-20th century they had little contact with the outside world, while maintaining a sustainable agricultural system and practising ancient Mayan customs and religion.

This short two-part video by Joel Kimmel (Part One above; Part Two below) briefly traces the history of the Lacandon back to the classic Mayan civilization. The videos document their successful, slash and burn, rotating, multicrop, subsistence agricultural lifestyle, steeped in religious ritual, and sustained over centuries in small isolated groups in the almost impenetrable Lacandon jungle.


The film then looks at the more recent outside influences that resulted in the near extinction of the Lacandon by the mid 20th century. Today their population has increased again and is estimated at between 650 and 1000, living in about a dozen villages. The second video focuses on the Lacondon’s confrontation with the modern world over the past four decades. One group, the “southern” Lacandon have opted for Christianity and the trappings of modern life, whilst some in the “northern” group, centered around the village of Naja, near the Mayan ruins of Palenque, attempt to maintain the old customs and religion. The video ends with the thoughts of a former Director of Development at Na Bolom, regarding the possibility, and immense difficulty, of trying to preserve what remains of their language, cultural heritage and ecological knowledge, treasures the world can ill afford to lose.

The videos introduce speakers and photos from the internationally famous Casa Na Bolom, in San Cristóbal de la Casas, Chiapas. This scientific and cultural research institute was founded in 1951 by Danish archeologist Franz Blom and his Swiss wife, Trudy Blom, journalist, photographer and later environmental activist. They devoted their lives to documenting the cultural history of the Lacondon people and life in the Chiapas jungle and advocating for the survival of both. Following Trudy Blom’s death in 1993, the Asociación Cultural Na Bolom has continued to operate the center as a museum, research and advocacy center, and tourist hotel. It houses an archive of over 50,000 photographs, and other documentation created by scholars over the decades.

The two videos provide visual proof of the forces of modern Mexico that have threatened the existence of the Lacondon way of life – government roads opening up the jungle to loggers and other settlers, logging permits resulting in massive clearcutting of the mahogany forests , the arrival of tourism, Coca-Cola and canned foods, mainstream education and modern technology like satellite television.

Not covered in the video is the fact that a Mexican presidential order in 1971 granted 614,000 acres to the Lacandon Community, recognizing their land rights over the, by then, more numerous settlers who had been allowed to colonize the Lacandon Forest under previous governments. This, however, has brought the Lacandon into conflict with many settler-groups, creating problems which continue to the present time. (See Chiapas Conflict on Wikipedia).

Related posts

The Huichol (Wixárika) People’s fight against multinational mining companies

 Books and resources  Comments Off on The Huichol (Wixárika) People’s fight against multinational mining companies
Nov 162014
 

A new feature-length documentary about the Huichol (Wixárika) People, an indigenous group who live in the mountains of western Mexico, has been released. Huicholes: the last peyote guardians is a must-see movie and is already winning praise and awards. Equally importantly, it is helping to raise funds and support for the Huichol as they fight to retain full control over their ancestral territory in the face of threats from federal authorities and multinational mining companies.

The IMDb movie database describes the movie as, “The urgent story of the mystical Wixarika People, the Huicholes: one of the last pre-Hispanic alive cultures in Latin America. Their struggle against the Mexican government and multinational mining corporations to preserve Wirikuta, their most sacred territory and home of the famous peyote cactus. The mining activities of the Canadian companies that got the concessions in 2010 to prospect this protected area, rich in silver, gold and other minerals, are seen by the Wixarika and their supporters as a great menace for the delicate biodiversity of this unique ecosystem, listed by the UNESCO as World Cultural and Natural Heritage. An unequal and controversial fight from today that triggers the global debate between ancient cultural values, the exploitation of nature and the inevitable development of the peoples.”

I have to agree with my long-time editor and colleague David McLaughlin that this documentary about the Huichol portrays “Canadian commercial imperialism at its worst.”

To learn more about the film:

Related posts:

How does Mexico’s water footprint compare to that of other countries?

 Books and resources  Comments Off on How does Mexico’s water footprint compare to that of other countries?
Oct 292014
 

In a previous post, we saw how Mexico is a major net importer of “virtual” water. In this post we take a closer look at Mexico’s water footprint. The data throughout this post come from The Water footprint of Mexico in the context of North America (pdf file).

Individual products each have their own water footprint in terms of the total amount of water involved in their production, processing and marketing. For example a single cup of coffee represents (on average) a water footprint of 140 liters. Other water footprints include:

  • A single letter-sized sheet of paper – 10 liters
  • Microchip – 32 liters
  • Pair of leather shoes – 8000 liters
  • Glass of milk 200 liters
  • Glass of wine 120 liters
  • Tomato 13 liters
  • Hamburger (150 gram) 2400 liters

From numbers like these, it is possible to calculate the water footprint for an individual consumer in a particular country, and also for an average consumer in each country.

How does the water footprint in Mexico compare to other countries?

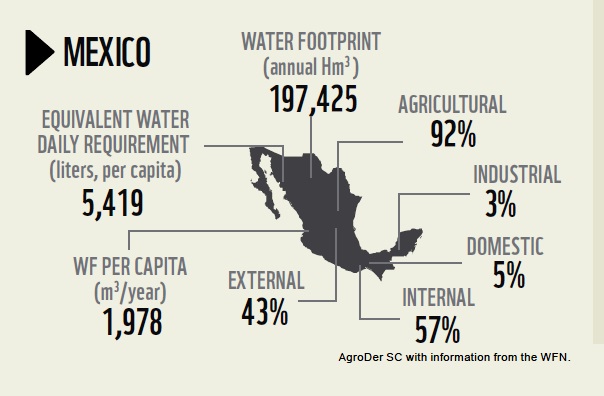
The water footprint of Mexico (WWF 2012)

The water footprint of Mexico (WWF 2012)

The graphic shows that Mexico’s total water footprint (all consumers) is 197,425 Hm³, of which 92% is agricultural, 3% industrial and 5% domestic. Only 57% of Mexico’s water footprint is internal, the remaining 43% is external (ie water used in other countries to make or produce items imported into Mexico). The average water footprint per person in Mexico comes to 5419 liters/day (or 1978 m³/year).

The global average water footprint (all countries, all consumers) in 2010 was 1,385 m³/y. However, some countries have much higher average water footprint/persons than others. For example, the average consumer in the USA has a water footprint of 2,842 m³/y, whereas in China and India the average water footprints are 1,071 and 1,089 m³/y respectively.

The water footprint of an average consumer worldwide  is primarily determined by their consumption of cereal products (contributes 27% to the average water footprint), followed by meat (22%) and milk products (7%).

It should be remembered that countries which heavily rely on foreign water resources may have significant impacts on water consumption and pollution elsewhere.

Full report:

Related posts:

Oct 232014
 

The online Atlas of Economic Complexity is now interactive, allowing users to choose and combine a large number of variables related to imports, exports, date and country. In the webpage’s own words, it is “a powerful interactive tool that enables users to visualize a country’s total trade, track how these dynamics change over time and explore growth opportunities for more than a hundred countries worldwide.”

What is economic complexity?

A country with a high Economic Complexity has a wide range of complex knowledge capabilities related to productive enterprises. Its economy is likely to produce sophisticated products that require a very wide and diverse set of knowledge capabilities. For example, relatively few countries have the capabilities to produce highly complex chemicals or pharmaceuticals, since their production requires very specialized equipment and very precise measuring instruments. Equally, very few countries have nuclear power stations or space stations, since they lack the range of knowledge capabilities needed to build them. At the other end, a very large number of countries have far less complex economies that are capable of producing simple products (basic foods, mineral ores, lumber, garments, shoes, glass, kitchen utensils, furniture) but not products involving more complicated processes or technology

We first discussed the Atlas in 2012 in How “complex” is the Mexican economy?, when we noted that the Atlas ranked Mexico’s Economic Complexity Index (ECI) as #20 of the 128 countries studied. The interactive nature of the online Atlas has added the opportunity to explore many more trends in trade, generating a range of related, visually-appealing infographics.

In particular, choosing Mexico as the country, the Atlas can answer questions such as:

  • What does Mexico import and export?
  • How has Mexico’s trade evolved over time?
  • What are the drivers of Mexico’s export growth?
  • Which new industries are likely to emerge in Mexico? Which are likely to disappear?
  • What are the GDP growth prospects of Mexico over the next 5-10 years, based on its productive capabilities?

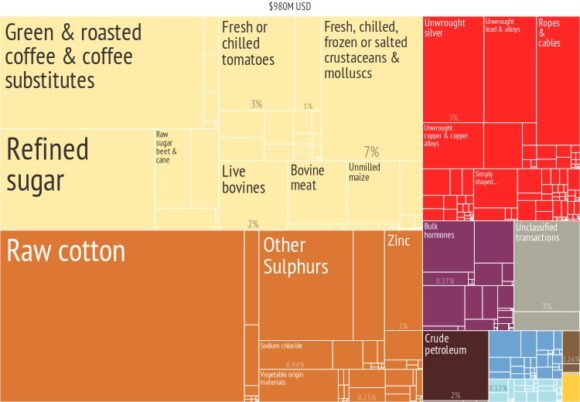
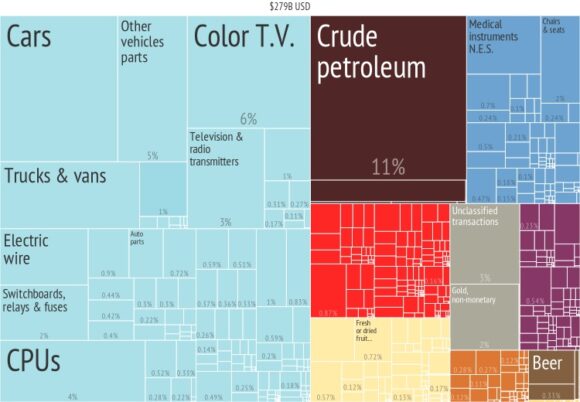
Playing with the variables and dates in the Atlas is a really interesting way to explore just how Mexico’s exports and imports have changed over the years. For example, compare these infographics for Mexico’s exports in 1964 and 2010 respectively:

What_did_Mexico_export_in_1964_

Mexico’s exports in 1964

Mexico's exports in 2010

Mexico’s exports in 2010

It is sometimes hard to imagine just how much Mexico has changed in the past fifty years! Overall, at rank #20, Mexico turns out to have an unusually high Economic Complexity Index given its income level. (All the other countries in the top 20 have significantly higher incomes than Mexico).

According to the Atlas, during the rest of this decade Mexico’s GDP should grow relatively rapidly, bringing its GDP rank more in line with its Economic Complexity Index. In general, analyses in the Atlas indicate that during the last few decades countries with higher than expected ECIs compared to their income levels experience more rapid economic growth.

Note, though, that while this relationship is empirically true, it does not explicitly include other factors thought to be important to economic growth such as governance and institutional quality, corruption, political stability, measures of human capital and competitiveness indicators.

Related posts

The Ghost Train (El Tren Fantasma): a case study of the geography of sound in Mexico

 Books and resources, Other  Comments Off on The Ghost Train (El Tren Fantasma): a case study of the geography of sound in Mexico
Oct 162014
 

Geography is not only about things that can be seen, touched and measured. Many branches of geography consider how people think, how communities make decisions and how nations interact.

At a local scale, one of the characteristics that is often overlooked is sound. We often ignore the soundscapes of places, either because we are “too busy” to listen and take in the local sounds, or because we are “too busy” tuning any distinctive local sounds out while using our cell phones or listening to favorite music.

Soundscapes vary greatly from rural areas to urban areas, and from one region to another; Mexico’s urban soundscapes are among the most distinctive on the planet.

In previous posts, we listened to The distinctive sounds of Mexico’s towns and cities; covered our ears as we analysed Noise pollution in Mexico; and also described the amazing Whistled language of the Chinantec people in Oaxaca.

In this post, we take a look at Chris Watson’s intriguing 2011 album “El Tren Fantasma”:

U.K.-based Chris Watson is a preeminent freelance recordist of wildlife and natural phenomena, whose work has been featured in many BBC programs including David Attenborough’s series, The Life Of Birds. As Watson has remarked, sound recording allows you to put a microphone where you can’t put your ears, to enable you to listen to sounds such as the groaning ice of a moving glacier. His work for the BBC was audio vérité but more recently, including in El Tren Fantasma, Watson has experimented with post production techniques to meld field recordings into a narrative.

The result is strangely compelling, dramatic and in some respects, awesome!

The soundscapes of El Tren Fantasma (the title is identical to that of a 1927 Mexican movie) offer a trip from the Pacific Coast to the Gulf Coast of Mexico condensed into little more than an hour.

The first six tracks cover the section of railway best known as the Copper Canyon line, one of the few remaining routes in Mexico with regular passenger service.

El Tren Fantasma has 10 tracks (pun intended):

  1. La Anunciante
  2. Los Mochis
  3. Sierra Tarahumara
  4. El Divisadero
  5. Crucero La Joya
  6. Chihuahua
  7. Aguascalientes
  8. Mexico D.F.
  9. El Tajin; El dia y La noche
  10. Veracruz

If you don’t have time to listen to all 10 tracks, the most interesting, from a geographical point of view, are probably the following:

The trip was nicknamed the ghost train by Watson because there are no longer any passenger trains connecting the two coasts. Several years ago, Watson was the sound recordist for a film crew making a program in the BBC TV series Great Railway Journeys. Even then, part of the line was freight only, but in earlier times, there had been regular scheduled passenger trains across the country.

The promotional material asks potential listeners to, “Take the ghost train from Los Mochis to Veracruz and travel cross country, coast to coast, Pacific to Atlantic. Ride the rhythm of the rails on board the Ferrocarriles Nacionales de México (FNM) and the music of a journey that has now passed into history.”

“In this album, the journey of the ‘ghost train’ is recreated, evoking memories of a recent past, capturing the atmosphere, rhythms and sounds of human life, wildlife and the journey itself along the tracks of one of Mexico’s greatest engineering projects.”

Reviews were almost universally positive.

Several reviewers recognized the connection between the soundscapes of El Tren Fantasma and geography, in some cases also attributing reasons for the decline of passenger train services in Mexico. For example Martin Hoyle, writing in The Financial Times, described how “From desert to rainforest, hummingbirds’ wings to the boom of heat rising from the Copper Canyon, it recalls a beloved passenger train system abandoned by privatisation.”

Pete Naughton in The Daily Telegraph wrote that the sound portrait painted by Watson “jostles with human, animal and mechanical life, filling the room with an atmosphere that is more richly evocative of Central America than any TV travel show I’ve seen. Diesel engines thrum, cicadas chirrup and passengers chatter, sing and argue.”

A reviewer in The Milk Factory (UK) drew attention to the “tremor of excitement as the sound of a diesel engine temporarily swallows the clunking noise of metal on metal and the strident hisses as wheels grind again rails and breaks against wheels”, before adding that, “Watson doesn’t aim to recreate the journey in any consistent chronology. Instead, he gives a taste of what this journey actually was by using nature and wildlife sounds to hint at the landscapes passed on the way.”

Spencer Grady, reviewing El Tren Fantasma for BBCi (UK), wrote that: “While Chris Watson’s previous sets – such as 2003’s critically acclaimed Weather Report – have generally concerned themselves with this planet’s myriad beasts and habitats, this narrative inevitably bears an anthropological mark. Indeed, the first voice we hear doesn’t belong to a cuckoo or coyote, but station announcer Ana Gonzalez Bello putting out one “last call for the ghost train”. It’s an unusually contrived opening gambit, from which point the listener is jettisoned into a collision of screeching breaks, rolling stock rattle and hot hydraulic huff. Over half of El Tren Fantasma’s tracks (pun definitely intended) are given over to locomotive sound – gears shifting, hoots, bells and whistles – climaxing with El Divisadero, where Watson manipulates the monolithic machinations into a surging, phantasmal bellow, like a choir of angels struggling to be heard over the rumbling thrum of running gear.”

For an academic geographer’s perspective on El Tren Fantasma, a good place to start (for those with academic library access) is a recent issue of Transactions of the Institute of British Geographers (Vol 39, No 3, 2014). In “El tren fantasma : arcs of sound and the acoustic spaces of landscapes”, George Revill, of the Open University, draws on Chris Watson’s soundwork “El tren fantasma” to consider “how sound participates in the production of the railway corridor as a complex, animate and deeply contoured historically and geographically specific experience of landscape.”

El Tren Fantasma offers an extraordinarily evocative sound summary of a trip across Mexico; what a shame that there are now so few passenger services left on Mexican railways!

Related posts:

Mexico is a major net importer of “virtual” water

 Books and resources, Teaching ideas  Comments Off on Mexico is a major net importer of “virtual” water
Oct 132014
 

The concept of “virtual water” was developed by Professor J.A. Allan of King’s College (London University) and the School of Oriental and African Studies. Allan used it to support his argument that Middle Eastern countries could save their scarce water resources by relying more on food imports. The idea was sufficiently novel for Allan to be awarded the 2008 Stockholm Water Prize.

In Allan’s words, “The water is said to be virtual because once the wheat is grown, the real water used to grow it is no longer actually contained in the wheat. The concept of virtual water helps us realize how much water is needed to produce different goods and services. In semi-arid and arid areas, knowing the virtual water value of a good or service can be useful towards determining how best to use the scarce water available.”

As one example, producing a single kilogram of wheat requires (on average) around 1.5 cubic meters of water, with the precise volume depending on climatic conditions and farming techniques. The amount of water required to grow or make a product is known as the “water footprint” of the product.

Hoekstra and Chapagain have defined the virtual-water content of a product, commodity, good or service, as “the volume of freshwater used to produce the product, measured at the place where the product was actually produced”. The virtual water content is the sum of the water used in the various steps of the production chain.

Additional examples, showing the water footprint of producing one kilogram of:

  • biodiesel from soya –  11.4 cubic meters
  • beef –  15.4 cubic meters
  • butter –  5.5 cubic meters
  • chocolate – 17.0 cubic meters
  • pasta –  1.85 cubic meters
  • sugar (from cane) –  0.2 cubic meters

While the idea of virtual water has attracted some attention, its methodology is contested, and its quantification is not yet sufficiently precise to offer much potential for policy decisions.

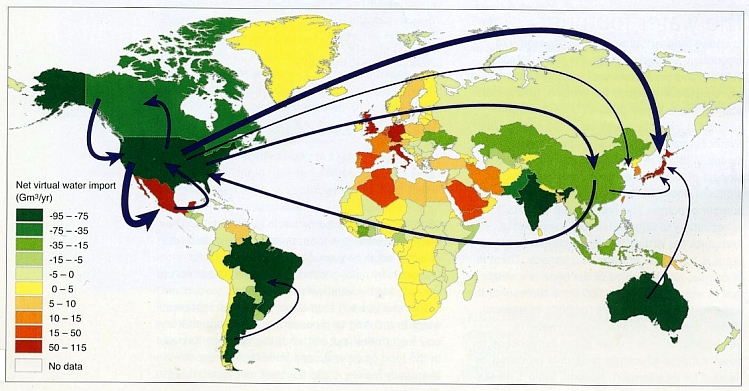
Imports and exports of virtual water represent the “hidden” flows of water involved when food and other commodities are traded from one place to another. The map below (from Hoekstra and Mekonnen, 2012) shows the net imports (imports minus exports) of virtual water for different countries for the decade 1996-2005. Note that only the major flows are shown.

water-virtual-tradeIn North America, both the USA and Canada have a significant positive virtual water balance (i.e. they are major exporters of virtual water), whereas Mexico has a significant negative water balance, and is clearly one of the world’s largest importers of virtual water.

As Allan’s original work suggests, this is not necessarily bad news since it may imply that Mexico is currently using less of its own (limited) water resources than it might otherwise have to. In other words, Mexico’s virtual water imports may be delaying the inevitable crunch time when water usage becomes a critical limiting factor in the nation’s development.

Source of map

A.Y. Hoekstra and M.M. Mekonnen. 2012. The water footprint of humanity. Proc. Nat. Academy of Sciences, 109, 3232-7. Map was reproduced in “Spotlight on virtual water” by Stuart N. Lane in Geography, vol 99-1, Spring 2014, 51-3.

Related posts:

Mexico hosts 2014 World Tourism Day

 Books and resources, Mexico's geography in the Press  Comments Off on Mexico hosts 2014 World Tourism Day
Sep 272014
 

Today Mexico is hosting World Tourism Day, so this seems like a good time to review the state of Mexico’s tourism sector. The official celebrations are being held in the city of Guadalajara.

The decision by The World Tourism Organization that Mexico should host the 2014 World Tourism Day recognizes Mexico’s importance in world tourism. Mexico is the 13th most popular international destination in the world. In 2013, it welcomed 23.7 million international tourists, who spent 13.8 billion dollars in the country. World Tourism Day 2014 highlights tourism’s social, cultural, political and economic benefits, and its importance in community development.

Earlier this year, Mexico’s Tourism Secretariat published a detailed analysis of the Tourism Industry in Mexico in 2013.

The text of the magazine format publication (link above) is in Spanish, but it includes lots of graphs and maps showing tourism’s trends and patterns. The 21 pages of information cover topics from the origin and spending of tourists to cruise ship ports, hotel occupancy, and number of international flights. The publication offers a wide variety of data and an ideal basis for students who want to design and produce infographics about tourism.

And how is tourism doing in 2014?

So far, all the signs are positive. The number of international visitors for the first half of the year was up 19.6% to 14.2 million, compared to the 11.9 million recorded for the first six months of 2013. Spending in the first half of the year was up 17.6% to 8.435 billion dollars.

Related posts:

Post and Fly Videos of Mexico

 Books and resources  Comments Off on Post and Fly Videos of Mexico
Sep 252014
 

A series of videos made by “Post and Fly Videos” provides an outstanding visual introduction to many of Mexico’s most photogenic sights. Some of the photography is truly stunning.

For a fun introduction, try this 4 minute video (turn your speakers on) which gives a quick tour of many parts of Mexico. (As yet, there are very few Post and Fly Videos of the Yucatan Peninsula, but I’m confident they will remedy this omission before too long!)

A list of the places shown in this 4 minute video is given below (with a few links to relevant Geo-Mexico posts), for those who like to know precisely where particular shots were taken.

Places in the video (in order of appearance):

Marina San José del Cabo, Baja California Sur
El Sidral, San Luis Potosí
Macroplaza Monterrey, Nuevo León
Las Pozas de Xilitla, San Luis Potosí
Tamtoc, San Luis Potosí
Las Estacas, Morelos
Peña del Aire, Hidalgo
El Naranjo, San Luis Potosí
Xochimilco, D.F.
Tamul, San Luis Potosí
Los Cabos, Baja California Sur
Ex Hacienda de Chautla, Puebla
Gran Cenote, Quintana Roo
El Salto, San Luis Potosí
Valle de Bravo, Estado de México
Los Cabos, Baja California Sur
Ex Hacienda de Santa María Regla, Hidalgo
Peña de Bernal, Querétaro
Acopilco, D.F.
Atlixco, Puebla
Kiosco Morisco, D.F.
López Mateos . Baja California Sur
Huasca, Hidalgo
Mantetzulel, San Luis Potosí
Metepec, Estado de México
Todos Santos, Baja California Sur
Tula, Hidalgo
Todos Santos, Baja California
Castillo de la Salud, San Luis Potosí
Holbox, Quintana Roo
Punta Allen, Quintana Roo
Muyil, Quintana Roo
Tepotzotlán, Estado de México
Parque Fundidora, Nuevo León
Santa Fe, D.F.
Balandra, Baja California Sur
Arcos del Sitio, Estado de México
Loreto, Baja California Sur
Tulum, Quintana Roo
Loreto, Baja California Sur
Tulum, Quintana Roo
Xochimilco, D.F.
Todos Santos, Baja California
Aktun Chen, Quintana Roo
Prismas Basálticos, Hidalgo
Marina San José del Cabo, Baja California Sur
Peña del Aire, Hidalgo
López Mateos . Baja California Sur

To see more Post and Fly Videos, explore their website, especially their “Explorando México” section.

How can tourism perception be assessed? A case study using the Lerma-Chapala drainage basin

 Books and resources, Teaching ideas  Comments Off on How can tourism perception be assessed? A case study using the Lerma-Chapala drainage basin
Aug 282014
 

In numerous previous posts, we have looked at the importance of tourism in Mexico, and have examined its impacts at different scales, from the national/international scale at one extreme to the single resort scale at the other:

National scale:

Sub-national regional scale:

Single resort scale

We have also considered the way in which the characteristics of tourism in a resort change over time:

Attempting to quantify the importance or impacts of tourism, beneficial or otherwise, is fraught with methodological difficulties. The number of hotel rooms in different cities is often used as a proxy measure of the relative importance of tourism in different communities, but looking only at tourist capacity “masks  the fact that hotels are rarely full. In 2007, the national occupancy rate was 54.8%. Traditional beach resorts such as Acapulco, Mazatlán and Puerto Vallarta had an occupancy rate of 52.2%, compared to 68.1% for modern, planned mega-resorts like Cancún and Los Cabos. The occupancy rate in the large cities—Guadalajara, Mexico City and Monterrey—was 55.0%, well ahead of the 47.2% for other interior cities.” (Geo-Mexico, p 134).

As in other branches of geography, it is not only the “reality” that matters, but also people’s perceptions of reality. Most decisions concerning location (such as where to live, the best place to start a new business. etc) are taken on imperfect or incomplete information; in other words, these decisions are based, at least to some extent, on perceptions.

In the case of tourism, it is the perception of visitors that matters. This is precisely why certain resorts gain a reputation as being “jet set” or the “in place” to vacation. The “in place” today is not going to be the “in place” in a few year’s time, since perceptions (and reality) change. Nowhere has this proved to be more true in Mexico than in the case of Acapulco.

But is it possible to measure tourist perceptions? It is very difficult to do so directly, but there are ways of tackling this question, and here we look at one approach, based on an analysis of tourist-oriented literature.

The approach is easiest to explain in the context of a real example, in this case an analysis of the likely perception of foreign tourists of destinations in the Lerma-Chapala drainage basin in Mexico. (This study formed part of my contribution on tourism to the Atlas de la cuenca Lerma-Chapala, construyendo una visión conjunta, Semarnat-Unam-IE, 2006 – the link is to a low-resolution pdf of the entire atlas).

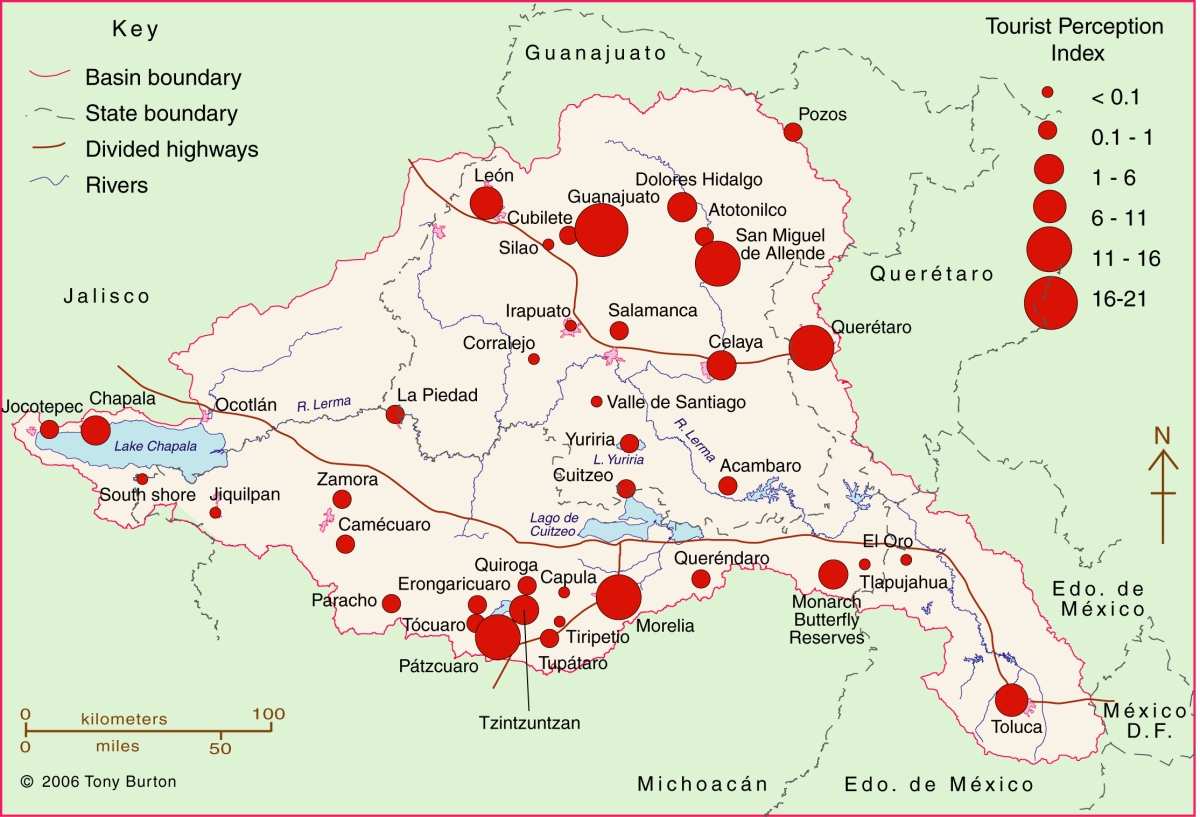
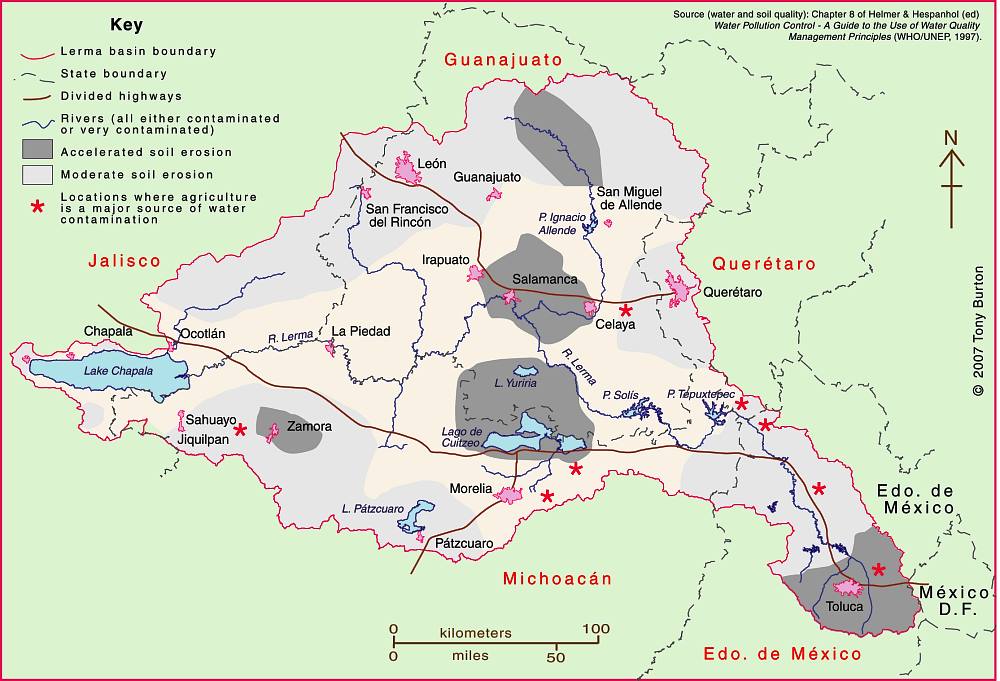
The Lerma-Chapala Basin (see map) is one of Mexico’s major river systems, comprising portions of 127 municipalities in five states: México, Querétaro, Michoacán, Guanajuato and Jalisco. The basin has considerable economic importance. It occupies only 2.9% of Mexico’s total landmass, but is home to 9.3% of Mexico’s total population, and its economic activities account for 11.5% of national GDP. It also has considerable importance for tourism.

Lerma Basin Tourist Perception Index.

Lerma Basin Tourist Perception Index. Cartography: Tony Burton / Geo-Mexico; all rights reserved Click to enlarge.

The red circles superimposed on the map represent an index of tourism perception. This index is based on an analysis of seven tourist guides that purport to cover the entire country:

  • AAA Tourbook (2004)
  • Let’s Go Mexico (2004)
  • Lonely Planet (2002)
  • Footprint Guide (1999)
  • Upclose Mexico (1998)
  • Insight Guide (1994)
  • Cadogan Guide (1991)

In each case, the total number of lines of text in the guide devoted to any location within the Lerma-Chapala drainage basin was counted, as well as the number of lines devoted to each individual location. This allowed a ratio or percentage to be worked out for each place for each book. For example, if a book had 240 lines in total devoted to the drainage basin, of which 60 were devoted to San Miguel de Allende, the perception index for San Miguel for that book would be 60/240 * 100 = 25%. Similar calculations were performed for all the locations mentioned, for each book, and then the mean index was calculated for each location. These mean indices were the basis for the size of the circles on the map.

In broad terms, the map shows which places are likely to be on a foreign traveler’s radar when they are visiting the area. Those familiar with this area may be surprised to see that the ghost town of Pozos merits as many lines of text as Quiroga (and indeed more lines of text than Atotonilco). Another surprise is that Tzintzuntzan appears to be as much in the tourist eye as Chapala, Dolores Hidalgo or Toluca. The main purpose of this post is not to analyse such apparent anomalies but only to suggest a relatively easy way of analysing tourist perceptions through the use of tourist-oriented literature. Applying the same method to the entire country, on a state-by-state basis, throws up far more interesting anomalies which we plan to share at some point in the future.

Related posts:

Related posts:

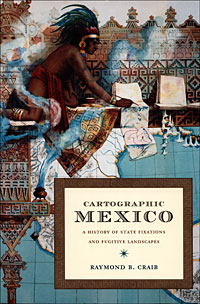
Raymond Craib’s “Cartographic Mexico, a history of state fixations and fugitive landscapes”

 Books and resources  Comments Off on Raymond Craib’s “Cartographic Mexico, a history of state fixations and fugitive landscapes”
Jul 192014
 

This book by Raymond Craib (Duke University Press, 2004) is one-of-a-kind. Craib combines archival analysis of mainly 19th century documents with perceptive comments on the relationships between history and geography in Mexico from the mid-19th century until about 1930.

craib-coverIn “Cartographic Mexico, a history of state fixations and fugitive landscapes”, Craib emphasizes the significance of map-making in post-Independence Mexico as a means towards furthering nationalism and as a development tool. He traces the changing motives of map-makers, focusing especially on the key area of Veracruz-Puebla which served as Mexico’s main gateway to Europe for centuries.

Craib considers why certain place names acquired more prominence than others, and examines a case study of a mining area where the granting of water rights hinged on precisely where a particular river flowed, and which tributary had which name, a case where cartographic ‘proof’ proved to be impossible and where a pragmatic solution was required.

This is an important study, with meticulous footnotes and bibliography.

“Cartographic Mexico, a history of state fixations and fugitive landscapes” is available via amazon.com

(Note: This short review was first posted on sombrerobooks.com)

Other books reviewed on Geo-Mexico.com:

New York Public LIbrary online historical maps of Mexico

 Books and resources, Maps, Mexico's geography in the Press  Comments Off on New York Public LIbrary online historical maps of Mexico
Jul 022014
 

A few months back, the New York Public Library (NYPL) announced that it was placing high resolution scans of more than 20,000 cartographic works online. The NYPL also asserted that it believed that “these maps have no known US copyright restrictions” and that it “is distributing these images under a Creative Commons CC0 1.0 Universal Public Domain Dedication.”

The maps can be viewed and downloaded via the New York Public Library’s Digital Collections page, and the NYPL Map Warper.

Naturally, this piqued Geo-Mexico’s interest, and we spent several enjoyable hours browsing the various maps included in this online treasure-trove that have some relation to Mexico. A search for “Mexico” yielded 36 maps, though this number included many that depict New Mexico.

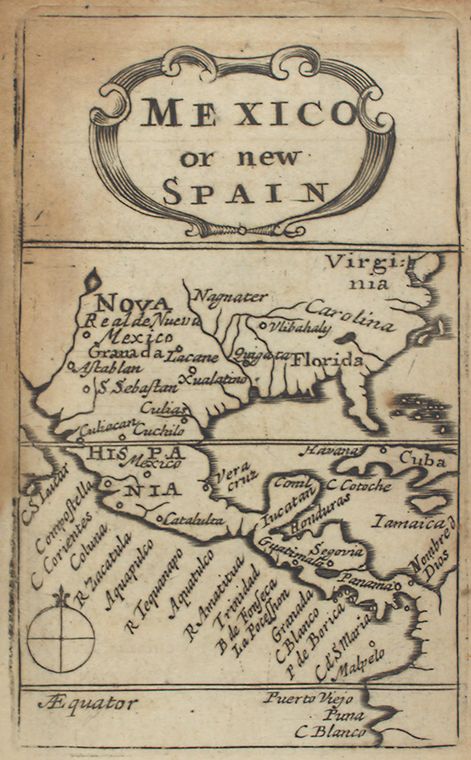
seller

This 1679 map “Mexico, or, New Spain” (above) comes from “Atlas minimus, or, A book of geography : shewing all the empires, monarchies, kingdomes, regions, dominions, principalities and countries, in the whole world”, by John Seller.

Far more detailed, and a more recognizable shape emerged by 1713, with the publication of Mexico, or, New Spain : divided into the audiance of Guadalayara, Mexico, and Guatimala, Florida, from “System of geography with new maps”.

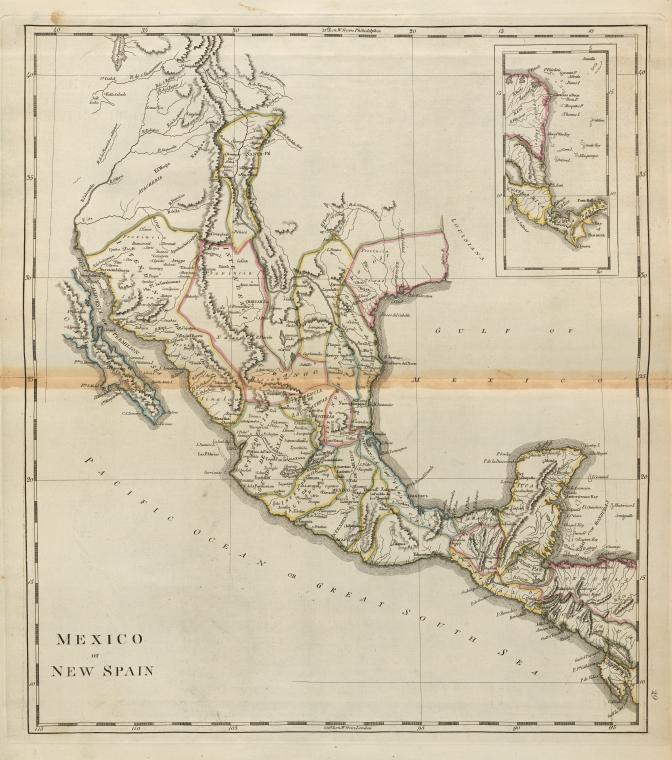
Carey's 1814 map.

Carey’s 1814 map.

This 1814 map “Mexico of New Spain” (above) is part of “Carey’s general atlas, improved and enlarged : being a collection of maps of the world and quarters, their principal empires, kingdoms, &c.”

From the mid-nineteenth century, the maps become very much like modern-day atlas maps. For example, this 1876 map, “Mexico; Mexico to Vera-Cruz; The Isthmus of Tehuantepecfrom the “New illustrated atlas of Dutchess County, New York. / Compiled & drawn from personal examinations, surveys etc. under the personal supervision of O.W. Gray & Son and F.A. Davis, and published under the superintendence of H. L. Kochersperger”.

Related posts:

Monitoring air pollution in Guadalajara

 Books and resources, Teaching ideas  Comments Off on Monitoring air pollution in Guadalajara
Jun 162014
 

Air pollution in the city of Guadalajara, the state capital of Jalisco, has worsened over the past decade, though there are some recent signs of improvement :

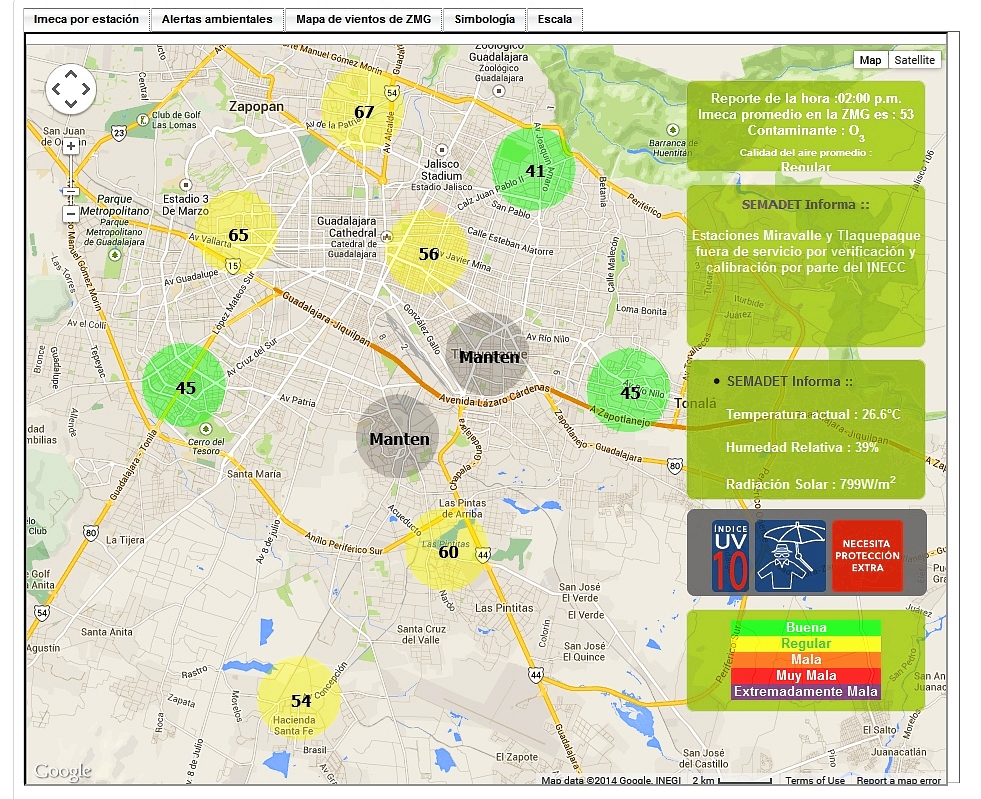
The Jalisco Environmental Agency now has a webpage where residents and travelers alike can now monitor Guadalajara’s air quality on an hourly basis. Readings for 10 stations are superimposed on a basemap on that page, together with links to graphs showing recent trends and other meteorological data. Tabs above the map also give a link to the current wind conditions across the city. Historical data (in Spanish) can also be accessed via the link to “Datos”.

Screenshot of Guadalajara air monitoring webpage

Screenshot of Guadalajara air monitoring webpage. Note: Two stations are shown as undergoing maintenance.

The map provides summary data in IMECAs, which stands for Índice Metropolitano de la Calidad del Aire (Metropolitan Index of Air Quality). IMECAs are a compound index combining measurements of concentrations of ozone (O3), sulphur dioxide (SO2), nitrogen dioxide (NO2), carbon monoxide (CO) and particles smaller than 10 micrometers (PM10).

In Guadalajara, formal smog alerts are issued if average readings rise above 150 IMECAs (“Very Bad”) for more than two consecutive hours. If readings rise above 200 IMECAs (“Extremely Bad”), then “serious alerts” impose restrictions on vehicle use and may lead to the suspension of school classes.

In Guadalajara, the worst air quality tends to be in the southern and eastern sections of the city. It also tends to occur in the months of April and May, immediately before the rainy season gets underway. The webpage system gives everyone an easy way to check these assertions!

In Guadalajara, mitigation efforts are centered mainly on reducing vehicle emissions (partly by stricter emissions testing and verification, and partly by improvements to the public transport network) since they are the main source of pollution. To date, there are no plans in Guadalajara to introduce a “Day without car” program similar to that in Mexico City:

Teaching idea

Use the Jalisco Environment Agency webpage to monitor Guadalajara’s air pollution and identify any patterns or trends related to air pollution in the city. Consider suggesting one or more hypotheses, such as “Air pollution gets worse in the afternoon”, or “The level of air pollution in eastern Guadalajara is worse than in western Guadalajara”, before testing your ideas using the online data.

Related posts:

The regional geography of tacos

 Books and resources  Comments Off on The regional geography of tacos
Jun 072014
 

A taco is a corn or wheat tortilla folded or rolled around other edible ingredients, and designed to be eaten by hand – the indigenous Mexican equivalent of a sandwich. Tacos are extremely versatile and often accompanied by garnishes such as tomatoes, onions, lettuce, radishes, and avocado or guacamole, topped with salsa and cilantro.

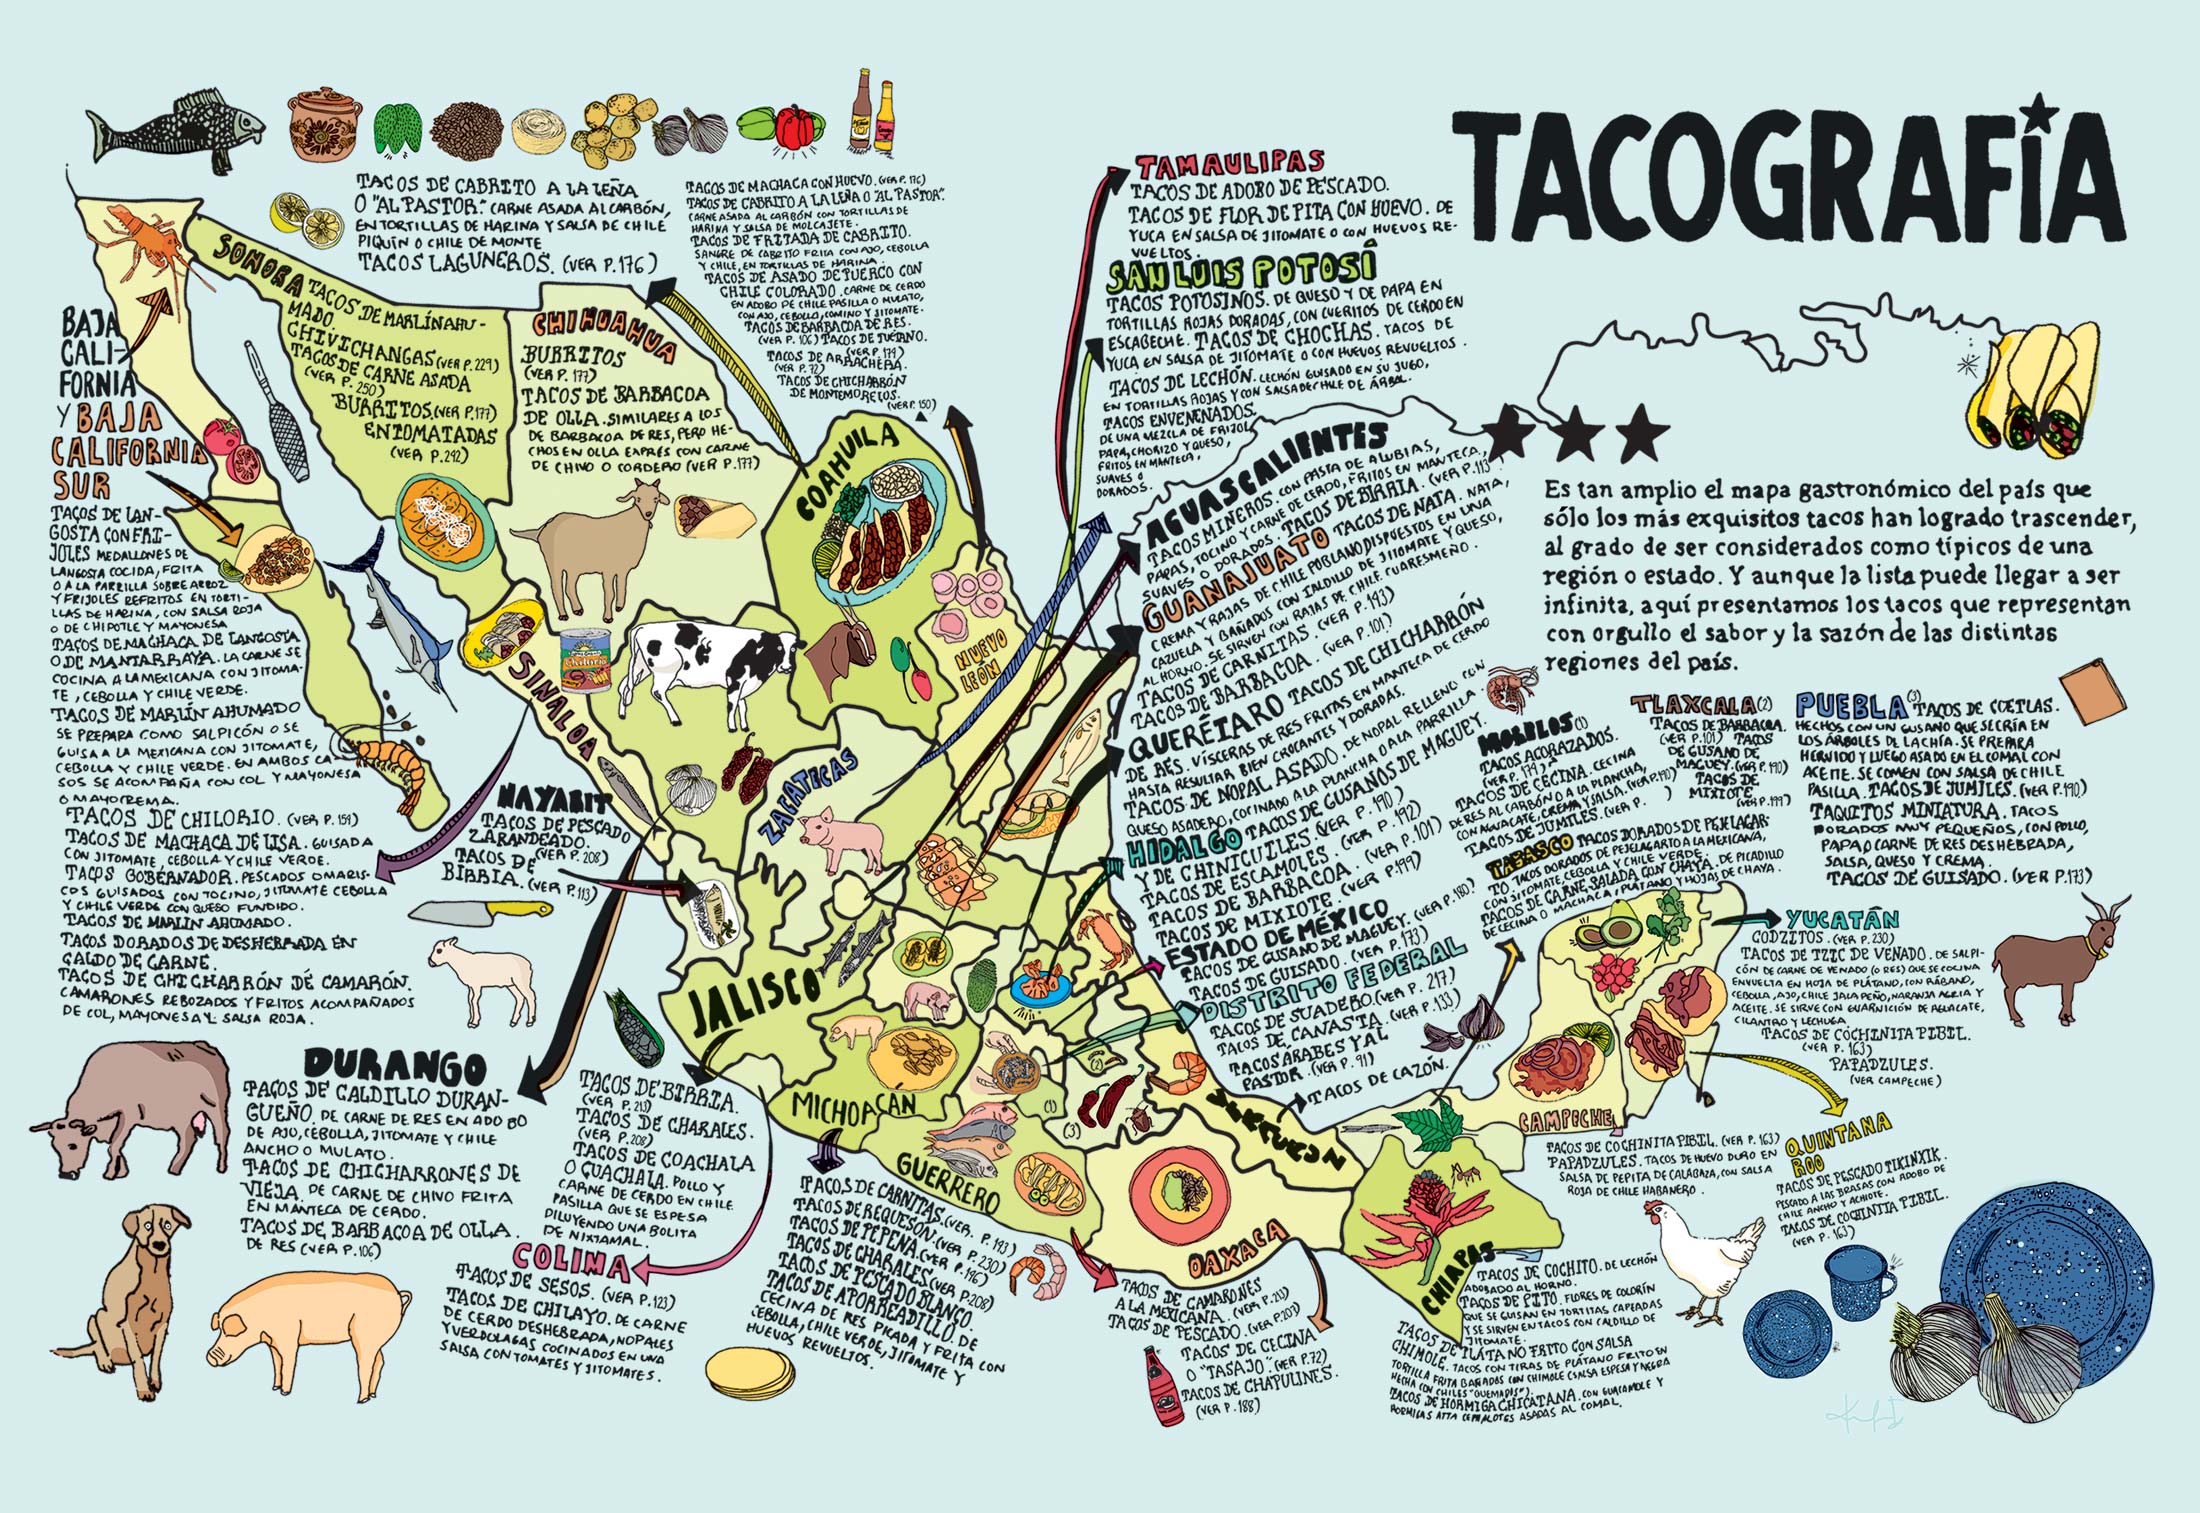
Who would have thought that the humble taco was worth its own encyclopaedia? This particular encyclopaedia includes a fascinating graphic – a map (see graphic) summarizing the different regional varieties of taco commonly found in different parts of the country.

The accompanying terminology used to describe all these tacos is mind-blowing, but a small sampling will give you the idea:

Regional varieties of Mexican tacos

Regional varieties of Mexican tacos. Credit: La tacopedia. Enciclopedia del taco (Spanish Edition) . Click to enlarge.

The map is by no means an exhaustive list, but does include examples of taco specialties for every state.

The two states occupying the Baja California Peninsula both have seafood-based tacos:

  • Baja California – tacos de langosta con frijoles (lobster and beans tacos)
  • Baja California Sur – tacos de marlin ahumado (smoked marlin tacos)

The tacos popular in some states reveal less about their ingredients:

  • Aguascalientes – tacos mineros (miner’s tacos)
  • Coahuila – tacos laguneros (Laguna region tacos)
  • Morelos – tacos acorazados (battleship tacos)
  • Puebla – taquitos miniatura (miniature tacos)

For some unusual ingredients, try:

  • Chiapas – tacos de hormiga chicatana (flying ant tacos)
  • Colima – tacos de sesos (brain tacos)
  • Hidalgo – tacos de gusanos de maguey (maguey worm tacos)
  • Yucatán – tacos de tzic de venado (shredded venison tacos)

Feeling daring? Try the tacos envenenados in Zacatecas. The literal meaning is “poisoned tacos”, but they are apparently named so as not to reveal all their ingredients!

Tacos have become incredibly popular. While they predate the Spanish conquest, they are now well on their way to conquering large swathes of North America and Europe.

The regional patterns is analyzed further by Frank Jacobs in 604 – A Tacography of Mexico

For more about tacos, we recommend reading La tacopedia. Enciclopedia del taco by Deborah Holtz and Juan Carlos Mena (Trilce Ediciones, 2012).

Related posts:

Jun 022014
 

This engaging book analyses the historical geography of the port of San Blas, on Mexico’s west coast, and its hinterland which includes the small city of Tepic, the state capital of Nayarit. This area held immense importance during colonial times, was one of the main gateways for trade and influence peddling during the nineteenth century, before lapsing into relative obscurity at the end of the that century, and into the twentieth century. The tourism industry has sparked a mini-revival but none of the many grandiose plans for this coast have even been brought fully to fruition.

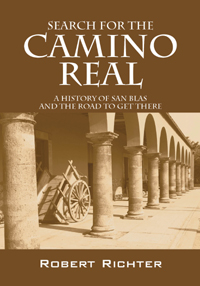
richter-coverThe Camino Real in Richter’s title is actually a branch from the Camino Real de Tierra Adentro (The Inland Royal Road, the spine of the colonial road system in New Spain). During colonial times, this linked the inland city of Guadalajara to Tepic and thence San Blas, though the modern highways uniting these places no longer follow the same route.

Robert Richter has known this area personally for decades, and his intimate knowledge of the local geography shines through. The book combines his own personal experiences with intensive historical research, both in the library and on the ground. Richter’s objective is to pin down the precise route of the Camino Real, and then find every remaining vestige of it that he can on the ground.

In reading the story of San Blas and the Camino Real, readers are treated to a dazzling array of insights into what made this area tick for so long before subsiding into something of a backwater. This branch of the Camino Real, from Guadalajara to San Blas, played a key role in the history of Western Mexico, and saw everything from pirates and adventurers to soldiers, priests and smugglers.

As Richter points out, “The Matanchen Bay-San Blas region grew in geographic and strategic importance to become the most important Pacific seaport between Guayaquil, Ecuador, and San Francisco, California, in the 1830s, a major international way station for both legal and contraband trade between an ungovernable Mexico and the rest of the world.”

This growth continued and, “In the 1850s, the cultural, economic, and political events roiling all along the Camino Real from San Blas to Guadalajara, especially in the mild sierra valley surrounding the city of Tepic, spawned a new regional identity, and eventually, a new political entity—the Mexican state of Nayarit.”

Richter tells his story with passion and it is impossible not to be drawn into the narrative and share his excitement as he sets out to find “missing” sections of the Camino Real, accompanied by a motley crew of secondary characters. To what extend does he succeed? Sorry, no spoilers here!

Inevitably, the past merges with the present and the future. What began as a seemingly straightforward historical geography becomes at turns a travelogue, journal of fieldwork and short essay about the sustainability of economic development along this coast. Richter is clearly not against change, but argues strongly that local tourist development in the future must take account and respect the region’s ecology, its history and its culture.

As the back cover blurb aptly states, “To explore Nayarit’s wild and gorgeous geography, trying to site the ancient Camino Real, is to stumble over another road running toward the state’s future economic development as part of the Mexican Riviera.”

This book should be of interest to geographers everywhere. It serves to prove that historical geography need not be dull and stuffy but can be made relevant, exciting and even entertaining, at the same time as it offers us valuable insights into possible futures.

One minor plea: please add an index when the second edition of this book is prepared!

Search for the Camino Real, a history of San Bad and the road to get there” is one of several books by Richter centered on the fading coastal village culture of Nayarit and the Mexican Riviera. His adventure novel, “Something like a Dream” (Oak Tree Press, 2014) is an especially entertaining read, with a lively plot and well-described settings ranging from the tourist resort of Puerto Vallarta to Nayarit fishing villages and tiny Huichol Indian settlements high in the Western Sierra Madre.

Map of the beaches of Colima, Jalisco and Nayarit, Mexico shows the location of all the key places mentioned in Richter’s books.

Related posts:

The diary of a food activist’s visits to Mexico

 Books and resources  Comments Off on The diary of a food activist’s visits to Mexico
Apr 142014
 

Food activist Jill Richardson, author of Recipe for America: Why Our Food System is Broken and What We Can Do to Fix It, has a blog called Jill Over the Ground (formerly La Vida Locavore – Locavores being people interested in eating food that is locally produced, and has not traveled long distances.)

Richardson, who serves on the policy advisory board of the Organic Consumers Association, visited Mexico twice in 2010 and has published an interesting online diary of her trips. Richardson visited the two contrasting states of Jalisco and Chiapas. In the former wealthy state, she was able to spend some time in the agricultural community of Cuquio. Her purpose on this trip was “to learn about the impacts of the Green Revolution and NAFTA on corn production there.” Later in the year she visited Chiapas, a far less wealthy state, during the time of the coffee and corn harvests, “working with and learning about the Zapatistas (an indigenous insurgent group).”

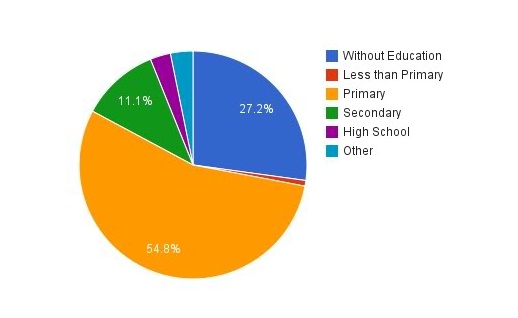
Educational level of farmers in Mexico, 2007

Educational level of farmers in Mexico, 2007. Credit: LaVidaLocavore.com

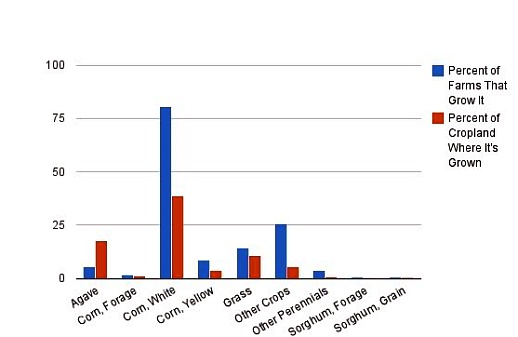
Following her trips, Richardson compiled a page summarizing agricultural statistics for Chiapas, Jalisco and Cuquio, based on Mexico’s 2007 Agricultural Census. The page has numerous tables and graphs about everything from crops grown and machinery used to irrigation, access to insurance, living conditions and other sources of household income.

Agriculture in Cuquio, 2010

Agriculture in Cuquio, 2007. Credit: LaVidaLocovore.com

Richardson’s passion for produce that is organic and locally produced is admirable. The anecdotes in her diary entries are well told, and raise important issues about the overuse/abuse of pesticides and fertilizers,the exploitation of farmers, microlending and a host of other factors that caught her attention. While her diaries are certainly not a comprehensive analysis of agriculture in the areas she visited, they do shed some light on some of the important issues facing farmers there. The diary entries are worth reading for the many examples and photographs included.

Her diary entries include:

I should note that despite Richardson’s impassioned and persuasive writing, I’m not actually in agreement with her advocacy for locavorism. I find myself more in agreement with the reviewer of her book who wrote that, “The author’s rabid advocacy of locavorism is especially myopic; she brushes past the costliness and impracticality—When buying eggs I ask the farmer how many chickens they own and if these chickens are on pasture—and ignores critics who argue that locavorism is an energy-inefficient fad.” (See The energy efficiency of farming in Mexico and elsewhere.)

That said, Richardson’s online diary is a very useful resource and likely to be a valuable starting point for many classroom discussions.

Related posts

Geo-Mexico has many other agriculture-related posts (easily found via our tag system). They include posts about the geography of growing/producing cacao, honey, sugarcane, coffeeChristmas trees, chiles, floriculture, tomatoes, tequila, horticultural crops and oranges.

Apr 032014
 

Geo-Mexico agrees entirely with Joseph Kerski (a key member of ESRI’s Education Team), that it is amazing “how little American students really know about their neighbor to the south.” In order to help remedy this situation, ESRI’s Witold Fraczek has created a series of online “story maps” about Mexico. The maps can be accessed in several different ways, including as an ArcGIS Online presentation and an iPad iBook, or via this webpage.

The six stories are entitled:

Each “story” includes several maps (covering topics such as population, landforms, climate, historical landmarks, caves, indigenous cultures, tourist attractions), some of which are interactive in the sense that clicking on a marked point brings up a pop-up panel with a photograph and/or additional information about that place. The maps, linked by short commentary notes, can be viewed at a variety of scales.

This series of maps has many strong points, and could certainly be useful in some geography classes, but it also has some weaknesses that should be taken into account when using them. Brief comments follow on each of the six stories.

1 Explore Mexico (Crime vs. Tourism)

The first map in this mini-series depicts “tourism attraction density” based on “650 major points of interest”. No clues are offered as to how the 650 points were selected, and indeed, some can not really be shown by points on a map since they cover larger areas. The map appears to weight all 650 points equally, though some are major, major tourist attractions (like the pyramids of Teotihuacan) that attract thousands of visitors a day, while others are very much less significant.

The second map, showing the “20 cities with most murders” uses data from 2011 (now out-dated) to conclude that “crime, measured by the total number of murders” appears to be “spatially isolated from the areas most attractive to tourists”. Surely murder rates (per 100,000 people) are a better measure than the number of murders in each city?

Murder rate per 100,000 is used as the basis for comparing Mexico with its regional neighbors, but Mexico is so large (and the murder rates across the country so varied) that comparisons at this scale mean relatively little, especially when some of the nations are tiny Caribbean islands, where one or two murders extra in any year can mean a significant spike in their murder rate.

2. Mexico’s Natural Wonders

The introductory text to this section rightly highlights how “the natural world of Mexico varies amazingly, from tropical jungles and coral reefs to deserts and glaciers.”

However, the statement that “Central Mexico is home to billions of Monarch Butterflies, whose 2 year /4 generation long trip to Canada and back amazes both scientists and the general public” is misleading. First, there may be millions of Monarch Butterflies, but there are not billions. Secondly, not all Monarch Butterflies migrate. Thirdly, those that do migrate are part of an annual (1 year) cycle involving 4 or 5 generations, not a two year cycle.

The text later claims that the Monarch Butterfly reserves “are located on old volcanic hills covered with pine-oak forest”. Actually, they overwinter in pine-fir forests. Mexico’s pine-oak woodlands occur only at much lower elevations.

The only birds incorporated into Mexico’s “biological wonders” are its pink flamingos, yet there are dozens of other bird species that are equally worthy of inclusion. Fortunately, the texts accompanying the maps of caves and cenotes (sinkholes), waterfalls, volcanoes, canyons and geologic sites appear to be much more accurate.
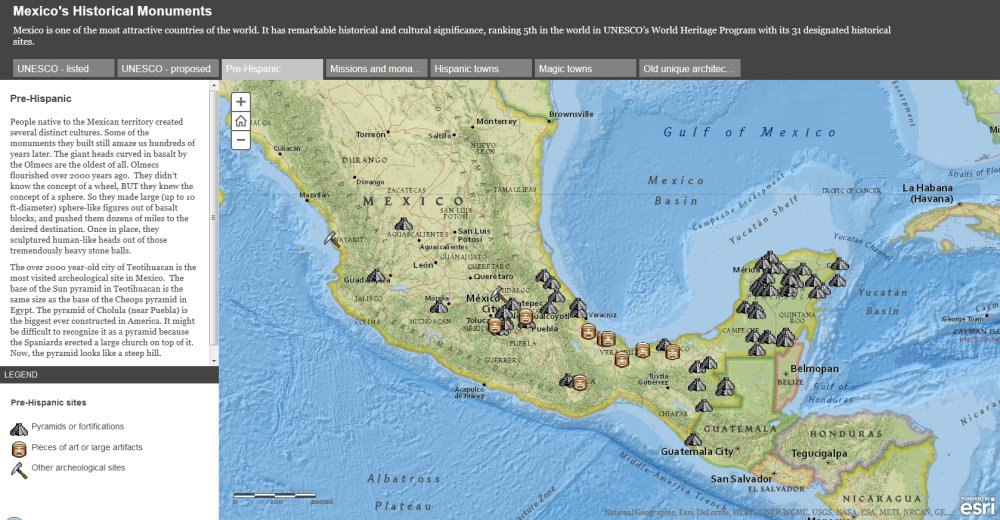
Screenshot from ESRI's story maps of Mexico.

Screenshot of ESRI’s story maps of Mexico.

3. Historical monuments

This section includes a useful map of Mexico’s World Heritage sites, though absent (from both the declared sites and the proposed sites) is the El Pinacate and Gran Desierto de Altar Biosphere Reserve in Sonora, which in June 2013 became Mexico’s 32nd World Heritage Site.

The great weakness of the maps of “archaeological sites” and “missions and monasteries” is that no clues are given as to how and why particular locations were selected for inclusion. This leads to some anomalies in the distribution. For example, Oaxaca is almost a no-show for “missions and monasteries” according to the map, despite such buildings being the subject of an excellent and extensive book by Richard Perry published as long ago as 2006, Exploring Colonial Oaxaca: The Art and Architecture.

The map of Magic Towns is also a useful map, though many more towns have been added to the list since 2012.

4. Geography of Mexico – Did You Know?

This series of maps will be quite useful to many classes as a quick way to introduce the basic physical and settlement geography of the country. Maps of relief and precipitation are accompanied by one of time zones and a simple map of states (though these are not named on the “map story” version) and major cities.

The introductory text to this section claims that “the array of Mexican volcanoes stretches along the same latitude as the volcanoes of Hawaii. Analogously, those located at the eastern ends are the newest and highest.” This may be true for Hawaii, but is not the case for Mexico. There is no simple pattern to the heights of Mexico’s major volcanoes, and certainly those in the east are not significantly younger than those in the west.

5. Indigenous People of Mexico

The single map in this section attempts to show the location of about 25 of Mexico’s many indigenous groups. The colors chosen for each group are in many cases confusingly similar, though the names of each group do appear as you zoom in on parts of the map.

The introductory text makes a strong case for Mexico’s attractiveness to tourists, yet concludes with the strange (and unanswered) question, “So why isn’t Mexico a major tourist destination?” Mexicans would beg to differ. Mexico is a major tourist destination. In 2013, for example, it received 23.7 million international visitors who spent 13.8 billion dollars. In fact, Mexico is ranked #11 in the world in terms of tourist arrivals (and that number excludes the 70 million or so border tourists each year).

6. Cartograms of Mexico

The cartograms in the last section certainly add interest to the map stories, but the basis of the “travelers attractiveness” map (those 650 tourist attractions again) means that the map is not a very good reflection of tourist numbers across the country. The significance of the State of Mexico is greatly exaggerated, while states such as Quintana Roo (with the resort of Cancún) and Baja California Sur (with Los Cabos) fail to stand out.

The final “fictional map” purports to portray Mexico as perceived by Californians. Based on the author’s personal impressions, in some ways this is the single most interesting map in the entire collection!

All in all, these maps are a mixed bag. The idea behind them is great, as is the decision to produce them in a flexible GIS system. If the details were refined a little, and more explanation offered about the basis for selecting places for inclusion, they would be even more useful in geography classes, and might go some way towards helping American students gain a better appreciation for their southern neighbor.
Global literacy or geo-illiteracy? The latest entrant to our “North America” hall of shame

 Books and resources  Comments Off on Global literacy or geo-illiteracy? The latest entrant to our “North America” hall of shame
Feb 042014
 

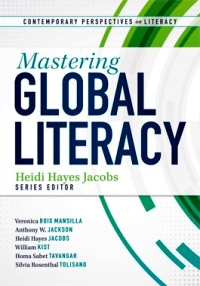
“Mastering Global Literacy” is a collection of short articles written to explain how “educators can cultivate globally literate learners while becoming globally connected themselves.” The book’s authors (Veronica Boix Mansilla, Anthony W. Jackson, Heidi Hayes Jacobs, William Kist, Homa Sabet Tavangar and Silvia Rosenthal Tolisano) “explore ways to bring global issues into the classroom and personalize them using new digital tools.” In addition, the advertising blurb promises that readers will find “strategies for implementing global-awareness studies into the traditional school curriculum, as well as creating new types of 21st century learning environments.”

mastering-global-literacyThe aims of this book are laudable, but sadly, in many ways, this book fails to live up to its hype. This is especially true of Chapter 5 (the concluding chapter), “Interdisciplinary Global Issues: A Curriculum for the 21st Century Learner”. The overly US-centric approach adopted in this book is nowhere more obvious than in this chapter. After defining what is meant by global literacy, the chapter considers how the (U.S.) National Geography Standards (NGS) can help educators plan courses that will promote it. The NGS certainly have considerable value in this regard, but (ironically) this chapter might have benefited from also considering a more global perspective such as that adopted by the geography curriculum of the International Baccalaureate’s Diploma Program.

Many of the suggestions made in this book for how global literacy can be promoted are already being practiced (and have been for decades) by geography teachers in the U.K., Australia and elsewhere. The idea that geography can be infused into other disciplines has been around for a long time, hence the proliferation of course titles (in many disciplines besides geography) including terms like “Global” and”World”. There is no need to reinvent this particular wheel in developing courses that promote global literacy, and little advantage to be gained from adopting new terminology, such as the proposals for “Geo-economics”, “Geocommunications”, “Geo-arts and literature”, “Geohealth”, “Geosports” and “Geo-education”.

This book is also the latest entrant in our “North America” hall of shame for its description of a “subject-specific strategy” that will boost global literacy in the classroom when “a globally connected educator facilitates the learning”. The strategy is based on a geography lesson in which “A middle school class is studying South America and following, via a blog and Twitter feed, a National Geographic-sponsored trip of a man traveling by bus from the United States to Antarctica. Students learn about the traveler’s different destinations throughout South America: Mexico, Guatemala, the Panama Canal, Colombia, Argentina, and finally, Cape Horn.”

“Houston, we have a problem!”. The suggestion that Mexico, Guatemala and the Panama Canal are located in South America is a classic example of geo-illiteracy and, as such, completely out of place in a book about global literacy.

Conclusion? While this book does have some valuable sections, it offers far less to geographers than its promotional materials would suggest. Given its title, the book’s failure to engage with modern geography (as practiced outside the USA) is a major limitation.

Mastering Global Literacy. Contributors: Veronica Boix Mansilla, Anthony W. Jackson, Heidi Hayes Jacobs, William Kist, Homa Sabet Tavangar, Silvia Rosenthal Tolisano. 136 pages. Solution Tree. 2013.

Related posts:

Jan 162014
 

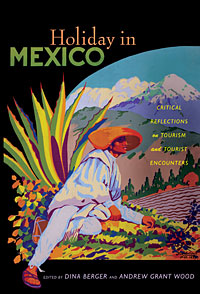
“Holiday in Mexico” is a collection of essays relating to the history of tourism in Mexico. The dozen authors involved are primarily academic historians, but also include a journalist. While the writing style is somewhat varied, this in no way detracts from the overall high quality of the contributions.

As Dina Berger and Andrew Grant Wood, the book’s editors, point out in their introduction, Mexico’s dilemma as regards tourism has always been to “reconcile market demand with a desire for national sovereignty” (p. 1). Tourism may stimulate the economy but can also have adverse environmental, social, and cultural consequences. Tourism promoters have always sought to “package” Mexico in a way that will attract tourists. The tourism sector’s portrayals of Mexico are inevitably subjective and seek to influence the perceptions of potential visitors.

The book’s 14 chapters (including the introduction) span 3 time periods:

  • 1840s-1911
  • 1920-50
  • 1960-present

and examine three main themes:

  • how Mexicans promoted and imagined their country and culture
  • the political lenses through which Mexicans and tourists have interacted with each other
  • the advantages and disadvantages of tourism

1840s to 1911

Two chapters look at the early history of tourism in Mexico. Andrea Boardman links the early days of American tourism in Mexico to the US soldiers who entered Mexico during the Mexican-American War. Among other achievements, American soldiers climbed Mexico’s highest peak, El Pico de Orizaba, though they were certainly not the first foreign nationals to do so. The accounts written by soldiers helped the American public appreciate that Mexico was worth exploring. Visiting Mexico became easier once the major railway lines had been completed at the end of the nineteenth century.

Christina Bueno offers a detailed look at the contested reconstruction of Teotihuacan, the earliest major archaeological site to be opened for tourism, its “restoration” timed to coincide with the celebrations for Mexico’s centenary of independence. Cultural and historical tourism have remained important aspects of tourism in Mexico ever since. Such tourism simultaneously stresses the significance of indigenous culture while portraying the nation as “modern” and “forward looking”.

1920-60

Five chapters of “Holiday in Mexico” look at the formative period of tourism development in Mexico that began shortly after the start of the Mexican Revolution in 1910.

cover of holiday in mexicoAndrew Grant Wood shows how business leaders in the port of Veracruz were able to reposition the city, changing its image from an insalubrious and unsafe city into a haven for cultural activities, music and dance, centered on annual Carnival celebrations.

Dina Berger looks at tourism, diplomacy and Mexico-USA relations. Mexico’s active promotion of its national progress (such as modern highways), democracy and friendliness coincided with a period when the USA pursued its Good Neighbor policy and Panamericanism (such as the construction of the Pan American Highway).

Eric Schantz’s essay focuses on postwar tourism in Baja California’s border zone, and considers the impacts of gaming, racing, prostitution and the growing tourism entertainment industry. Many of those crossing the border to partake in these activities were, strictly speaking, “visitors” rather than “tourists”, since they remained less than 24 hours, but they had a massive influence on the economy of some border cities.

In the next chapter, “Fun in Acapulco? The Politics of Development on the Mexican Rivera,” Andrew Sackett weaves a carefully-crafted narrative that encompasses Acapulco cliff divers, Hollywood movie stars, state intervention, poor ejido farmers being dispossessed of their land, and the capriciousness of resort developers. This is possibly the strongest chapter in the book from a geographical perspective, though Sackett overstates the significance of a 1946 map of the city, since all maps are perceptual statements and necessarily simplify the landscape and select the most appropriate points of reference for their intended audience.

Lisa Pinley Covert then looks at how San Miguel de Allende’s tourist industry developed from a combination of local, national and international factors and players. In this case (unlike Acapulco) local efforts were preeminent in establishing the city’s reputation as a center for cultural tourism. Interestingly, no distinction is drawn in this chapter between the impacts of “tourists” and the impacts of the longer-term, non-tourist foreign residents that now comprise a distinctive segment of the city’s population.

1960-present

The final five chapters have greater contemporary relevance. Jeffrey Pilcher gives an engrossing account of how culinary tourism emerged, of how restauranteurs created “authentic” Mexican cuisine, a kind of “gentrification” of Mexican food. This account supports the view that cultural imperialism has not led to the food homogenization of North America, but, on the contrary, has led to varied, glocalized responses including innovatory regional and local cuisine.

M. Bianet Castellanos looks at the lesser-known face of mass tourism in the centrally-planned FONATUR resort of Cancún: the many service workers who migrated from nearby indigenous communities, and their perceptions of the resort and its tourist industry.

Adopting a national viewpoint, Mary K. Coffey examines how federal government policies in the past decade or so have sought to promote Mexico’s artistic and folk art culture as a powerful magnet for tourism. To remain competitive on the world stage, and counteract the impacts of events elsewhere (such as 9/11), Mexico’s tourism sector needs to continually reinvent itself. This is an excellent example of how changing policies and rhetoric can help keep Mexico in the world tourist spotlight.

In looking at Los Cabos, another centrally-planned resort, Alex M. Saragoza emphasizes how it was designed specifically to appeal to wealthy US tourists, hence its emphasis on golf courses, and its grandiose plans (now scaled-back) for the “Escalera Náutica”, a network of marina resorts.

The final essay, by travel writer Barbara Kastelein, looks at some of the forces behind the development of tourism in three contrasting locales: Acapulco, Oaxaca and Amecameca, considering some of the broader aspects including race, gender, and class dynamics.

The geographical coverage of “Holiday in Mexico” is quite broad but certainly not comprehensive. The use of case studies allows the authors to explore the many subtexts in depth, but it may be that some of the insights arrived at fail to hold up when a regional or national scale is considered.

The book certainly provides plenty of ideas worth further discussion, along with thoughtful analysis of different stakeholders, different types of tourism and their relative merits. The authors do not shy away from looking at the impacts of the massive socioeconomic gaps between tourists and their Mexican hosts, or of the corruption that has unfortunately accompanied many tourism developments in Mexico.

If I have one minor reservation about this book, it is that it is overly US-centric. The history of tourism in Mexico deserves a more nuanced approach, one in which the role of European and Latin American tourists is also closely examined. This clearly opens up many possibilities for future research.

Dina Berger and Andrew Grant Wood (eds). 2010 “Holiday in Mexico: Critical reflections on tourism and tourist encounters.” Duke University Press.

Related posts:

Water management progress in the Lerma-Chapala basin

 Books and resources  Comments Off on Water management progress in the Lerma-Chapala basin
Jan 112014
 

The Lerma-Chapala Basin (see map) is one of Mexico’s major river systems, comprising portions of 127 municipalities in five states: México, Querétaro, Michoacán, Guanajuato and Jalisco.

The basin has considerable economic importance. It occupies only 2.9% of Mexico’s total landmass, but is home to 9.3% of Mexico’s total population, and its economic activities account for 11.5% of national GDP. The basin’s GDP (about 80 billion dollars/year) is higher than the GDP of many countries, including Guatemala, Costa Rica, Honduras, Paraguay, Bolivia, Uruguay, Croatia, Jordan, North Korea and Slovenia.

Lerma-Chapala Basin

The Lerma-Chapala Basin. Click map to enlarge. Credit: Tony Burton / Geo-Mexico

Given this level of economic activity, it is probably not surprising that the pressures on natural resources in the basin, especially water, are enormous. Historically, the downstream consequence of the Lerma Basin’s agricultural and industrial success has been an inadequate supply of (heavily polluted) water to Lake Chapala.

Following decades of political inactivity or ineffectiveness in managing the basin’s water resources, solid progress finally appears to have been made. Part of the problem previously was a distinct lack of hard information about this region at the river basin scale. The statistics for such key elements as water usage, number of wells, replenishment rates, etc. were all (to put it politely) contested.

Fortunately, several scientific publications in recent years have redressed the balance, and the Lerma-Chapala Basin is now probably the best documented river basin in Mexico. This has allowed state and federal governments to negotiate a series of management agreements that are showing some positive signs of success.

The first of these key publications was “The Lerma-Chapala Watershed: Evaluation and Management“, edited by Anne M. Hansen and Manfred van Afferden (Klewer Academic/Plenum Publishers, 2001). This collection of articles featured contributions from researchers in several universities and research centers, including the University of Guadalajara, Mexican Institute of Water Technology, Autonomous University of Guadalajara, Baylor University, the Harvard School of Public Health and Environment Canada. Click here for my comprehensive description and review of this volume on MexConnect.com.

Perhaps the single most important publication was the Atlas de la cuenca Lerma-Chapala, construyendo una visión conjunta in 2006. Cotler Ávalos, Helena; Marisa Mazari Hiriart y José de Anda Sánchez (eds.), SEMARNATINE-UNAM-IE, México, 2006, 196 pages. (The link is to a low-resolution pdf of the entire atlas). The atlas’s 196 pages showcase specially-commissioned maps of climate, soils, vegetation, land use, urban growth, water quality,  and a myriad of other topics.

More recently, a Case Study of the Lerma-Chapala river basin: : A fruitful sustainable water management experience was prepared in 2012 for the 4th UN World Water Development Report “Managing water under uncertainty and risk”. This detailed case study should prove to be especially useful in high school and university classes.

The Case Study provides a solid background to the Lerma-Chapala basin, including development indicators, followed by a history of attempts to provide a structural framework for its management.

In the words of its authors, “The Lerma Chapala Case Study is a story of how the rapid economic and demographic growth of post-Second World War Mexico, a period known as the “Mexican Miracle”, turned into a shambles when water resources and sustainable balances were lost, leading to pressure on water resources and their management, including water allocation conflicts and social turbulence.”

On a positive note, the study describes how meticulous study of the main interactions between water and other key development elements such as economic activity and social structures, enabled a thorough assessment on how to drive change in a manner largely accepted by the key stakeholders.

The early results are “stimulating”. “Drawbacks and obstacles are formidable. The main yields are water treatment and allocation, finances, public awareness, participation and involvement. The main obstacles are centralization, turbid interests, weak capacity building, fragile water knowledge; continuity; financial constraints; and weak planning.”

Sustainable water usage is still a long way off. As the Case Study cautions, “There is still much to do, considering the system Lerma-Chapala responds directly to a hydrologic system where joint action and especially abundant involvement of informed users is required, to achieve sustainable use of water resource.”

One minor caveat is that the Case Study does not offer full bibliographic reference for all of the maps it uses, which include several from the previously-described Atlas de la cuenca Lerma-Chapala, construyendo una visión conjunta.

Related posts:

Nov 162013
 

In an alliance with the Sonoran Institute, the National Geographic Center for Sustainable Destinations helped the region’s communities create the first transborder Geotourism MapGuide, covering northern Sonora and southern Arizona. The mapguide was published in 2007:

The maps  have vignettes of information about history, culture, geology and many other aspects of the region, making it a useful guide for geo-tourists. While some might argue about the choice of locations and attractions described on the maps, this is a useful addition to the background reading for anyone thinking of traveling to this region with some time on their hands to explore.

Surprisingly, the map has only a very brief and somewhat dismissive mention of the El Pinacate and Gran Desierto de  Altar Biosphere Reserve:

“Stand at the rim of this mile-wide volcanic crater and you may feel as if you’re on the moon. This land of ancient lava, sand, and cinder cones is sacred to the O’Odham people. Today, those on the Sonora side of the border call themselves “Pápago.”

Related posts:

Plan for open-pit gold mine in Baja California Sur rejected

 Books and resources, Mexico's geography in the Press  Comments Off on Plan for open-pit gold mine in Baja California Sur rejected
Oct 122013
 

In November 2012, the federal Environment and Natural Resources Secretariat (Secretaría de Medio Ambiente y Recursos Naturales, Semarnat) refused a request to allow open-pit (opencast) mining in the buffer zone of the Sierra La Laguna Biosphere Reserve in Baja California Sur.

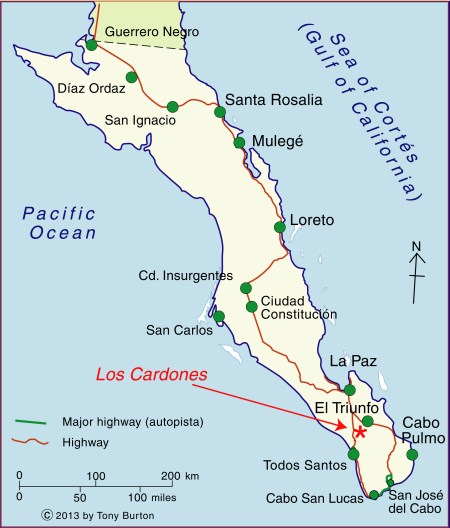
The request came from Zapal SA de CV, whose mining project, currently named “Los Cardones”, is located about 60 km from La Paz, the state capital. The proejct is close to the small settlements of El Triunfo, San Antonio and El Rosario. This mining project was previously called “Paredones Amarillos” and “La Concordia”. The original Concordia project, proposed by US mining firm Vista Gold and Toronto-listed Argonaut, was opposed on environmental and public health grounds by several environmental groups including the Mexican Center for Environmental Law (CEMDA).

Location of Los Cardones mining project. Credit: Tony Burton/Geo-Mexico

Location of Los Cardones mining project.

The latest version, Los Cardones, was resubmitted to authorities in September 2012. The project involved 423 hectares of semi-arid scrub-land, from which Zapal hoped to extract 40 metric tons of gold in the next decade using open-cast (pit) mining. The $217-million project would have created around 2200 jobs.

According to the project’s website (no longer functional), the mining project would have relied entirely on desalinated seawater (brought to the site by a 40-km aqueduct), which would be continuously recycled, and would therefore have no impact on local aquifers. Zapal claimed that the mine would have been the first gold mine in Mexico to use a closed-system cyanidation process, designed to prevent any contamination of the local environment. Zapal is part of the Invecture group which already operates an open cast copper mine in Piedras Verdes, Sonora, claimed to have an impeccable environmental and safety record.

Semarnat rejected the proposal on the grounds that it did not meet the legal requirements for mining operations in a Biosphere Reserve buffer zone. It is likely that a revised application will be made in due course. However, officials of the Baja California state government have previously gone on record as saying that they will oppose any open-cast mining in the state, because of its potential environmental impacts.

Anti-mining protests elsewhere in Mexico

David Bacon, author of “The Right to Stay Home: How US Policy Drives Mexican Migration”, wrote an informed account for the American Program website of several cases across Mexico where opposition to Canadian mining firms has arisen.

  • Mexican Farmers Up Against Canadian Mining Goliaths

A Guardian photo essay entitled “Mexico mining: ‘When injustice is law, resistance is duty’ – in pictures” reported on a January 2013 meeting of some 500 activists from across Mexico and Central America in Capulálpam de Méndez, Oaxaca. The meeting’s slogan was,  “Si la vida! No la
minera!” (Yes to life! No to mining!). It was held to co-ordinate local resistance to the human and environmental costs of mining on the region’s communities.

Related posts:

“Los que llegaron”, Spanish language videos about Mexico’s immigrant groups

 Books and resources, Teaching ideas  Comments Off on “Los que llegaron”, Spanish language videos about Mexico’s immigrant groups
Oct 052013
 

Once TV México (“Eleven TV Mexico”) is an educational TV network owned by the National Polytechnic Institute (Instituto Politecnico Nacional) in Mexico City. Over the years, Once TV México programs have won numerous national and international awards.

Many of its programs are available as webcasts or on Youtube. Once TV México has made hundreds of programs that provide valuable resources for Spanish-language geography classes or for students of Spanish or anyone wanting to improve their Spanish-language skills. For example, their long-running program “Aquí nos tocó vivir” (“Here We Live”) has explored all manner of places throughout Mexico over the past 35 years, and has received UNESCO recognition for its excellence.

Of particular interest to us is “Los que llegaron” (“Those Who Arrived”), a series of programs looking at different immigrant groups in Mexico. Each 20-25 minute program focuses on a different group and explores the history of their migration to Mexico, their adaptation to Mexican life, their integration into society, the areas where they chose to settle, and the links between their home countries and Mexico.

Mexico has a long history of welcoming people from other countries, including political refugees. Each of these programs offers some fascinating insights into the challenges faced by migrants arriving in Mexico for the first time.

Sister city of Segusino, Italy

Sister city of Segusino, Italy

For instance, the program about Italian immigration to Mexico (above), explains why Mexico was seeking colonizers in the middle of the 19th century in order to populate and develop rural areas. One group of Italians settled in Veracruz (in present-day Gutiérrez Zamora); another group, 3,000 strong, and from the Veneto region in northern Italy, settled in Chipilo, near the city of Puebla. (For anyone not familiar with Chipilo, one of our favorite bloggers, Daniel Hernandez, has penned this short but memorable description of a typical Sunday morning there: Cruising in Chipilo, an Italian village in Mexico).

Italian immigration increased dramatically after the 1914-1918 war. Today, according to the program, there are approximately 13,000 Italian citizens residing in Mexico and an estimated 85,000 Mexicans of Italian descent. Note, though, that most sources quote a much higher figure for the latter category, perhaps as high as 450,000.

[Aside: In chapter 4 of “Mexican National Identity, Memory, Innuendo and Popular Culture”, William H. Beezley looks at the role of itinerant puppet theater in molding Mexico’s national identity. The largest and most famous single troupe of all was the Rosete Aranda troupe, formed by two Italian immigrants in 1850. The troupes went from strength to strength in the next half-century. By 1880, the Rosete Aranda company had 1,300 marionettes and by 1900 a staggering 5,104. Their annual tours around the country helped influence national opinions and attitudes.]

Program list for the “Los que llegaron” series:

  • Españoles (Spaniards)
  • Alemanes (Germans)
  • Húngaros (Hungarians)
  • Italianos (Italians)
  • Argentinos (Argentines)
  • Ingleses (English)
  • Japoneses (Japanese)
  • Estadounidenses (Americans)
  • Coreanos (Koreans)
  • Franceses (French)
  • Chinos (Chinese)
  • Libaneses (Lebanese)
  • Rusos y Ucranianos (Russians and Ukrainians)

Related posts:

Resources about the geography of chinampas, an ancient form of sustainable agriculture

 Books and resources  Comments Off on Resources about the geography of chinampas, an ancient form of sustainable agriculture
Sep 302013
 

This post describes some of the many online resources about chinampas, one of Mexico’s ancient and most important indigenous forms of sustainable agriculture.

For photos, the best starting point is Dr. Jason Turner’s site about chinampas which includes an extensive bibliography about chinampas as well as several “Virtual Field Trips” (photo sequences). Even though these photo sequences often lack any accompanying descriptions or captions, they cover a wide range of ideas, and are organized in self-explanatory groups such as:

For an article describing a recent tour of a working chinampa in Xochimilco’s Ecological Reserve. illustrated with great photos, try Touring Xochimilco’s farms with De la Chinampa written by Lesley Téllez (self-described food writer with a “deep love for Mexican food and culture”) on her blog “The  Mija Chronicles”.

Youtube also has a variety of chinampa-related resources. In English, the best introduction is Discovery Atlas – Mexico: Xochimilco which provides a good background to the history and covers the basics.

Two Spanish-language Youtube resources provide valuable additional information. Each video lasts about 5 minutes, but neither video has English language subtitles.

The first is Divina Ciudad: De la chinampa a la mesa which looks at one specific project designed to help raise public awareness and aid the conservation of the remaining chinampas in Xochimilco, on the south-eastern outskirts of Mexico City. This project supplies consumers with fresh produce grown on the chinampas in Xochimilco or sourced from within 150 km. See the project’s website – De La Chinampa – for more information.

The second Spanish language video is Profeco TV Reporte Especial: Productos de la Chinampa, un ejemplo de consumo sustentable, This video, made by the federal consumer protection agency Profeco, explains how the produce grown on the chinampas is pesticide-free and relies on sustainable production methods. It calls on viewers to “learn more about the method and help ensure that chinampas do not disappear.”

Book (Spanish)

  • Rojas R., Teresa (Coord) 1995. Presente, pasado y futuro de las chinampas. Mexico DF: Ciesas/Patronato del Parque Ecológico de Xochimilco A.C. This is a collection of 25 papers presented at a 1990 international conference in Mexico City.

Related posts

Have big cities in Mexico succeeded in meeting people’s needs?

 Books and resources, Other  Comments Off on Have big cities in Mexico succeeded in meeting people’s needs?
Sep 262013
 

In 2012, the Mexican Institute for Competitiveness (Instituto Mexicano para la Competitividad AC, IMCO) published an analysis of the competitiveness of 77 of the largest cities in Mexico, looking to see which of them offered balanced growth alongside a good quality of life for their inhabitants.

portada_indiceThe elements of competitiveness considered included the degree of compactness (more compact cities are more efficient and sustainable), public finances, transport, security, water management and waste management. The IMCO methodology is explained in detail in the report Índice de Competitividad Urbana 2012. In short, IMCO evaluated each of the 364 municipalities involved in the 77 cities, using 60 indicators grouped into 10 mutually-exclusive sub-indexes.

Between them, these 77 cities house 63% of Mexico’s total population and account for 80% of Mexico’s GDP. 55% of Mexico’s population live in cities managed by two or more municipalities. IMCO found that public transport was adequately coordinated in only 13% of cities with two or more municipalities, while urban planning was coordinated in 35% of the multi-municipality cities.

The IMCO report concludes than most Mexican cities do NOT offer balanced growth and a decent quality of life for residents. Individual cities can be compared using this IMCO site.

The only city offering a “High” level of competitiveness was Monterrey.

Several cities offered an “Adequate” level: Mexico City, San Luis Potosí, Querétaro, Ciudad del Carmen, Saltillo, Tampico, Colima, Guadalajara, Mexicali, Monclova and Campeche.

At the other end of the spectrum, the competitiveness of several cities in Mexico was categorized as “Low”: La Piedad, Cd. Cárdenas, Rioverde, Matamoros, Tehuantepec, Tijuana, San Francisco del Rincón, Cd. Juárez, Ensenada and Poza Rica.

The lowest levels of competitiveness (“Very Low”) among the 77 cities studied were found in two cities in the state of Guerrero: Chilpancingo and Acapulco.

The report used data from 2010, so some aspects of these cities will have changed since that date. For example, the sharply increased murder rate in Monterrey since 2010 will have reduced its lead over other cities.

Certain cities have faced severe challenges of rapid growth. In recent decades, the cities that have grown most rapidly have not been the very large cities like Monterrey, but mid-sized cities. One example of a mid-sized city that has grown rapidly is Ciudad Juárez, whose area grew 497% from 1980 to 2009, while its population rose 70%. This rapid growth may have contributed to the high levels of crime experienced in the city.

IMCO concludes that Mexican cities are showing clear signs of not functioning well: chaotic expansion, heavey traffic, high levels of air pollution, poor supply and/or quality of potable water, high crime levels. These have caused cities to lose competitiveness and the capacity to attract human talent from outside, whether for business, sports or research.

The single obstacles to increased competitiveness are the lack of professional urban management, and the fact that many cities involve two or more municipalities. The laws governing municipal elections inevitably mean that administrations are short-term, with a high level of staff turnover. The impossibility of re-election means that many urban projects are overly superficial and they lack continuity from one administration to the next.

IMCO suggests that a new administrative position be created: the city manager (administrador urbano). The city manager would be a professional manager, and would ensure that the city has adequate coordination for all urban public services, even where more than one municipality is involved. This would free the municipal politicians from having to tackle the day-to-day management issues of the city and allow them more time to engage productively with the citizenry. However, for this to happen, a major institutional innovation is required.

Related posts:

Aug 052013
 

A recent study published by the Clean Air Institute analyzed air pollution in 22 Latin American cities:

  • Air Quality in Latin America: An Overview (May 2013; pdf file)

Six Mexican cities were included in the study: Mexico City, Guadalajara, Monterrey, Puebla, Ciudad Juárez and León. However, only limited data were available for Puebla, Cd. Juárez and León. One of the main conclusions of the study is that Mexico has about the worst urban air pollution in Latin America. It is believed to be responsible for about 15,000 deaths in Mexico each year.

The focus was on the following air pollutants:

  1. Particulate matter is divided into two measures; particles less 2.5 microns in diameter (PM2.5) and those less than 10 microns (PM10). PM2.5 pollution is extremely harmful because it penetrates deep into lungs causing inflammation and worsening heart and lung diseases. This can be fatal.
  2. Ozone is formed in the air when oxides of nitrogen and volatile organic compounds mix with intense sunlight. The very intense sunlight in Mexican cities makes them particularly prone to ozone pollution.
  3. Nitrogen dioxide (NO2) is caused by high temperature combustion of fossil fuels in vehicles, factories and power plants. It can aggravate lung diseases as well as contribute to ozone and fine particle pollution.
  4. Sulfur dioxide (SO2), which also comes from burning fossil fuels, contributes to heart and respiratory disease. Unfortunately, not all of the 22 cities had data on all four pollutants. Consequently comparisons among cities are a bit limited.

According to the study, Mexican cities had some of the worst urban particulate pollution in Latin America, significantly above WHO standards. Of the 16 cities with data, Monterrey had by far the worst PM10 pollution with 85.9 micrograms per cubic meter (ug/m3); considerably worse than the perennially dusty Lima with 62.2 ug/m3. Guadalajara came second with 70.1 ug/m3, Mexico City was 6th with 57.0 ug/m3, and León placed 11th with 39.0 ug/m3, even worse than Sao Paulo at 36.5 ug/m3. Though not in the study, Mexicali has worse PM10 pollution than Monterrey. Also Monterrey’s PM10 levels are much better than many major world cities including Cairo, Delhi, Kolkata, Beijing, Chengdu, Bangalore, Shanghai, Dacca, Jakarta, and Karachi.

Mexico City air quality in 1980 (Photo: Tony Burton)

Mexico City air quality in 1980 (Photo: Tony Burton)

Mexico did a bit better with respect to the more serious PM2.5. Of the 11 cities with data, Bogota was worst with 35.1 ug/m3 followed by Lima at 31.5ug/m3 and San Salvador and Montevideo at 28.0 ug/m3. The two Mexican cities with data, Mexico City (26.2 ug/m3) and Monterrey (25.9 ug/m3) were 6th and 8th.

Mexican cities also have some of the highest levels of ozone pollution. Of the ten cities with data, five of the six worst were Mexican cities. Guadalajara had the highest ozone pollution with 69.3 25.9 ug/m3 followed closely by León 68.9 at ug/m3. Mexico City was 4th (59.4 ug/m3); Monterrey was 5th (55.2 ug/m3); and Cd. Juárez came 6th (46.3 ug/m3), just ahead of Quito (44.1). Much better ozone levels were recorded by Sao Paulo (36.0 ug/m3), Santiago (28.8 ug/m3) and Bogota (21.1 ug/m3).

Cities in Mexico also had high levels of nitrogen dioxide. The highest levels were in Montevideo (70.0 ug/m3), but Guadalajara (57.2ug/m3), Mexico City (54.2 ug/m3) and León (45.5 ug/m3) placed 2nd, 3rd and 4th worst among the 14 cities with data. Monterrey was much better with the third lowest nitrogen oxide level (29.0 ug/m3), trailing only Lima (12.8 ug/m3) and Quito (23.3 ug/m3).

Mexican cities were also among the worst in terms of sulfur dioxide pollution. Of the 13 cities with data, León had by far the highest level with (23.4 ug/m3), followed by Medellin (16.0 ug/m3). Mexico City was 3rd worst (15.3 ug/m3); Monterrey was 4th (13.1 ug/m3); and Guadalajara was 6th (8.6 ug/m3).

In summary, the study indicates that Mexico has about the worst urban air pollution in Latin America. Fortunately, Mexico City, which used to be considered one of the most polluted cities in the world, has significantly improved its air quality in the last few decades. (see Rhoda and Burton, Geo-Mexico: The geography and dynamics of modern Mexico, p 177)

On the other hand, other major cities in Mexico have not had the same experience. The data in this study appear to suggest that among Mexico’s three biggest cities, Guadalajara has the worst air pollution followed by Mexico City and then Monterrey. (This study found insufficient data for comparisons with Puebla, Cd. Juárez and León.)

Other posts on urban air pollution:

Aug 032013
 

It currently takes about 5 hours to drive from the city of Durango to the Pacific coast resort of Mazatlán, but this time will be slashed to under 3 hours once the new 1.2-billion-dollar, 4-lane, 230-kilometer highway between the cities is complete.  The Baluarte Bridge is already in place and was officially opened in January 2012, but the highway is still incomplete and not yet open. The highway is due to be completed by later this year, rainy season permitting.

This post features two videos about the Bridge. The first 4-minute video (below) is in English and is a promotional short for VSL International, one of the construction firms building the bridge. It includes footage of the amazing building techniques that were required.

The main span of the Baluarte Bridge is 520 meters in length and is 402 meters above the river (rather than the 390 m in the picture below), making it not only the tallest cable-stayed bridge in the world, but the cable-stayed bridge with the longest span in the Americas.

puente-baluarte

Puente Baluarte. Photo: TRADECO

The second video (below), first aired on National Geographic channels in Latin America, is 43 minutes long and entirely in Spanish (no subtitles). Its English-language equivalent, entitled Megastructures: World’s Highest Suspension Bridge, has been shown in the USA and Canada, but is not currently viewable online.

There is a minor geographic error in the first minute of this video when it shows a graphic placing the Baluarte Bridge at the junction of two distinct highways (Durango-Mazatlán and Tampico-Durango). The producers have taken some “geographic license” here since the two highways actually meet in the vicinity of the city of Durango, a considerable distance east of the Baluarte Bridge, which is more properly located on the boundary between the states of Durango and Sinaloa, mid-way between Durango and Mazatlán.

While this Spanish language version is quite long winded in places, it includes some spectacular photos and graphics, including the celebration held when the two crews working from opposite sides of the ravine finally met each other in the middle!

In order to ensure safety, the Baluarte Bridge is kitted with an array of sensors which send real time information to engineers in Mexico City who can monitor every aspect of the bridge and its response to every change in wind direction, strength, traffic, etc.

The construction project is not without its critics. While tourism officials expect a massive increase in the number of visitors to Mazatlán, and a doubling of the number of hotel rooms in that resort in the next 10-15 years, the local residents of several villages and ejidos along the route of the new highway claim they have not yet been fully paid for allowing construction crews access to their property or compensated for the damage caused to their pine forests, farmland and water supplies. The new highway may also “change the criminal dynamic” in this mountainous area, the more remote parts of which have a long and troubled history of violence and drugs trafficking.

We’ll post again about this astonishing engineering achievement when the new highway is completed and open to regular traffic, hopefully later this year! Meanwhile, it’s back to drawing an updated version of Figure 17.4 of Geo-Mexico, the geography and dynamics of modern Mexico (currently on special offer at Amazon.com), a map showing the average driving times by road from the city of Durango to everywhere else in Mexico.

Related posts:

Jul 062013
 

Popocatepetl Volcano (“Don Goyo” to the people living in its shadow) continues to erupt. On 4 July, several airlines, including American Airlines, US Airways, Delta Airlines and Alaska Airlines suspended operations to and from Mexico City for several hours, resulting in numerous cancelled flights.

Mexico’s National Disaster Center (Cenapred) provides daily updates (in both English and Spanish) on the volcano’s activity. The Volcanic Alert Level was raised today (6 July) to Yellow Phase 3. This includes:

  1. Access is restricted within a radius of 12 km from the volcano’s crater. Permanence in this area is not allowed.
  2. The road between Santiago Xalitzintla (Puebla) and San Pedro Nexapa (Mexico State), including Paso de Cortes, is open only to authorized traffic.
  3. Civil Protection authorities maintain preventive procedures, according to operative plans.
  4. People are advised to follow guidelines provided by official information bulletins.

There are only two higher levels (both described as “Alarm” rather than “Alert”): Red Phase 1 and Red Phase 2.

Since our last update in March, several spectacular images of the volcano have been released.  Activity increases every two or three weeks, as the following brief reports, based on the Cenapred daily updates, reveal:

8 May – Ash rose 3000 m above the volcano before falling on several municipalities in the states of Puebla and Tlaxcala. Residents were advised to sweep it up without using any water to prevent the ash from sticking together and blocking drains. Mexico City’s international airport was closed to flights for a short time.

14 May – Eruptions continued, accompanied by an increase in seismic activity. The Alert Level was raised to Yellow Phase 3 for several days, with evacuation plans about to be implemented. A dome of lava, about 350 m across and 50 m thick, had formed in the crater, prior to being destroyed in an eruption which formed a 3000 m high ash cloud and sent incandescent fragments (“volcanic bombs”) up to 1000 m from the crater. The volcano’s activity subsided within days and the alert level was reduced to Yellow Phase 2.

17 June – A month later, another explosion (see photos) sent ash more than 4000 m into the air, and threw volcanic bombs up to 2000 m from the crater, starting a series of minor wild fires. Winds blowing towards the northwest carried ash towards the south-eastern section of Mexico City. A week later (24 June), minor amounts of ash fell in eight municipalities in the state of Mexico: Amecameca, Tlalmanalco, Temamatla, Cocotitlán, Ozumba, Atlautla, Ecatzingo and Chalco. The local authorities reported no damage, but reminded residents, among other things, to avoid wearing contact lenses if at all possible. The next day (25 June), ash fell on some southern and eastern parts of Mexico City. Three international flights scheduled to land in Mexico City airport were diverted to Querétaro airport.

The typical sequence of activity is shown in the photos. First, pressure from molten rock underground (magma) leads to the formation of a dome of lava in the summit crater (photo below).

Lava dome building in crater of Popocatapetl Volcano

Lava dome building in crater of Popocatapetl Volcano

These domes eventually either collapse or are destroyed by explosions (photos below) that lessen the pressure beneath the surface.

NasaPopocatapetl Volcano erupts, 17 June 2013

Popocatapetl Volcano erupts, 17 June 2013

Following the explosion (shown by the satellite image below), a new dome begins to form, and the cycle of eruptive activity continues.

Geophysicists from the National University (UNAM) who monitor the volcano and analyze its gaseous emissions say that between 1994 and 2008 the volcano emitted 30 megatons (30 million tons) of gases and that it looks set to continue erupting for several years. Popocatepetl is one of the top five volcanoes in the world for emissions of sulfur dioxide. The volcano has added between 6000 and 8000 tons/day to the atmosphere in recent months. Lead researcher Hugo Delgado Granados has been quoted in press reports as saying that the continued gaseous emissions are good news, since the constant releases of pressure should preclude a more explosive eruption.

A YouTube compilation of webcam videos of the volcano provides a time-condensed view of the eruption of 17 June 2013. The 30-second video represented a period of 20-30 minutes, during which the volcano exploded into action, sending a cloud of gases, ash and volcanic fragments high into the air.

Related posts:

Watch La Primavera’s geological history unfold via a short video animation

 Books and resources  Comments Off on Watch La Primavera’s geological history unfold via a short video animation
Jun 292013
 

Only days after we published our third post about the Primavera Forest, near Guadalajara, we were alerted to an excellent 9 minute video animation of how the area was formed. This short video about “The Exciting Geology of Bosque La Primavera” was produced by geologist Barbara Dye during her stint as a Peace Corps volunteer in Mexico.

The video can also be viewed in Spanish:

Dye has also written a beautifully-illustrated 72-page guide (in Spanish) to the geology of the Primavera Forest, entitled “La Apasionante Geología del Área de Protección de Flora y Fauna La Primavera.

Previous posts about La Primavera: