For a small Mexican town of somewhat nondescript architecture, Jiquilpan de Juárez, in Michoacán, has considerable claim to fame, well deserving of its Magic Town status. Jiquilpan is the birthplace of two Mexican Presidents, who played pivotal roles in national affairs, and several distinguished artists. Its unprepossessing exterior appearance offers no hint of the important works of art—including sculptures and a singular mural—which are to be discovered in the town.
The first former President associated with the town is Anastacio Bustamante, who had the distinction of being President three times 1830-32, 1837-39, 1839-41). In the interim between his first two governments, Mexico was forced to cede a large part of its territory, including Texas, to the USA. Bustamante, considered one of the more honest nineteenth century politicians, seized power for the first time in 1830, overthrowing Vicente Guerrero. He was in turn overthrown by Santa Anna in 1832, and fled to England. On resuming office in 1837, after the rather unsavory incidents which robbed Mexico of Texas, Bustamante immediately faced the “Pastry War” crisis.
The Pastry War began when Mexico refused to pay compensation for damages to a pastry shop, owned by a Frenchman in Mexico City. The shop had allegedly been looted during riots in 1828. Ten years later, the French government used this pretext, and other losses which had occurred at the same time to other French property, to demand 600,000 dollars in damages from the Mexican government of Bustamante. The French also sought a preferential trading agreement with Mexico. Bustamante considered the claim for looted pastries to be preposterous and refused either to pay, or to consider the trade agreement. Outraged, the French brought up a fleet from the Caribbean island of Martinique and blockaded Veracruz. Seven months later, the French added a further 200,000 dollars to their demand to cover the costs of the blockade. Bustamante finally gave in and paid in full, whereupon the French fleet sailed off.
The second former President associated with Jiquilpan is Lázaro Cárdenas, born in the town on the 21st May, 1895. As national President (1934–40), he presided over a massive agrarian reform program and in 1938 nationalized the railways and the oil industry. He was the last President to be held in sufficient esteem to occupy important ministerial posts including Defense Secretary after the end of his term as President.
 On Jiquilpan’s main street, appropriately named Avenida Lázaro Cárdenas, are the library and the town museum. During Lázaro Cárdenas’ presidency, a nineteenth century church in Jiquilpan was converted to a library and embellished with two impressive works of art. The new door of the library, in which are sculpted the heads of 22 of the most outstanding figures of the early twentieth century, was designed by Guillermo Ruiz. It is a beautiful tribute to the greatest thinkers and scientists of the time (Edison, Marti, etc.).
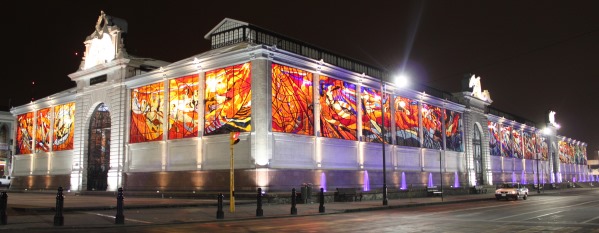
The murals decorating the interior of the library were painted by an even more prominent figure in the history of Mexican art: José Clemente Orozco, one of the famous “Big Three” of Mexican Muralism, alongside Diego Rivera and David Alfaro Siqueiros. Orozco painted, literally singlehandedly (having lost his left hand in a childhood accident) a series of sketchy black-and-white murals depicting political parties and revolutionary Mexico on either side of the former nave and an unusual and striking full-color, nationalistic mural known as “A Mexican Allegory”.
The modern Jiquilpan museum, east of the town center beyond the very friendly Hotel Palmira, includes a collection of archaeological pieces unearthed from a nearby shaft tomb. In addition to the archaeological pieces, the museum houses the Centre for Studies of the Mexican Revolution. Even non-Spanish speakers can gain insights into the turbulent and complex times that comprise the Mexican Revolution by looking at the extensive photographic exhibition on the museum’s first floor. The exhibition details the life and works not only of Lázaro Cárdenas but also of other key figures in twentieth century Mexican politics including General Francisco Múgica, who was in the group which proposed for inclusion in the Constitution of 1917 (still current today) Article 27, which encompassed agrarian reform and land redistribution, and Article 123 which dealt with the rights of workers, including an eight-hour day and guaranteed minimum wages. The museum in Jiquilpan is a fitting tribute to these much revered politicians.
Moving away from politics and towards the arts, Jiquilpan was the birthplace of artist Feliciano Béjar, who passed away in 2007, and received national acclaim for his inspiring sculptures, painting and weaving. Rafael Méndez, arguably the world’s greatest ever trumpet virtuoso, was born into a musical family in Jiquilpan and later moved to the USA. His legendary technique and tone have never been equaled. Jiquilpan hosted an international trumpet festival named for him in 2011.
Elsewhere in Jiquilpan are a statue of Christ on the Cross, said to date from the times of Emperor Charles V (now in San Francisco church), and a fountain sculpted by Francisco Eduardo Tresguerras, Mexico’s most famous nineteenth century sculptor and architect. This fountain was originally on the El Cabezón hacienda, owned by the Cañedo family, in Jalisco, but the family later gave it to Lázaro Cárdenas to beautify his native town. Known as “The Fisherman’s Fountain” (Pila de los Pescadores), it is a few blocks from the main plaza. Another, newer fountain on the plaza, “La Aguadora” (The Water Carrier), commemorates the first anniversary of the nationalization of the oil industry.
The ancient hieroglyph for Jiquilpan, from pre-Columbian times, is a horizontal line of earth with two indigo plants above it, linking the town to the color blue. One of Jiquilpan’s most famous poets, Ramón Martínez Ocaranza, also linked his birthplace to the color blue, christening it, “the city of jacarandas”, a tag that quickly caught on and is still used today. Anyone who drives through the town during jacaranda season (February–March) will certainly agree that the tall trees with their lavender-blue blossoms bordering the main avenues are a magnificent sight.
Note: This is a lightly edited excerpt from chapter 6 of my Western Mexico: A Traveler’s Treasury (Sombrero Books, 2013)
Related posts: