Early maps of Mexico

 Books and resources  Comments Off on Early maps of Mexico
Jun 152013
 

If you find maps, especially old maps, as fascinating as I do, you’ll enjoy reading the chapter on “Mesoamerican Cartography” (link is to pdf file) in the University of Chicago’s History of Cartography. In this wide-ranging chapter, author Dr. Barbara Mundy explores many aspects of Mesoamerican Cartography, from the different styles and materials used to the subtle changes that followed the arrival of the Spanish conquistadors in the sixteenth century.

The chapter has numerous illustrations of early maps, as well as an interesting diagram showing some of the regional and ethnic differences in the pictographs used to depict common geographic features such as hills, fields, sources of water and stones.

This image shows a page from the Codex Mendoza depicting the Aztec capital Tenochititlan.

Codex Mendoza

Codex Mendoza

The map, thought to have been painted in 1541, shows the founding of Tenochtitlan (by the Mexica) in 1325 (this date is shown by a symbol for a house crowned by two dots in the upper left hand corner). The glyphs around the edge of the map show the passage of time. The central illustration shows Tenochtitlan, dominated by a blue X, marking the four canals that divided the city both geographically and socially. Around the four quadrants sit the ten original founders of the city. Their leader, Tenoch, is seen immediately left of center. The hieroglyphic place-name for Tenochititlan, in the middle of the page, at the juncture of the canals, is a stone with a cactus growing out of it. (Description based on caption in History of Cartography).

On top of the cactus sits a bird of prey (popularly thought to be an eagle, but more probably a Crested Cara-Cara), the sign that the Mexica believed would tell them where to found their new city.

“Mesoamerican Cartography” is chapter 5 of Volume Two, Book Three (“Cartography in the Traditional African, American, Arctic, Australian, and Pacific Societies”) of the History of Cartography. The first volume of the History of Cartography was published in 1987 and the three books that constitute Volume Two appeared over the following eleven years. The University of Chicago Press website has links to a series of pdf files for the first three volumes of the History of Cartography (each chapter is a separate pdf).

Related posts:

Jun 082013
 

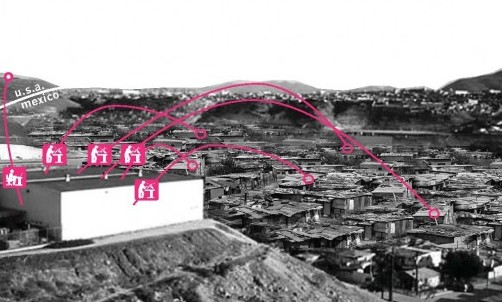
This 30 minute video (narrated in Spanish with English subtitles) looks at the vexed situation of Mexican workers that have been deported from the USA back into Mexico. About 200 migrants are deported daily. Almost all are male,. Many of them have lived for several years in the USA prior to deportation, and some have wives and families still living north of the border.

About 45% of all migrants from Mexico to the USA crossed the border between Tijuana and California. Since 1994 (Operation Gatekeeper) crossing the border has been made progressively more difficult. The border is now heavily protected with border guards given access to technology such as night-vision telescopes and a network of seismic monitors (to detect the minor ground movements that signal people walking or running through the desert). As the US economy ran into problems a few years ago, the flow of migrants north slowed down, even as authorities in the US launched more raids against undocumented workers, leading to an increase in the number of workers deported.

In the video, a range of stakeholders are given the chance to explain how they see the problems faced by deportees. A social anthropologist provides some background and academic insights; activists explain their position and how they seek to help deportees; several individual deportees share their experiences and invite us into their “homes”, precarious one-room shacks, some built partially underground, hobbit-like, in “El Bordo”, a section of the canalized channel of the Tijuana River that runs alongside the international border.

The garbage-strewn El Bordo has sometimes housed as many as 4,000 deportees. Mexican authorities are anxious to clean the area up and periodically bulldoze any shacks they find.

These personal stories of workers from interior states such as Puebla are harrowing. Many still seek “the dream” and openly admit they do not want to return to their families as a “defeated person”.

While parts of this video might have benefited from tighter editing, the accounts are thought-provoking and the video is an outstanding resource to use with classes considering the longer-term impacts of international migration.

There seems little doubt that a majority of the “residents” of El Bordo has a serious drug problem, and the video includes interviews about this issue with municipal police, deportees and aid workers, who discuss the problems and suggest some possible solutions, but ultimately, the city and state authorities have some tough decisions to make if they are to resolve this serious, and growing, humanitarian problem.

Related posts:

How does Mexico score on the Social Progress Index?

 Books and resources  Comments Off on How does Mexico score on the Social Progress Index?
May 302013
 

The Social Progress Index measures the extent to which countries provide for the social and environmental needs of their citizens. It is a compound index, based on  52 indicators in the areas of Basic Human Needs, Foundations of Wellbeing, and Opportunity that show relative performance in order to elevate the quality of discussion on national priorities and to guide social investment decisions.

Social progress is the capacity of a society to meet the basic human needs of its citizens, establish the building blocks that allow citizens and communities to enhance and sustain the quality of their lives, and create the conditions for all individuals to reach their full potential.

The model used to develop the index is based on asking three key questions that help define social progress:

  1. Does a country provide for its people’s most essential needs? (Basic Human Needs)
  2. Are the building blocks in place for individuals and communities to enhance and sustain wellbeing? (Foundations of Wellbeing)
  3. Is there opportunity for all individuals to reach their full potential? (Opportunity)

In this inaugural Social Progress Index, each of these dimensions is disaggregated into four components, each measured by between two and six specific indicators. Each indicator has been tested for internal validity and geographic availability:

Criteria used to compile Social Progress Index

Criteria used to compile Social Progress Index. Click image to enlarge.

For example the Personal Rights component of Opportunity is comprised of 5 separate variables:

  • Political Rights (Freedom House)
  • Freedom of Speech (CIRI Human Rights Data Project)
  • Freedom of Assembly/Association(CIRI Human Rights Data Project)
  • Private Property Rights (Heritage Foundation)
  • Women`s Property Rights (Economist Intelligence Unit)

How does Mexico score on the Social Progress Index?

Of issues covered by the Basic Human Needs Dimension, Mexico does best in areas including Nutrition and Basic Medical Care and has the greatest opportunity to improve human wellbeing by focusing more on Personal Safety. Of issues covered by the Foundations of Wellbeing Dimension, Mexico excels at providing building blocks for people’s lives such as Health and Wellness but would benefit from greater investment in Access to Information and Communications. Of issues covered by the Opportunity Dimension, Mexico outperforms in providing opportunities for people to improve their position in society and scores highly in Personal Rights yet falls short in Access to Higher Education.

This is how Mexico’s performance stacks up in comparison to the other 49 countries in the survey:

  • Social Progress Index: score 49.7 = rank 25th
  • Basic Human Needs: 49.3 (29th)
  • Foundations of Wellbeing: 50.8 (23rd)
  • Opportunity: 49.1 (25th)

This post is based on a press release from the Social Progress Imperative. For more information about the methodology behind the Social Progress Index, please refer to the inaugural report.

Related posts:

Striking photographs of Oaxaca by Cynthia Roderick

 Books and resources  Comments Off on Striking photographs of Oaxaca by Cynthia Roderick
Apr 162013
 

Cynthia Roderick is an award-winning photographer whose work has been widely published in major newspapers, magazines and TV news programs. However, I had not realized until recently that Roderick has a strong affection for Oaxaca. Several portfolios of work related to Oaxaca can be accessed via her website:

  • San Mateo Rio Hondo (40 images) San Mateo Río Hondo, a town and municipality in Oaxaca, is situated in the Miahuatlán District in the south of the Sierra Sur.
Credit: Copyright held by Cynthia Roderick

Credit: Copyright held by Cynthia Roderick

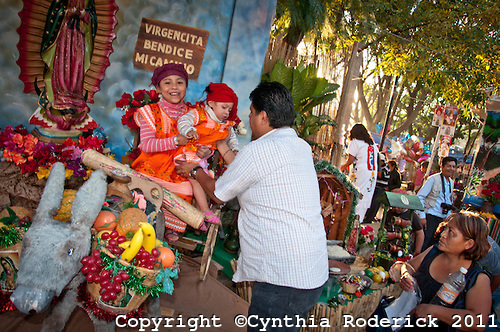
Festival Our Lady of Guadalupe – Image by Cynthia Roderick

Her informal images capture the personalities and sights of these events, warts and all. Roderick has a keen eye for subject matter, color and detail. Her fine photographs bring these events and the magic of Oaxaca to life for her viewers.

Related posts:

Mar 232013
 

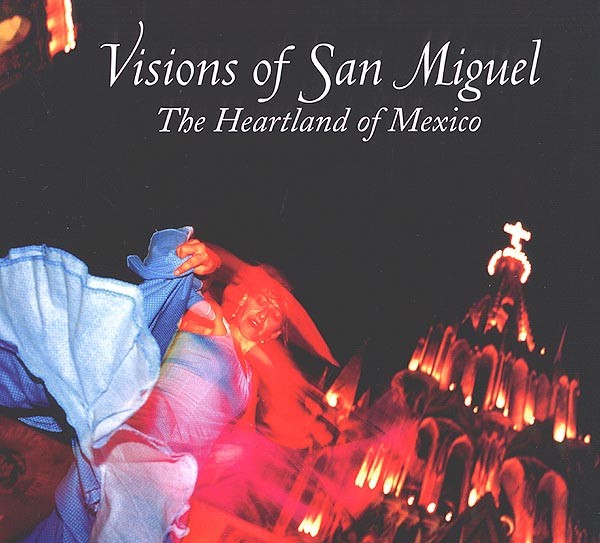
“Visions of San Miguel. The Heartland of Mexico”, a book about San Miguel de Allende in Guanajuato, portrays the city, its people and its fiestas, as seen through the lenses of thirty talented photographers. This visually exciting book is an ideal introduction to San Miguel de Allende for the armchair traveler, or a perfect memento for anyone who has visited this splendid city. All four sections of the book are of interest to geographers, not only because they provide a visual guide to many aspects of the city, but also because they reveal some of the reasons why San Miguel has become a popular retirement location for Americans and Canadians.

Geo-Mexico is reader-supported. Purchases made via links on our site may, at no cost to you, earn us an affiliate commission. Learn more.

smdcover

“Foundations of Greatness”, the first of four sections, opens with a wonderfully atmospheric untitled black-and-white photo (taken by Bill Begalke) showing the town center emerging from the overnight mist. A short selection of historical photos, some dating back to 1870, causes one to muse on just how far the city has progressed (in every way) since then.

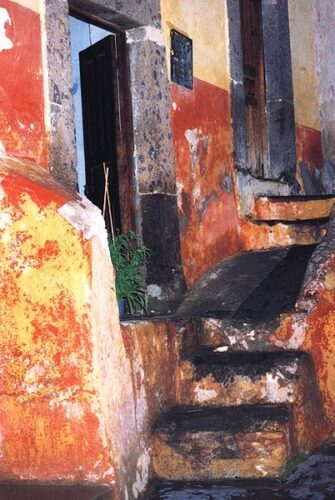
The second section, “Cobblestones of Color”, explores the textures and hues of San Miguel. Images range from the earthy tones and patina of an ancient doorway (Glenda Kapsalis), to the brilliant purple jacaranda trees in spring (Dixon Adams); from the elegant interior of the Casa Luna dining room (Douglas Steakley) to an open-air artist putting the finishing touches to a painting of Aldama Street (Atención). There’s a nice design touch here: the next page is a photo (Amanda Moulson) of the view enjoyed by the painter! Two photos (Chuck Jones) show important murals, whilst others show fascinating exteriors of colonial buildings. A fabulously evocative “abstract street scene” (Elsmarie Norby) captures the very essence of San Miguel for anyone who enjoys strolling the back streets, admiring the design, the architecture, the sense of color, the peeling walls.

smd26a

“Abstract street scene.” Photographer: Elsmarie Norby

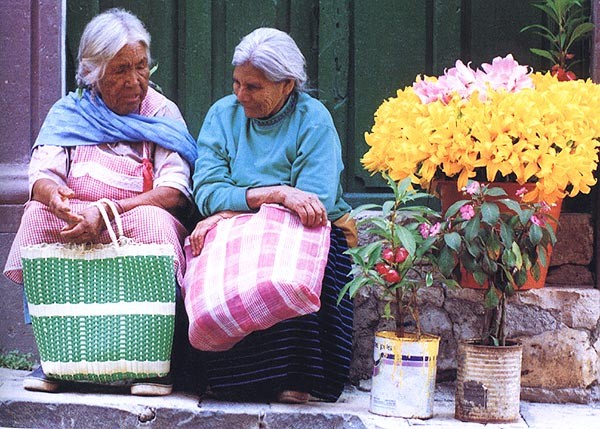
Several portraits enliven this section. A formal study of a “quinceañera” (Sondra Zell) at her coming-of-age party is next to a strong portrait of a particularly thoughtful older woman (Jill Genser). A sense of fun and humor pervades several of these photos. The children bathing in tubs at the public laundry (Don Wolf) are certainly enjoying themselves and it looks like the two young children asking a woman about a chicken (Ed Foley) might be about to take on more than they can handle! Don Eduardo, woodcarver and folk artist (Jennifer Haas) is apparently finding the whole business of having his photo taken an enormous joke, while deep in conversation, two flower vendors (Ned Brown) are seemingly oblivious to the photographer as they catch up on the latest news.

The third section, entitled “Fiestas, Fiestas and More Fiestas”, is by far the largest section of the book. Any thought of imbalance is quickly dispelled as an endless stream of fiestas is paraded past the reader. The selection begins with mid September’s Independence Day celebrations and the whirling fireworks of a castillo (Fred Edison). An action-packed street scene of the running of the bulls by the same photographer highlights the exuberant activities of the San Miguelada held the following weekend. This leads into colorful photos of the fiesta for the town’s patron saint at the end of September. A plumed Indian headdress (Ed Foley) suggests the richness of the costuming.

November’s Day of the Dead commemoration amongst the decorated gravestones is luminously captured in the photo “Mountain Light” (Galen Rowell). Colorful scenes from the Day of the Revolution and Christmas pageants follow, but the largest number of photos relate to the Easter celebrations when San Miguel re-enacts the Easter story along flower-carpeted streets. A photo of two elderly ladies in black lace under the cross is a classic portrait of piety (Sue Beere). The Fiesta section concludes with an informal study of the “Blessing of the cowboys and horses” (Richard Kriegler) and a stately photo of one of the world’s least likely events, the “Blessing of the taxis” (Peter Olwyler).

"Two flower vendors". Photographer: Ned Brown

“Two flower vendors”. Photographer: Ned Brown

The fourth section, “La Parroquia, Icon of the Heartland”, focuses on the Gothic Church of St Miguel which dominates the town landscape. Ancient and modern appear side by side: old drawings of the parish church followed by a variety of exterior and interior shots depicting the real thing as we see it today.

The quality of design (by Patricia Anne Tripp) and reproduction is extremely high. The book appears fault-free, barring a handful of missing accents on some Spanish words such as jardín.

This is a memorable book. The photos capture the essence of this vibrant, historic city, but go way beyond that by reminding us of so many uniquely-Mexican sights, sounds, events and personalities. A keeper!

Note: This is an edited version of a review first published on MexConnect.com as Visions of San Miguel. The Heartland of Mexico

Related posts:

The crater lake of Santa María del Oro yields evidence for climate change

 Books and resources  Comments Off on The crater lake of Santa María del Oro yields evidence for climate change
Feb 142013
 

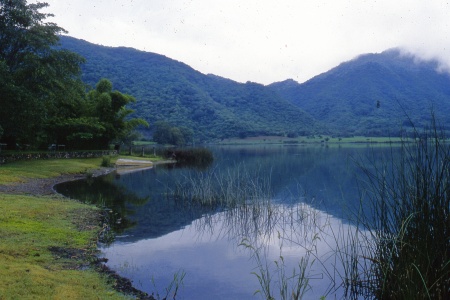
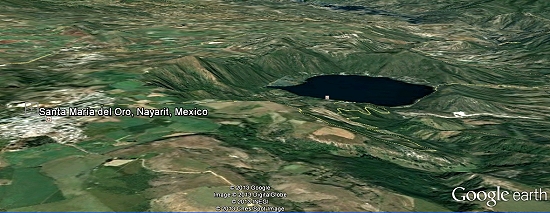
A magnificent crater lake nestles in a centuries-old volcanic crater a short distance east of the town of Santa María del Oro in Nayarit.

The connecting road from Highway 15 first passes through the former mining town of Santa María del Oro and then rises slightly to offer a splendid view of the beautiful slate-blue lake (known locally as “La Laguna”), set in a ring of verdant hills. In recent years, the lake, a good example of a geomorphosite, has become important for tourism with accommodations ranging from RV spaces to a boutique hotel. It takes about an hour and a half to stroll round the track that encircles the crater lake. Other attractions include visiting an abandoned gold mine (which offers a glimpse into the area’s past), birding, mountain biking, swimming or hiring a rowboat or kayak to venture out onto the lake.

Crater Lake, Santa María del Oro. Credit: Tony Burton

Crater Lake, Santa María del Oro. Credit: Tony Burton

This usually quiet lake has proved to be a valuable source of information for geologists and climatologists investigating the history of climate change in this region of Mexico.

The researchers who published their findings in 2010 in the Bulletin of the Mexican Geological Society extracted a sediment core from the deepest part of the lake. The relatively small area of the drainage basin surrounding the lake and the relatively steep slopes of surrounding hills mean that the sediments entering the lake are rarely disturbed after they are deposited. Wind and wave action are limited. The depth of the lake (maximum 65.5 meters) also helps to ensure that sediments remain undisturbed for centuries. This gives perfect conditions for a reliable sediment core.

Santa María del Oro. Credit: Google Earth

Santa María del Oro. Credit: Google Earth

The team analyzed the titanium, calcium and magnetism levels of successive thin slices of the core. By comparing the core with historic records and previous tree ring analyses from the same general area, they were able to accurately date each slice. The titanium levels in each slice allowed the researchers to quantify how much runoff occurred in that year, a proxy indicator of precipitation.

The team identified 21 significant drought events over a period of 700 years. The six most marked droughts occurred in 1365–1384, 1526, 1655-1670, 1818, 1900 and 1930-2000. They found periodicities of 25, 39, 50, 70 and 117 years for drought events, meaning that droughts occurred at fairly regular intervals of about 20-25 years.

The researchers then looked at the possible correlation between periods of drought and two distinct climatological factors: a shift to the south in the position of the Inter Tropical Convergence Zone (ITCZ) in summer and the occurrence of El Niño Southern Oscillation (ENSO) events. When the ITCZ does not extend as far north as usual during Mexico’s summer rainy season, states such as Nayarit and Jalisco receive less than their normal amount of rainfall. During ENSO events, rainfall is also diminished in central and western Mexico.

Of the 21 droughts identified and studied, 7 proved to be statistically linked to ENSO events, 10 to ITCZ movements, and the remaining 4 events were closely linked to a combination of both.

As the study concludes, titanium analysis of sediments may allow for a more refined record of climate change in the period prior to reliable historic or instrumental records which might improve the understanding of how and why climate change occurred in past

Santa María del Oro is also worth visiting because it is only a short distance away from the edge of the canyon of the River Santiago and the El Cajón hydro-electric power project, one of three major HEP projects located along that river.

Source article:

Susana Sosa-Nájera, Socorro Lozano-Garcí, Priyadarsi D. Roy and Margarita Caballero. Registro de sequías históricas en el occidente de México con base en el análisis elemntal de sedimentos lacustres: El caso del lago de Santa María del Oro. Boletín de la Sociedad Geológica Mexicana, Vol 62, #3, 2010, p 437-451.

Santa María del Oro and surrounding areas are described in chapter 24 of the recently published 4th (Kindle/Kobo) edition of my Western Mexico: A Traveler’s Treasury (Sombrero Books, 2013).

Related articles:

Cyclists retaking the streets of Guadalajara

 Books and resources, Mexico's geography in the Press  Comments Off on Cyclists retaking the streets of Guadalajara
Feb 022013
 

The popularity of cycling is growing rapidly in several Mexico cities. Mexico City has created bike lanes, an Ecobici system for short-distance hires, and holds numerous cycling events and rallies, designed to appeal to the whole family, not just to commuters.

Guadalajara, Mexico’s second largest city, now has a higher density of car use than Mexico City, according to “Over the Wheel—Mexico“, a documentary made recently for Aljazeera TV by Juan Pablo Rojas. Rojas, a native of the city, is a long-time film maker. He focuses his documentaries “on those sectors of society that are promoting new paradigms of life based on social equality, awareness, development, conservation and sustainability.”

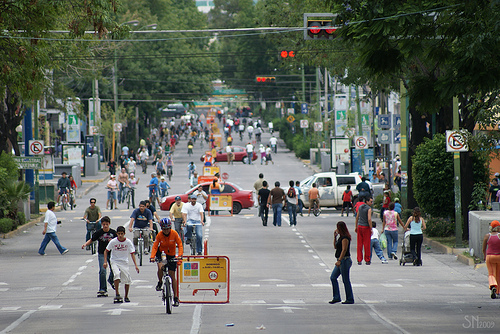
Via RecreActiva in Guadalajara. Photo by supernova.gdl.mx

Via RecreActiva in Guadalajara. Photo by supernova.gdl.mx

Over the Wheel—Mexico” takes a look at the growing cycling culture in Guadalajara, a city of some four million people and almost two million motor vehicles. It looks at the dedicated work of several committed groups of activists, such as GDL en bici [Guadalajara by bike],  who are striving to persuade car owners to change their habits and make the streets safer for alternative, cleaner corms of transport such as bicycles. Among other things, the activists have begun a “bicicleta blanca” movement in which white-painted bicycles are mounted as a memorial wherever a cyclist is killed in a traffic accident.

Can cyclists reclaim the streets of Guadalajara from cars? This 25-minute documentary, which has Spanish language commentary and English subtitles, looks at how a quiet revolution in sustainable urban transport is slowly unfolding in Guadalajara.

Further evidence of the growing popularity of cycling in Guadalajara is provided by the success of the weekly “Via RecreActiva” (see image). Every Sunday, city officials close over 65 km (40 mi) of city streets to motorized vehicles for six hours from 8 a.m. to 2 p.m. Up to 200,000 people take over the streets. Most are on bicycles, but others are walking, jogging, rollerblading or skateboarding.

Want to read more?

Related posts:

Street patterns in Mexico City

 Books and resources  Comments Off on Street patterns in Mexico City
Jan 102013
 

A recent post on Polis, “a collaborative blog about cities across the world”, focuses on the street patterns in Mexico City.

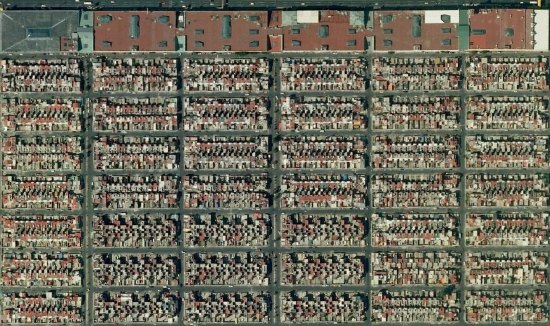
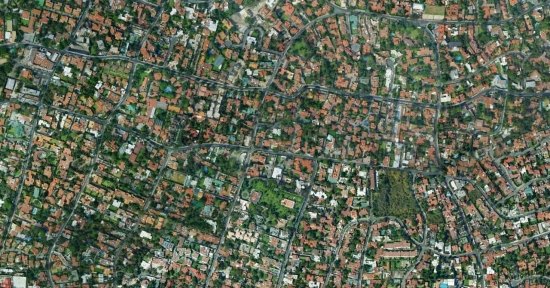
The post uses Google Earth images of different parts of the city to illustrate how street patterns vary between neighborhoods with different levels of wealth. This approach has long been used in urban geography, but the examples provided are a useful reminder of the value of “old-school” map interpretation skills, some of which are rapidly being lost in the age of online maps.

Mexico City Metropolitan Area: Fuentes de Aragón

Mexico City Metropolitan Area: Fuentes de Aragón

A simple exercise for students would be to ask them to choose two similar-sized cities, one in the USA and one in Mexico, and then use Google Maps and Google Earth images to compare their urban morphology (street patterns). It is worth comparing areas of different land uses (such as industrial, commercial, residential). The analysis should include some annotated images highlighting the key similarities and differences.

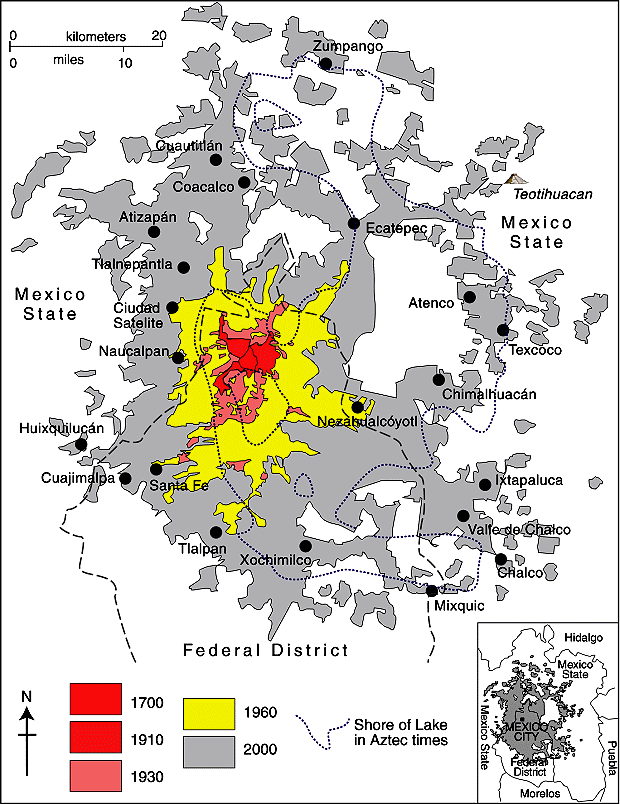
Mexico City Metropolitan Area (Geo-Mexico Fig 22.2; all rights reserved)

Spatial growth of Mexico City Metropolitan Area (Geo-Mexico Fig 22.2; all rights reserved)

The striking rectilinear lines usually found in poorer neighborhoods are in stark contrast to the curvilinear street patterns common in wealthier suburbs. In a city with a long history, like Mexico City, it is easy to locate and identify residential areas of very different age. (In general, the older residential areas are closer to the city center than newer residential areas.)

Mexico City: Pedregal San Angel

Mexico City: Pedregal San Angel

In the case of both Mexico City and Guadalajara (Mexico’s second largest city), a transect across the city from the wealthy west to the much poorer east will reveal remarkable differences in street patterns, corresponding closely to the patterns of wealth.

Related posts:


Mexico’s changing urban landscape: the rapid rise of low-income subdivisions

 Books and resources  Comments Off on Mexico’s changing urban landscape: the rapid rise of low-income subdivisions
Jan 052013
 

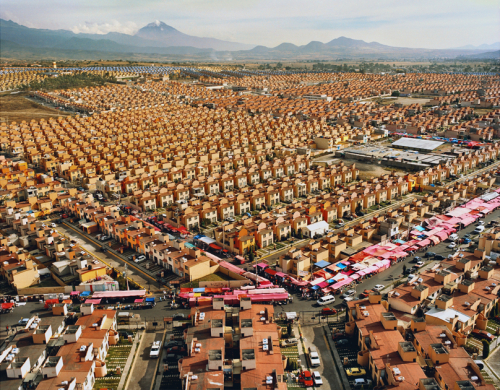
Between 2000 and 2006, more than 2.3 million new low-income INFONAVIT homes were built in Mexico, a staggering rate of 2,500 new homes each and every day. The achievement was documented by photographer Livia Corona, who divides her time between New York and Mexico City, in a four-year project entitled “Two Million Homes for Mexico”. The project focuses on the “surge of mass-scale neighborhood developments in Mexico, exploring their role in the ongoing transformation of the ecological, social and cultural landscape of the nation and its citizens.”

47,547 Homes. xtapaluca, Mexico.Credit: Livia Corona.

47,547 Homes. Ixtapaluca, Mexico.Credit: Livia Corona.

As Corona’s photos reveal, while most of the “cookie-cutter” housing developments lack public amenities (schools, clinics) and public spaces (parks), and have few commercial establishments, the people moving into these homes proved remarkably adaptable and creative.

In the photographer’s own words, “Through images, films, and interviews, I look for the space between promises and their fulfillment. In my photographs of multiple developments throughout the country, I consider the rapid redefinition of Mexican “small town” life and the sudden transformation of the Mexican ecological and social landscape. These urban developments mark a profound evolution in our way of inhabiting the world.”

Credit: Livia Corona.

Credit: Livia Corona.

As she explained in an interview with Nina Corvallo for the  now-retired Nymphoto blog:

“In my current role as a visual artist, I am often familiarizing with new geographies, both for research and for commissioned assignments. My work is drawn by the underlying structures affecting quotidian survival, and my photographs expand on how these manifest on a broader level.”

“In my current work, Two Million Homes for Mexico, my drive comes from the riddle of what living in these neighborhoods can do to the development of a social and creative expression. What are the manifestations of this experience on the young minds growing up in these insular and remote landscapes, as they draw from a singular cultural and socio-economic backdrop?”

“Developers provided infinite rows of identical 100 to 200 square feet homes. Dwellers are now faced with the task of turning the rows into streets and developments into cities. I am inspired by the inventiveness of people in these neighborhoods, who are adapting with a very hands-on approach—despite a limited infrastructure—to procure a more appropriate living environment. Mexicans, as other Latin Americans, are notoriously gifted in appropriating the built environment. My project both celebrates these small individual triumphs as it frames the challenges and abuses made in providing housing for an ever-expanding population.”

The powerful images of Livia Corona are a worthy resource for urban geography classes.

Related posts:

Mexico’s sixteenth century Geographic Accounts: the example of Jiquilpan, Michoacán

 Books and resources  Comments Off on Mexico’s sixteenth century Geographic Accounts: the example of Jiquilpan, Michoacán
Dec 272012
 

In a previous post, we introduced the Geographic Accounts, a rich source of information about Mexico’s sixteenth century geography. The style and substance of a typical Geographic Account can be judged by extracts from the response (dated 1579) relating to Jiquilpan (then written as Xiquilpan), in what is today the western part of the state of Michoacán in western Mexico. In the following (translated) extracts, square brackets enclose editorial comments, not found in the original.

Xiquilpan is in temperate land… A river, which never dries up, passes the village; it carries very little water in summer. In winter, it often rises so much that it can not be crossed. Less than one league from this village towards the north is a lake called Chapala, which is forty leagues around. A lot of white fish and catfish, and another kind of small fish, are caught in it. A large, very full, river, called Chicnahuatengo, enters this lake. [One league is about the distance that could be walked in an hour, from 4.18 kilometers to 6.687 kilometers, depending on the terrain.]

The village is settled on flat and very level ground, without hills…. It is very fertile land. It produces a lot of corn, chile, beans and other seeds that the natives sow. The native fruits are guamúchiles, avocados and guavas. There are lots of figs, pomegranates, quince trees and grapes. It is land where anything that is sown grows….

Xilquilpan has very few Indians: there could be in it about one hundred tributary Indians. They say that before the land was won, there were one thousand two hundred people. After the lands had been won, their number has been diminishing as a result of the many diseases that have occurred. In particular, in [15]76, there was a great plague in this village, common throughout New Spain, from which a large number of people died….

There is a wild plant in this village which cures those who are crippled. It has leaves like a lettuce and is so hot that the part where the root is put burns naturally, like a fire. There is another [plant], which has a root similar to camote: it is a preventative for everything. They cure with these herbs and with others that the natives know….

This village was subject, when it was heathen, to Cazonzi, king of Mechuacan, who ruled over and was in charge of it; on his behalf, he put an Indian chief called Noxti in this village in order to govern and look after them. At that time, they gave corn and chile as tribute to the said Cazonci, which was received by Noxti and sent to Pátzcuaro. At that time, they idolized the Devil, so that he would help them when they went to fight other Indians from neighboring villages. They say that when they caught an Indian, they carried him to a hill next to the village, and there they sacrificed him and offered him to the Devil, and they cut him open and removed his heart and those who had made the sacrifice ate it…

They wore some shawls of joined together sisal, like jackets, without anything else, and cotton breeches, different to what they now wear. Their food was tortillas, tamales, beans, and other wild herbs that they called quiletes [meaning edible herbs or greens in general] and they drank white maguey wine called tlachiquil [unfermented pulque]. They say that they used to live longer than now, and that the reason for this could not be ascertained…

In this village and its surrounding areas, grow pears, figs, pomegranates, grapes, peaches, quinces, nuts, apples, all Castillian [Spanish] fruits. Native [plants] are avocados, sweet canes, guavas, capulines (which are local cherries), squash, chile, tomatoes and a lot of corn. It is land where it does not snow, formerly or now. They raise many birds, both native and from Spain. They grow cabbages, lettuce, onions, radishes, blites, and every kind of vegetable from Spain. Wheat and barley grow in this village.

The animals that there are in the village are wolves, which breed in the swamps that surround some reed beds, a quarter of a league from the village. More than eighty thousand sheep come from other parts to pasture seasonally on the edge of this village each year; it is very good land for them and they fatten very well, since there are some saltpeter deposits in the marsh.

There are no salt beds in this village; the natives supply themselves with salt from Colima, twenty leagues from this village, and from the province called Avalos fifteen leagues away…

Xiquilpan has a monastery of monks of the Order of San Francisco; it has two clerics, one is the guardian. The founder was Brother Juan de San Miguel, and it was founded about forty years ago for all the clerics that were in this province of Mechuacan. The village has a hospital, where the sick are treated, which was begun thirty years ago and founded by a cleric called Brother Alonso de Pineda of the Order of San Francisco. It receives no rents: it is sustained only by the poor, from the alms they beg from the natives.

As can be seen, the Geographic Accounts are of immense value in reconstructing the past history of Mexico. The detail in them is often quite astonishing. However, as René Acuña emphasizes, while the Accounts provide invaluable information about local cultures, including that of the indigenous peoples, they should never be considered completely reliable. They were not eye-witness accounts and often relied on hearsay and on the possibly dubious interpretations made by a relatively limited number of respondents.

Source:

Several transcriptions of the Relaciones geográficas have been published in Spanish. The version used in preparing this article (translations by the author) is Acuña, R (ed) 1987 Relaciones geográficas del siglo XVI: Michoacán. Edición de René Acuña. Volume 9 of Relaciones geográficas del siglo XVI. Mexico City: Universidad Nacional Autónoma de México.

Note: This post is based on an article first published on MexConnect.com

Related posts:

The “Geographic Accounts”: Mexico’s sixteenth century “Domesday Book”

 Books and resources  Comments Off on The “Geographic Accounts”: Mexico’s sixteenth century “Domesday Book”
Dec 132012
 

Mexico’s equivalent of the Domesday Book was compiled in the sixteenth century.

Conquerors often have very little idea of precisely what they have acquired until their victory is assured. In many cases, one of their first post-conquest steps, therefore, is to undertake a comprehensive survey of everything of value, or potential value.

For instance, in 1086, William the Conqueror ordered a survey of his newly acquired England, the results of which were compiled into the Domesday Book. The decision to send out his assessors to every corner of the land was made at his Christmas Court in 1085. As a belated Christmas present to himself, William wanted to know “what or how much each landholder had, in land or livestock, and how much money it was worth”, so that he could tax it accordingly.

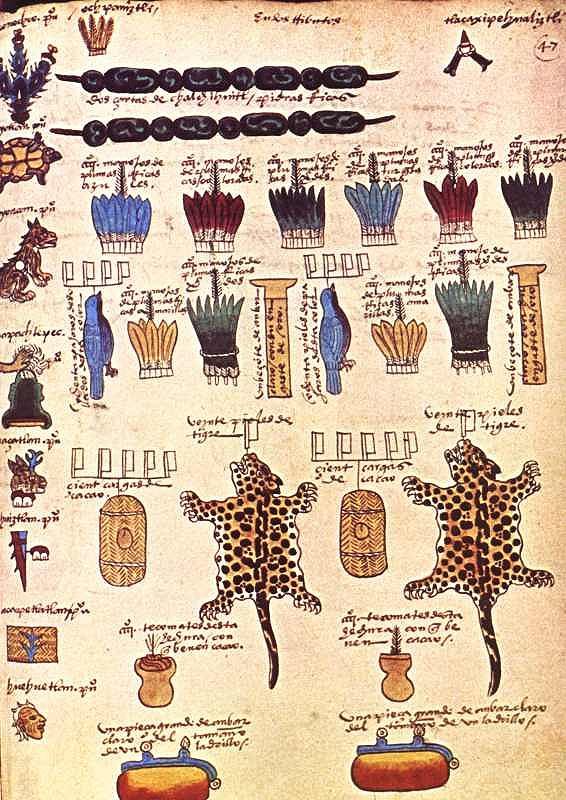
Though less comprehensive, a pictorial record of the wealth of Mexico already existed prior to the Spanish conquest. The Mexica people had gradually established an empire (the Aztec Empire) stretching from the Gulf coast to the Pacific. In order to administer the tributes due from each part of the empire, they recorded the requisite payments of feathers, animals, minerals and food, on bark paper codices. Some of these documents still survive, though most were destroyed by the Spanish. The image below is taken from the Codex Mendoza, which was created shortly after the conquest as a record of Aztec life, including the tributes payable by various villages and towns.

Tribute page from the Codex Mendoza

Tribute page from the Codex Mendoza

In this case, the tribute includes:

  • 2 strings of beads of jadeite, a green semi-precious stone
  • a total of 4000 handfuls of colored feathers
  • 160 skins of the bird with a blue plumage
  • 2 labrets (lip piercings) of amber encased in gold
  • 40 skins of jaguar
  • 200 loads of cacao beans, the main ingredient of chocolate
  • 800 tecomates (cups for drinking chocolate)
  • 2 slabs of clear amber, each approximately the size of a brick

Such tribute lists were of little interest to the Spanish when they arrived. Some of the items held in high esteem by the Aztecs were deemed worthless by the conquerors. Other items, such as silver, of little or no consequence to the Aztecs, were highly prized by the Spaniards.

Back in Spain, the Spanish Court was determined to acquire accurate information about everything being encountered in New Spain. This led to a series of censuses and accounts, including the Relaciones geográficas (Geographic Accounts), the earliest version of which dates back to the late sixteenth century.

In 1569, shortly after Juan de Ovando y Godoy was named Visitor of the Council of the Indies, he sent a questionnaire containing 37 questions to the New World. Another questionnaire, with about 200 questions, was sent in 1570. A few years later, perhaps in an effort to elicit more responses from the provinces, Ovando y Godoy’s former secretary and successor Juan López de Velasco reduced the number of questions to 50. These 50 questions, sent to New Spain in 1577, became the basis for the Geographic Accounts.

The authorities in each administrative center were instructed to call a meeting of the “Spaniards and other natives in the district”, to find out everything they could about the area’s geography, people and history.

Of the 191 known responses to the 1577 questionnaire, 167 have survived in archives to the present day. Most of the original responses are housed in Spain, in either the Archivo General de las Indias (Seville) or the Real Academia de la Historia (Madrid). A further 43 of them form part of the Benson Latin American Collection in the University of Texas library in Austin. The library’s webpage about the Relaciones geográficas has several links to images of sample pages and maps.

A future post will look at the content of a typical example of a “Geographic Account”.

Source:

Several transcriptions of the Relaciones geográficas have been published in Spanish. The version used in preparing this article is Acuña, R (ed) 1987 Relaciones geográficas del siglo XVI: Michoacán. Edición de René Acuña. Volume 9 of Relaciones geográficas del siglo XVI. Mexico City: Universidad Nacional Autónoma de México.

Note: This post is based on an article first published on MexConnect.com

Related posts:

Case study of a Tarahumara garden

 Books and resources  Comments Off on Case study of a Tarahumara garden
Sep 032012
 

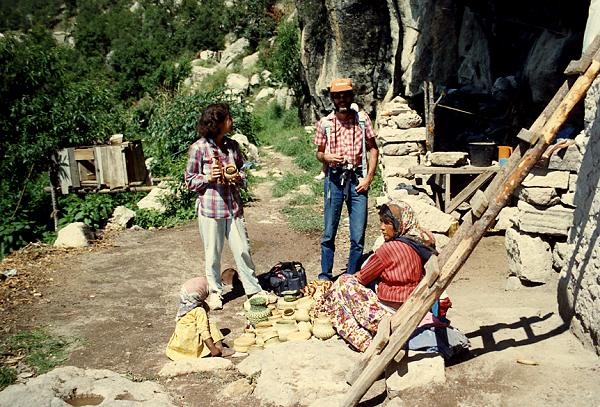
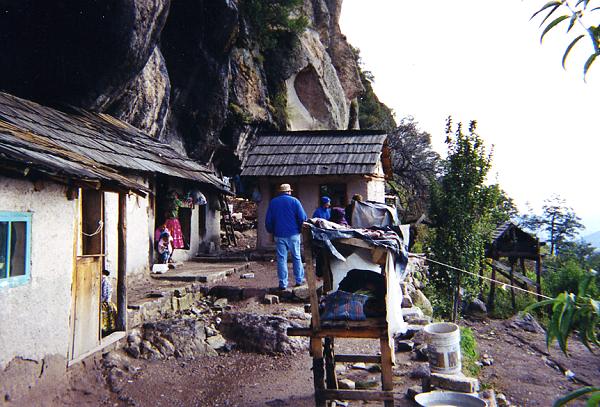
A cave dwelling known as  “Cueva del Chino” is located a short distance from the Posada Barrancas railway halt, very close to the present-day location of the Posada Barrancas Mirador hotel. When I first visited this cave, in the mid-1980s, I was struck by the obvious dangers of living so close to a precipitous drop. The cave is on a very narrow ledge, some 20 meters or so below the canyon rim. There is a local spring which acts as a water supply, though it is perhaps not always a reliable year-round supply. Outside the cave is a tangle of vegetation, much greener and more varied than elsewhere along the canyon wall. It was only on my second or third visit to this cave that I realized that this unruly vegetation was not only due to the nearby natural water source, but also due to the assiduous work of the cave’s residents. The tangled vegetation was actually a very productive garden, offering a variety of vegetables, fruit and herbs.

Accustomed, as most of us are, to the idea of crops and plants in neat orderly rows, the mini-jungle in the cave’s small garden-farm may come as a surprise. But there are sound ecological (and economic) advantages to maintaining, and even encouraging, this apparent disorder. Among the major advantages of mixed cropping (sowing several different crops more or less at random in an area) are the following:

  • (a) some plants are perennial, others annual; hence a ground-cover is maintained all year and the likelihood of soil erosion is diminished
  • (b) taller plants provide shade for shorter plants, offering distinct microclimates within the garden
  • (c) some plants (legumes) help fix nitrogen in the soil; other plants need the nitrogen
  • (d) a variety of plants means a much more varied diet
  • (e) since different crops use different nutrients, the total yield off a small plot is greater with a mix of crops than with a single crop
  • (f) if disease or insects strike one plant, they may not be able to spread to the next plant of that kind
  • (g) if one crop fails for any reason, another may succeed; this may be enough to ward off starvation for another year
  • (h) in terms of energy efficiency, this is a very efficient system, since it involves relatively little labor; the output of energy will exceed the input (see The energy efficiency of farming in Mexico and elsewhere for more details)

Put simply, who really wants to work harder than necessary?

Cueva del Chino, 1989.Copyright Geo-Mexico; all rights reserved.

Cueva del Chino, with “garden” on the left, 1989.Copyright Geo-Mexico; all rights reserved.

Cueva del Chino, 2003.Copyright Geo-Mexico; all rights reserved.

Cueva del Chino, 2003 [from the opposite angle]. Copyright Geo-Mexico; all rights reserved.

The photos show the truly astonishing changes that took place in this cave dwelling and garden between 1989 and 2003. The major change in the area between those years was the construction of the Posada Barrancas Mirador, only a few steps away from the path leading down to the cave. This has led to a steady trickle of visitors who buy the locally-made pine needle basketwork (top photo) or leave behind a few pesos.

Are these changes really for the better? There are arguments on both sides, and I’m honestly not entirely sure. I haven’t been back for several years, but would welcome an update (and photo) from any Geo-Mexico reader who happens to visit.

Related posts:


Aug 302012
 

Veteran blogger Matt Osborne has unearthed a real gem! This 1977 BBC documentary was the tenth episode of The Age of Uncertainty, John Kenneth Galbraith’s history of economic thought. In this episode, Galbraith examines the economics of poverty and inequality.

The section of greatest interest to Geo-Mexico readers is his overview of the changing relationships between land and people in Mexico from precolonial times to the 1970s. [This ten minute segment starts at minute 4:33 of the video].

Galbraith does confuse his Teotihuacanos with his Aztecs, and clearly many things have changed since 1977, but this video is a great and straightforward introduction to the complex issues of land resources and population, suitable as the starting point for many discussions at high school or college level about land clearance, the financing of land improvement, the Green Revolution, population growth and social organization.

Related posts:

Interactive graph of changes in GDP/person and life expectancy in Mexico since 1800

 Books and resources, Teaching ideas  Comments Off on Interactive graph of changes in GDP/person and life expectancy in Mexico since 1800
Aug 252012
 

Gapminder is a wonderful resource for an overview of all manner of things geographic. The link below will take a few minutes to load, but should then show how Mexico’s GDP/person (on a purchasing power parity basis) and life expectancy have changed since 1800. The size of the yellow circle for each year is proportional to Mexico’s total population, with a scale that can be user-modified at the bottom right of the graph. Hover your mouse over a circle for the year to be identified.

The early figures for GDP/person are unlikely to be very reliable, but once we reach the 20th century, the figures are based on better assumptions and data. After falls in GDP/person and life expectancy in the early stages of the Mexican Revolution (which began in 1910), both variables increased steadily until about 1926. While life expectancy has continued to rise since then, with the occasional dip, GDP/person shows some obvious “blips” such as the early 1950s when it fell quite sharply.

It is interesting to play with the chart and look at how GDP/person and life expectancy have changed for other countries.

To do this:

  1. Select one or more countries by clicking on them [each country is identified when your mouse hovers over it]
  2. Use the slider at the bottom of the chart to select the time period of interest
  3. Sit back and prepare to get engrossed in the world of Gapminder!

Mexico City tackles the challenges of population, commuting and air quality

 Books and resources  Comments Off on Mexico City tackles the challenges of population, commuting and air quality
Aug 232012
 

This short (3 minute) video is a promotional video produced by Mexico City administrators in 2010. It refers only to the Federal District (México D.F.), and not to the entire Mexico City Metropolitan Area (which also includes parts of adjoining states).

The video highlights some of the challenges facing Mexico City’s decision makers. It uses some slick graphics to provide some of the basic facts and figures about area, population, daily commuter flows, improvements in public transportation, reductions in emissions, and so on.

Perhaps the most startling of the statistics given in the video is that the average daily travel time for Mexico City workers, including the several million who commute into the city from the surrounding states, is about three hours. This is a truly staggering amount of time compared to average commutes for most other major cities around the world.

For example, the average commute is 80 minutes a day round trip in Toronto, 68 minutes in New York, 56 minutes in Los Angeles, and 48 minutes in Barcelona. On the other hand, Moscow commuters apparently have even slower journeys to work than Mexico City residents.

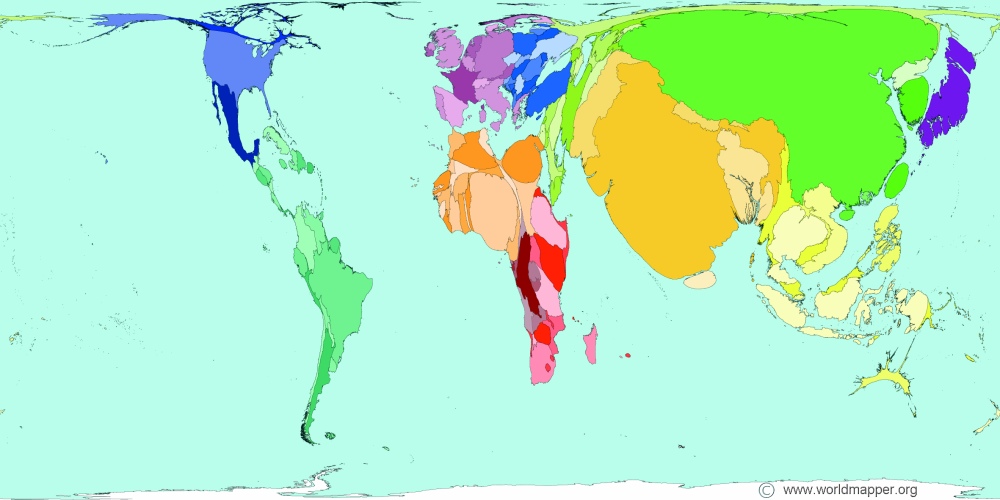
World Commuting Times. © Copyright SASI Group (University of Sheffield) and Mark Newman (University of Michigan)

World Commuting Times. Click to enlarge. © Copyright SASI Group (University of Sheffield) and Mark Newman (University of Michigan); used under Creative Commons License

The size of each country on the topological map above, from Worldmapper, is proportional to the total commuting time for that country. To quote Worldmapper: “Commuting time is a measure of how long people spend travelling to work, by whatever means. It could be by foot, bus, car, boat, train, bicycle or other means. The world average commuting time is 40 minutes, oneway. This is the average for people that work.”

Total commuting time is influenced by each country’s total population, but a whole host of other factors also play a part in determining the time required for workers to travel from their place of resident to their place of work. These factors include the available means of transport, transport links, wealth, land use zoning, type of occupation, city size, and so on.

Related posts:

Jun 042012
 

A previous post—How “complex” is the Mexican economy?—discussed The Atlas of Economic Complexity and noted that Mexico’s Economic Complexity Index (ECI) of 1.145 ranked it 20th among 128 countries. ECI indicates a wide range of complex knowledge capabilities related to productive enterprises. Mexico has a very high ECI given its income level; all other countries in the top 20 have significantly higher incomes than Mexico.

According to the Atlas, during the rest of the decade Mexico’s GDP should grow relatively rapidly to catch up with its ECI. Analyses in the Atlas indicate that during the last few decades countries with higher than expected ECIs compared to their income levels experience more rapid economic growth. While this relationship is empirically true, it should be noted that it does not explicitly include other factors thought to be important to economic growth (see Section 4 of the Atlas). Some of these other factors are governance and institutional quality, corruption, political stability, measures of human capital and competitiveness indicators. The Atlas implies that these other factors contribute to and thus are indirectly part of the Economic Complexity Index.

The analysis in the Atlas predicts that Mexico’s annual growth in real per capita GDP will be 3.5% from 2009 to 2020, ranking it 10th in the world in growth rate (see table). (The growth rates for some other countries are given in footnote 1 below.)  Mexico’s annual growth in real per capita GDP is impressive given that its growth was only 0.8% per year for 1999 to 2009, the same as that for the USA. Growth in these two countries was slowed significantly during this period as a result of the very severe recession, the worst since the great depression. This rather slow growth is surprising given that Mexico’s ECI increased from 1998 to 2008 was ranked 30th worldwide. Though the Mexican economy suffered significantly during this period, it continued to develop new productive capabilities and become more complex. This added complexity is expected to generate accelerated economic growth in the current decade.

RankCountry% growth in GDP/person, 1999-2009Expected % growth in GDP/person, 2009-2020, Income/person, 2009Expected income/person, 2020
1China9.64.33,7445,962
2India5.64.31,1921,886
3Thailand3.14.03,8936,023
4Belarus7.94.05,0757,806
5Moldova4.84.01,5162,321
6Zimbabwe449.03.8 - 6.2676?
7Ukraine5.23.72,4683,694
8Bosnia-Herzegovina4.13.64,5256,669
9Panama3.93.67,15510,529
10MEXICO0.83.58,14311,894

The low growth rate of 0.8% per year for 1999 to 2009 represents “real” per capita growth corrected for inflation and population growth. In nominal terms, Mexico’s total GDP growth from 1998 to 2008 was 1.8% per year. It is expected to grow 4.8% per year for 2009 to 2020, which ranks its 22nd in the world, behind numerous poor African countries with rapidly growing populations. Of large or populous world countries, the only ones ranked ahead of Mexico are India (ranked 8th), the Philippines (12th), Egypt (14th), Pakistan (18th) and China (20th).

In summary, the Atlas of Economic Complexity predicts that the Mexican economy will grow very rapidly during the rest of this decade and beyond. Let’s hope that this prediction becomes a reality.

Footnote 1:

For comparison: Indonesia ranked 21st at 3.3%, Pakistan 27th at 3.1%, Guatemala 35th at 3.0%, South Africa 41st at 2.9%, Turkey 43rd at 2.8%, Brazil 48th at 2.7%, Argentina 54th at 2.6%, Russia 59th at 2.6%, USA 91st at 2.0%, Canada 104th at 1.7% and Nigeria 118th at 1.1%.

Source:

Ricardo Hausmann, Cesar Hidalgo, et. al. “The Atlas of Economic Complexity“, The Observatory of Economic Complexity (Harvard HKS/CDI – MIT Media Lab). Retrieved 19 May 2012.

May 282012
 

In his classic book, The Wealth of Nations, Adam Smith proposed that division of labor and economic specialization were the keys to increases in productivity and the wealth of nations. While Smith was primarily talking about the degree of specialization within nations, specialization among nations and comparative advantage were also important. Obviously, in the 21st century there is specialization within and among all nations, but some are more specialized or more complex than others. But how can economic complexity be measured?

Fortunately this question is addressed head-on by Ricardo Hausmann, Cesar Hidalgo and their co-researchers in The Atlas of Economic Complexity (Harvard HKS/CDI – MIT Media Lab, 2011). They argue that highly complex economies produce sophisticated products that require a very wide and diverse set of knowledge capabilities. Very few countries have the capabilities to produce such sophisticated products which might include the very specialized equipment and very precise measuring instruments needed to produce highly complex chemicals or pharmaceuticals. Other examples might include the range of knowledge capabilities needed to build a nuclear power plant or space station. Obviously very few nations with very complex economies have these capabilities.

At the other end, a very large number of countries with less complex economies have the range of capabilities needed to produce simple products like basic foods, mineral ores, lumber, garments, shoes, glass, kitchen utensils, candles and furniture.

In producing an atlas that covered a large number of countries, the authors were limited by the availability of data. They decided to use information on exports because the data were available and the range of exports reveal the complexity of an economy. Unfortunately, accurate data are only available on the trade of physical products; they are not available for services which are the dominant sector for modern economies. On the other hand, the sophistication of product exports does a good job of capturing the complexity of economies.

In developing their Economic Complexity Index or ECI, the authors developed a product complexity index based on the number of countries capable of making and exporting specific products as well as the diversity of products exported by specific countries. The Atlas presents ECIs for the 128 countries that had reliable data, populations over 1.2 million and trade over $1 billion.

RankCountryEconomic Complexity IndexIncome/person (2009 US$)
1Japan2.31639,738
2Germany1.98540,670
3Switzerland1.93563,629
4Sweden1.85943,654
5Austria1.80745,562
6Finland1.71544,581
7Singapore1.63936,537
8Czech Republic1.62818,139
9U.K.1.55835,165
10Slovenia1.52323,726
11France1.47341,051
12South Korea1.46917,078
13USA1.44745,989
14Hungary1.43012,868
15Slovak Republic1.37916,176
16Italy1.30835,084
17Denmark1.26755,992
18Ireland1.23151,049
19Israel1.16426,256
20MEXICO1.1458,143

The 20 countries with the highest Economic Complexity Indices are presented in the table, along with their 2009 per capita income. Japan is clearly the most complex economy followed by Germany, Switzerland, Sweden and Austria. The USA is ranked 13th and Canada is 41st. Fourteen of the top 20 countries are European; most are high income, highly industrialized countries. Countries with large natural resource exports tend to rank low in economic complexity. Norway is 33rd, Russia 46th, New Zealand 48th, Brazil 52nd, Saudi Arabia 68th, Australia 79th.

Mexico is ranked 20th which is very impressive since all others in the top 20 have significantly higher incomes. Mexico does very well compared to other large emerging economies: China is 29th; Turkey is 43rd, Russia is 46th, India is 51st, Brazil is 52nd, South Africa is 55th, Argentina is 57th and Indonesia is 61st. Mexico’s economic complexity has grown significantly in the past 50 years. It grew from 0.39 in 1964 to 1.14 in 2008; this increase ranked it 14th of 99 countries. (Countries improving faster than Mexico include: Thailand 2nd, Indonesia 5th, Brazil 7th, and Turkey 10th.) Over 60% of Mexico’s growth occurred between 1998 and 2008 when its ECI jumped from 0.80 to 1.14.

The Atlas argues that countries such as Mexico, with high levels of complexity given their income level, are expected to grow more rapidly in future years. We will explore this topic further in a future post.

Related posts:


Net migration flow from Mexico to the USA falls close to zero or has possibly reversed

 Books and resources, Updates to Geo-Mexico  Comments Off on Net migration flow from Mexico to the USA falls close to zero or has possibly reversed
Apr 262012
 

The following are extracts from the text of a press release from the Pew Hispanic Center entitled “Net Migration from Mexico Falls to Zero—and Perhaps Less“, by Jeffrey Passel, D’Vera Cohn and Ana Gonzalez-Barrera:

The largest wave of immigration in history from a single country to the United States has come to a standstill. After four decades that brought 12 million current immigrants—more than half of whom came illegally—the net migration flow from Mexico to the United States has stopped—and may have reversed, according to a new analysis by the Pew Hispanic Center of multiple government data sets from both countries. The report is based on the Center’s analysis of data from five different Mexican government sources and four U.S. government sources. [see original article for sources]

The standstill appears to be the result of many factors, including the weakened U.S. job and housing construction markets, heightened border enforcement, a rise in deportations, the growing dangers associated with illegal border crossings, the long-term decline in Mexico’s birth rates and changing economic conditions in Mexico.

Among the report’s key findings:

  • In the five-year period from 2005 to 2010, about 1.4 million Mexicans immigrated to the United States and about 1.4 million Mexican immigrants and their U.S.-born children moved from the United States to Mexico.
  • In the five-year period a decade earlier (1995 to 2000), about 3 million Mexicans had immigrated to the U.S. and fewer than 700,000 Mexicans and their U.S. born-children had moved from the U.S. to Mexico.
  • This sharp downward trend in net migration has led to the first significant decrease in at least two decades in the number of unauthorized Mexican immigrants living in the U.S.—to 6.1 million in 2011, down from a peak of nearly 7 million in 2007.
  • Mexicans now comprise about 58% of the unauthorized immigrants living in the United States. They also account for 30% of all U.S. immigrants.
  • Apprehensions of Mexicans trying to cross the border illegally have plummeted by more than 70% in recent years, from more than 1 million in 2005 to 286,000 in 2011—a likely indication that fewer unauthorized immigrants are trying to cross.
  • As apprehensions at the border have declined, deportations of unauthorized Mexican immigrants—some of them picked up at work or after being arrested for other criminal violations—have risen to record levels. In 2010, nearly 400,000 unauthorized immigrants—73% of them Mexicans—were deported by U.S. authorities.
  • Looking back over the entire span of U.S. history, no country has ever sent as many immigrants to this country as Mexico has in the past four decades. However, when measured not in absolute numbers but as a share of the immigrant population at the time, immigration waves from Germany and Ireland in the late 19th century equaled or exceeded the modern wave from Mexico.

– – – end of quotations from press release – – –

Related posts:

Suburbia in Mexico: Alejandro Cartagena’s images of Monterrey

 Books and resources  Comments Off on Suburbia in Mexico: Alejandro Cartagena’s images of Monterrey
Mar 242012
 

What do Mexican suburbs look like? What is their function? As the country’s towns and cities continue to expand, new suburbs appear on their outer edge. Some are gated communities, generally aimed at high income families; these suburbs sometimes include private schools and sports clubs. Other suburbs offer smaller homes aimed at low-income families.

Photographer Alejandro Cartagena lives in the Monterrey Metropolitan Area, which includes nine different municipalities in the state of Nuevo León: Monterrey, Guadalupe, San Nicolás, San Pedro, Santa Catarina, Escobedo, Apodaca, García and Juárez.

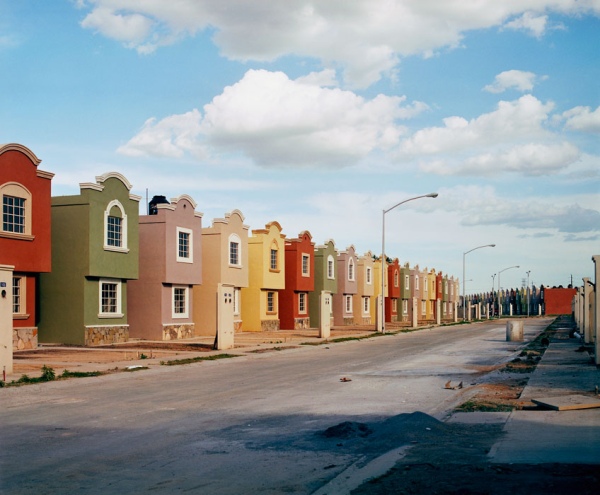
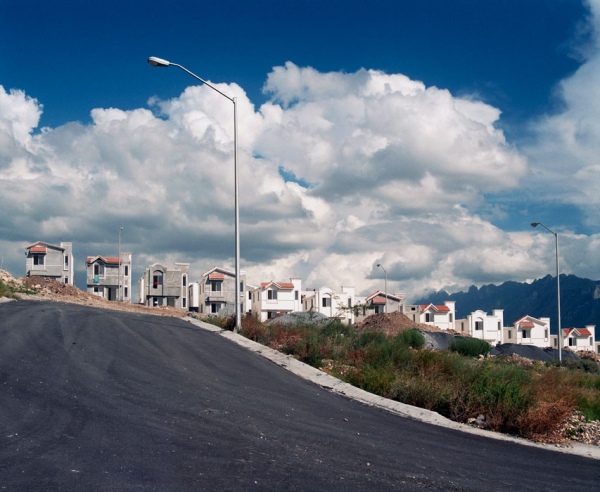
Cartagena spent years exploring the edge of the city to document the manifestations of “suburbia mexicana” through photographs. The suburbs he depicts are mainly low-income suburbs, some still being constructed. Cartagena recognized that change was happening at a very rapid pace, and often by developers with more lust for profit than desire to improve the local community. Since 2001, more than 300,000 new homes have been built in the Monterrey Metropolitan Area. Many suburbs were badly planned, as some of Cartagena’s photos clearly reveal. Considerations of roads, parks and public transport are often ignored in the decision-making of these developers.

Copyright: Alejandro Cartagena; all rights reserved. Image from "suburbia mexicana"; reproduced by kind permission.

Copyright: Alejandro Cartagena. Image from "suburbia mexicana". Reproduced by kind permission.

“Suburbia mexicana” includes five series of images, each briefly described below. For fuller descriptions of Cartagena’s ideas, please use the links from the title of each series to visit his relevant section of his website:

Fragmented Cities explores what the homes look like, as if being photographed for a real estate brochure.

Lost Rivers looks at the “environmental problems that stem from excessive urban and suburban development such as dried up and polluted rivers and streams.”

The Other Distance attempts to “connect the wealthy with the new-middle and low class urbanization models” by looking at San Pedro Garza García, which is one of the richest municipalities in Mexico, and easily the wealthiest part of the Monterrey Metro Area. Quoting geographer David Harvey on the “inter-connectivity between urbanization and capital accumulation”, Cartagena explores the economic contrasts that have created two distinct spaces (based on wealth), one that lacks specific “social cohesion space” such as parks, not designed to take into account “infrastructure, hospitals or education centers”, and one occupied by the wealthy sectors of society where such things are considered their “right”. Cartagena recognizes that both these spaces have an interdependent symbiotic relationship.

Copyright: Alejandro Cartagena; all rights reserved. Image from "suburbia mexicana"; reproduced by kind permission.

Copyright: Alejandro Cartagena. Image from "suburbia mexicana". Reproduced by kind permission.

Urban Holes depicts abandoned spaces in downtown Monterrey, so “highly overpriced by market speculation” that “investors look to un-urbanized land to create new developments that are lacking all kinds of infrastructure”.

The People of Suburbia, the final section, is based on a return to some of the areas photographed previously, including the municipality of Juárez, where urbanization has led to the population tripling since 2002. It is a “visual study of the unending capitalist endeavor of urban growth”.

In Cartagena’s own words, the photos of “suburbia mexicana” “depict a global issue from a local perspective” and one his intentions is “to point out the struggle our contemporary world faces between the ideals of capitalism and the striving and desire for fairer and more equal cities in which to live.” As such, this splendid collection of photographs certainly deserves the widest possible audience.

If you like Alejandro Cartagena’s work, you may like to know that he has published a book of “suburbia mexicana”, available via his website.

For more details about the Monterrey Metropolitan Area, see this 2008 paper by Dr. Peter Ward:

Mexico’s crime statistics: fishing for the facts

 Books and resources  Comments Off on Mexico’s crime statistics: fishing for the facts
Feb 152012
 

Diego Valle-Jones’s blog, “Food and Fishing“, is actually more about Mexican crime rates than food and fishing! The blog, described by the author as “mainly about data analysis, programming and statistics, with the occasional interspersed post about food” has numerous posts analyzing the drug war in Mexico. These posts focus partly on geographic patterns of where most activity has occurred but mainly on the quality of the data available and its many deficiencies.

Valle-Jones’ analysis of drug war data is especially enlightening for anyone not familiar with the vagueries of crime-related data in Mexico. Most of his posts are illustrated by well-conceived and well-executed graphics, worthy of close examination in their own right. Posts in the past twelve months on “Food and Fishing” have included:

All are worth reading. It is unfortunate that, unlike Valle-Jones, so many mainstream  journalists have simply repeated facts and figures without any real understanding of where they came from, or what their strengths and weaknesses might be. Food and fishing?  Fishing among the statistics should give them food for thought…

Mapping remittance flows to Mexico, a practical exercise

 Books and resources, Teaching ideas  Comments Off on Mapping remittance flows to Mexico, a practical exercise
Jan 262012
 

Looking for a practical exercise about migration and remittance flows to challenge your students?

Remittances (the funds sent by migrant workers back to their families) are a major international financial flow into Mexico. Remittances bring more than 20 billion dollars a year into the economy, an amount equivalent to 2.5% of Mexico’s GDP. On a per person basis, Mexico receives more worker remittances than any other major country in the world. An estimated 20% of Mexican residents regularly receive some financial support from relatives working abroad. Such remittances are the mainstay of the economies of many Mexican families, especially in rural areas of Durango, Zacatecas, Guanajuato, Jalisco and Michoacán.

Two data tables [see link]  included in the World Bank Working Paper by Raúl Hernández-Coss, referred to in several previous posts, offer an ideal starting-point for practical mapping and analysis exercises for students. (The data is from 2004 but we are more interested in general patterns than precise values). The data tables are here:

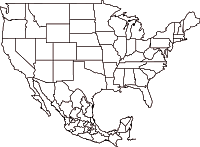
A ready-made printable base map, showing the state boundaries of Mexico and USA, can be found here:

Suggested mapping exercises:

1. Which US areas have most Mexican migrants?

Use Column 2 (Mexican nationals living in this jurisdiction) of Table VI.A.1 and draw proportional circles on a base map to show which areas have most migrants. [To draw circles where the area of each circle is in direct proportion to the number of Mexican nationals, the first step is to calculate the square root of each number. These square roots are then used as the basis for working out the diameter (or radius) of the circle you draw for each location. The area of each circle is then proportional to the number of migrants. Remember to choose the most appropriate scale for the circles, so that it is easy to compare places. (If you draw very small circles, or super-large circles, they will be difficult to compare!)

2. Which US areas send the highest value of remittances back to Mexico?

Use column 4 of Table VI.A.1 to show the value of total “annual remittance flows” on a base map. You may be able to superimpose this information on the same base map you drew for Q1 which would make it very easy to see if the areas with most Mexican nationals send the most remittances back to Mexico each year. Can you see any anomalies on your map, either where an area sends far more remittances back than might be expected from the number of migrants, or where an area sends only a small value of remittances back despite having a very large number of Mexican nationals?

3. How does the “average remittance” (column 5 of Table VI.A.1 vary?

Use the available figures to see if you can identify any pattern to which areas send relatively large remittance payments, and which send much smaller average payments.

4. Where do all the remittance payments go?

Level One: Use the information from Table VI.A.2 to draw a map with arrows showing the largest single flows from each area in the USA to their corresponding state in Mexico.

Level Two: Work out the dollar value of the main remittance flows, by using the % figures given for some areas in Table VI.A.2 and their corresponding total annual remittance values from Table VI.A.1. (eg the value of the Los Angeles to Jalisco flow is 26% of $7,886.3 million). Then map the ten largest flows using flowlines (arrows where the width of each arrow is proportional to the value of remittances).

Look at the map or maps created and see if you can identify any patterns. If you can describe a pattern, then also look to see if you can find any anomalies, and try to explain your findings.

Related posts:

How might the USA adjust to “narco-refugees” from Mexico?

 Books and resources  Comments Off on How might the USA adjust to “narco-refugees” from Mexico?
Jan 072012
 

The impacts of Mexico’s “War on Drugs” in recent years have been apparent in many parts of the country, particularly in the Mexico-USA border region. Apart from the obvious and well-documented increased levels of violence in several northern border states, we have looked briefly in a previous post at how some businesses closed their factories or offices in northern Mexico and relocated to the relative safety of Mexico City and central Mexico. Individuals living in the areas where drug-related violence has increased have also had tough choices to make, and many families have chosen to move, either to other areas of Mexico or to the USA or Canada.

Canada recorded a sharp spike in the number of Mexicans entering the country and claiming asylum on the grounds that their lives were in danger if they returned to Mexico. The number rose from 2,550 in 2005 to 9,309 in 2009, with about 10% being accepted as legitimate claims. Canada’s response to the sudden increase in applicants was to impose strict visa restrictions which made it far harder for Mexicans to enter Canada legally. The changes led to an 80% drop in the number of Mexicans applying for asylum in 2010.

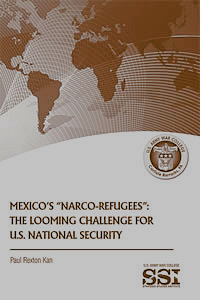
Several US border cities have also experienced an influx of Mexican migrants. In Mexico’s “Narco-Refugees”: The Looming Challenge for U.S. National Security, Dr. Paul Kan, Associate Professor of National Security Studies and the holder of the Henry L. Stimson Chair of Military Studies at the U.S. Army War College, looks at how Mexican “narco-refugees” (who leave Mexico “unwillingly”) could influence US policymakers and force them to reconsider national security priorities.

Dr. Kan considers three alternative scenarios, which, he argues, “would force the narco-refugee issue onto the [US] national policy-making agenda”:

  • 1. the “new normal”, in which drug-related violence in the USA and Mexico becomes “a fact of life in relations between the two countries”, as drug gang and cartel activities spread into the USA along the corridors used to transport drugs.
  • 2. an “accidental narco” syndrome developing in Mexico, in which the Mexican government, in order to demonstrate its commitment towards lowering cartel violence,  may collude with one or more smaller cartels to help gain intelligence about the larger, more violent cartels prior to clamping down on them. Such a policy could lead to a sharp increase in the number of narco-refugees, as the core areas of stronger cartels see increasing violence as the cartels fight for survival.
  • 3. the emergence of a “Zeta state.” In this third scenario, a kind of “parallel state” emerges, in which private security firms play a much larger part as wealthy Mexicans seek to protect themselves, relying on their own resources, rather than on the government’s law and order or security forces.

As Dr. Kan emphasizes, these three scenarios are not mutually exclusive, and could coexist in different areas of the country simultaneously. Equally, some parts of the country might escape the effects of all three of the scenarios he analyzes.

Kan repeats anecdotal and other evidence which suggests that “narco-refugees” are becoming an important trend, with serious consequences for Mexico’s economy. For example, “One young Mexican executive at cement giant Cemex SAB, which has headquarters in Monterrey, said he can count at least 20 different families from his circle of friends who have left—nearly all of them for nearby Texas.” Reduced US investment in Mexico is not a good sign. According to the US Chamber of Commerce in Mexico, 25% of its members are “reconsidering their investments in Mexico as a result of worries over security”, with 16% having suffered extortion and 13% having experienced kidnappings. According to J.P. Morgan’s chief economist for Mexico, “the country likely lost approximately $4 billion in investment in 2010 when companies reconsidered such plans because of drug violence.”

At a more local level, in Ciudad Juárez, “more than 2,500 small grocery stores have closed due to extortion or because customers have left the city; the Mexican social security administration believes that 75,000 residents there have lost their jobs since 2007.”

Clearly, the impacts of Mexico’s “war on drugs” are far-reaching. Let’s hope that the situation improves in 2012, despite it being a year of federal elections in both Mexico and the USA.

Previous posts about the geography of drug trafficking and drug cartels in Mexico:

International financial flows: how do Mexican migrants send remittances back home?

 Books and resources  Comments Off on International financial flows: how do Mexican migrants send remittances back home?
Nov 302011
 

Remittance payments are one of the world’s major international financial flows. Mexican migrants in the USA send more than 20 billion dollars a year in total back to their families and friends. But how exactly are remittance payments made?

A 2005 World Bank study led by Raúl Hernández-Coss entitled “The U.S.–Mexico Remittance Corridor: Lessons on Shifting from Informal to Formal Transfer Systems” answers these questions, with a detailed analysis of the mechanisms and constraints of remittance transfers between USA and Mexico.

The mechanisms used to send money home can be broadly divided into two categories: formal and informal. Formal transfers use the regulated financial systems of the two countries concerned, in this case of USA and Mexico. Formal transfers include those made via banks, credit unions, wire transfer services and postal services. For formal transfers, migrants choose between direct “electronic” transfers from one bank to another, or sending a bank check by post or with a friend, or providing the recipient access to a bank account via an ATM card.

Informal transfers are all the other ways in which funds are repatriated: via ethnic stores, travel agencies, unregistered  money changers, courier services, hawala-type systems (informal value transfer systems) and hand-delivery.

Funds sent via formal channels are better monitored and more secure than funds sent via informal channels. Does this mean that personal remittances might be a good way to repatriate drug profits? The researchers involved in the World Bank study do not believe so:

“Personal remittances, such as migrant worker remittances, have not been widely associated with money laundering schemes, with the exception of “smurfing” (dividing transfers into smaller packages to evade reporting requirements on larger amounts). Larger transfers, such as those related to trade, generally have higher utility for money laundering schemes than do personal transfers of small amounts.”

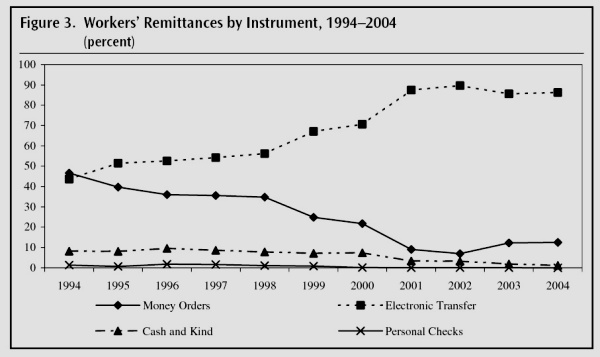
Trends in methods used for remittance transfers. Credit: World Bank, 2005

Trends in methods used for remittance transfers. Credit: World Bank, 2005

The statistics for the value of remittances are based largely on formal transfers. One clear trend, reflected in data from Mexico’s central bank (Banxico), is that migrants are increasingly choosing to send funds using direct electronic transfers (see graph), rather than by personal checks or money orders.

In a future post, we will try to answer the question, “What factors affect migrants’ decisions about the best way to send their money back to Mexico?”

Related posts:

Mexico, USA and Canada cooperate to produce monthly drought maps

 Books and resources  Comments Off on Mexico, USA and Canada cooperate to produce monthly drought maps
Nov 192011
 

The North America Drought Monitor (NADM) is a “cooperative effort between drought experts in Canada, Mexico and the United States to monitor drought across the continent on an ongoing basis”. The program began  in 2002 . The NADM is an extension of an earlier version that was limited to the USA.

The NADM combines multiple indices and local information to produce “drought monitor” maps that best reflect the consensus of numerous scientists, some working at state or federal level, and others working in tertiary education and research.

What exactly is a “drought”?

The basic definition of a drought is a prolonged period of abnormally low precipitation. In practice, this means a period when precipitation is significantly less than would normally be expected for the time period under consideration. The amount of precipitation that is “normal” varies greatly from one area to another, and can also vary with the seasons. Low precipitation in a desert would not necessarily indicate a drought! On the other hand, low precipitation in a rainforest almost certainly would indicate a drought. Since most of Mexico experiences a dry season and a rainy season each year, this further complicates the picture. Not only is it important to know how much precipitation falls, but it is also important to know when it falls.

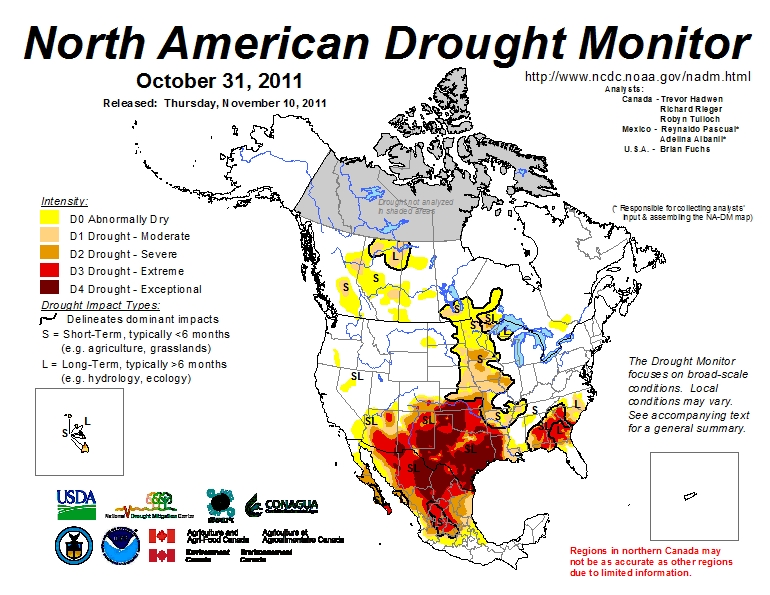
Areas suffering from drought, October 2011
Areas suffering from short-term and long-term drought, October 2011. Click map to enlarge

This definition must be borne in mind when looking at the Drought Monitor maps, as should the seasonality of precipitation throughout most of Mexico, and the distribution of precipitation, which varies greatly from north to south.

The NADM maps show that the drought situation can change quite rapidly from one month to the next. (Use the link above to compare February and March 2011, for example, or March and April 2011).

In a future post, we will take a closer look at the impacts of the drought (shown on the map) that currently affects much of northern Mexico.

Mexican migrants and remittances: an introduction

 Books and resources, Index page  Comments Off on Mexican migrants and remittances: an introduction
Nov 072011
 

Remittances (the funds sent by migrant workers back to their families) are a major international financial flow into Mexico. Remittances bring more than 20 billion dollars a year into the economy, an amount equivalent to 2.5% of Mexico’s GDP.

On a per person basis, Mexico receives more worker remittances than any other major country in the world. An estimated 20% of Mexican residents regularly receive some financial support from relatives working abroad. Such remittances are the mainstay of the economies of many Mexican families, especially in rural areas of Durango, Zacatecas, Guanajuato, Jalisco and Michoacán.

The causes and consequences of mass out-migration and large remittance payments are varied, and sometimes disputed. For background, causes and trends, try:

For some impacts of Mexican migrants on the USA (of varying importance), see:

The four subtitles used in the Atlantic Magazine article are useful reminders of some of the other major aspects of international migration from Mexico. Again, links are given to previous Geo-Mexico posts which look at good examples.

“Branching Out” emphasizes the links that exist between communities, often referred to as “migration channels”.

“The Hollow States” identifies the five major “states of origin”—Guanajuato, Jalisco, Michoacán, San Luis Potosí and Zacatecas—which receive almost 50% of all remittance payments.

“Staying Put” points out that improved economic conditions in Mexico in recent decades, have restricted out-migration from certain areas, especially the border region. Recent developments in Mexico’s war on drugs have, however, led to an increase in the number of border residents moving to bigger, safer cities further south, or seeking to emigrate to the USA.

“Community Development” stresses the important link between “hometown associations” (groupings, found in many US cities, of Mexican migrants sharing a common area of origin) and their related villages and towns in Mexico. Many community development projects in areas of high out-migration have been financed by remittances. In many cases, the three levels of Mexican government—municipal, state and federal—provide matching funds for such projects, meaning that remittances only pay for 25% of the total costs.

In future posts, we will examine some of these aspects of remittances in more detail, and take a much closer look at the precise mechanisms used to make the international financial transfers involved.

Food speculation fuels a tortilla crisis in Mexico

 Books and resources, Teaching ideas  Comments Off on Food speculation fuels a tortilla crisis in Mexico
Oct 292011
 

The Ecologist Film Unit has produced an excellent 8-minute video on how financial speculation on corn (maize) has led to a dramatic rise in the price of corn tortillas, with potentially disastrous effects for the health and well-being of the many of Mexico’s poorest. Reporter Tom Levitt’s video, accompanied by text, presents a compelling case, one which would be an excellent starting-point for class discussions.

Two short quotes set the scene:

“For many Mexicans, particularly the estimated 40 million living on less than $5 a day (£3), tortillas account for almost half of their average daily calorie intake. As a whole, the country consumes 23 times more maize than rice.”

“In 2000 there was $6 billion invested in commodities, by 2011 it was $340 billion, of which $126 billion, according to data from Barclays Capital, is reported to be invested in food. The vast majority of this new investment has been by speculators with no interest in the agricultural sector or in actually taking delivery of the commodity.”

The result? Higher prices for corn, greater unpredictability in prices, and adverse changes to the diet of tens of thousands, as corn becomes more expensive than meager household budgets permit.

The video is a powerful indictment of the harm being done to ordinary people in many parts of the developing world by rich-world market speculators and investment banks. Watch it now, or read the full article:

The maquiladora export landscape

 Books and resources, Teaching ideas  Comments Off on The maquiladora export landscape
Oct 102011
 

InfraNet Lab is “a research collective probing the spatial byproducts of contemporary resource logistics.” Given its emphasis on spatial aspects, it includes many topics of interest to geographers.

InfraNet Lab was included on Planetizen’s 2009 list of the 10 best planning, design, and development websites. Planetizen describes InfraNet Lab as:

“An intense and directed blog focusing on the physical manifestations of controlling resources. It’s a fresh look at the impacts of modern world’s infrastructural needs and the intertwined networks between urbanism, architecture and landscape that result. With archives dating back to April 2008, InfraNet Lab offers a crash course in innovative ideas that reframe the infrastructure conversation around the impacts of human resource dependence and, ultimately, methods for making improvements. An insightful and inciting read for anyone feeling underwhelmed by the status quo of modern-day infrastructure.”

One post on InfraNet Lab of particular interest to us is the guest post by Juan Robles, following an InfraNet Lab seminar at Daniels Faculty of Architecture, Landscape, and Design at the University of Toronto. Robles writes about the landscapes resulting from the growth of maquiladoras in Mexico. He looks at how the necessary infrastructures and networks for maquiladoras to succeed have developed, and how they have transformed the Mexico-US border area. The changes have certainly been profound:

“The ongoing processes of trade and communication that now integrate the 21st century regional economies have created numerous territories of abundance. Among these spaces the maquiladora landscape, in the northern border of Mexico, has seen the greatest change in the last 50 years.”

This is a well illustrated account of the spatial changes associated with maquiladoras, and includes a variety of useful maps and graphics.

Shanty towns support maquiladoras

Shanty towns support maquiladoras. Credit: Juan Robles/InfraNet Lab.

InfraNet Lab is a valuable resource for AP, A-level and IB. In InfraNet Lab’s words:

The globe’s networked ecologies of food, water, energy, and waste have established new infrastructures and forms of urbanism linking dispersed entities. These agglomerations evolve and shift as resources are uncovered or depleted. While these ecologies exist at the service of our contemporary lifestyles, they have typically remained hidden from view and from the public conscience. Yet as resources of food, fuel and water begin to run scarce, new resources are mined and new networks develop.

InfraNet Lab takes the view that “Long accepted patterns of globalization are being called into question as transportation costs soar and resources run scare, transforming mobility and trading patterns. New local, regional and international networks of goods, movement and trade are beginning to emerge.”

This means that InfraNet Lab offers some very valuable resources for courses such as the IB Geography’s Paper 3 for Higher Level students which looks at the impacts of all kinds of international interactions.

Review of “Mexican National Identity, Memory, Innuendo and Popular Culture”, by William H. Beezley

 Books and resources  Comments Off on Review of “Mexican National Identity, Memory, Innuendo and Popular Culture”, by William H. Beezley
Sep 152011
 

William H. Beezley, a professor of history at the University of Arizona, has written widely about Mexican history. He was co-editor, alongside Michael C. Meyer, of the Oxford History of Mexico, an illustrated “narrative chronicle” through the centuries, and a landmark modern history of Mexico. In this book, first published in 2008, Beezley explores the development of Mexican National Identity through a history of some facets of its popular culture.

As in the case of his earlier work (Judas at the Jockey Club and Other Episodes of Porfirian Mexico), Beezley’s Mexican National Identity. Memory, innuendo and popular culture (University of Arizona Press), is wide-ranging and engaging. The book consists of five essays on different themes which Beezley considers central to the development of Mexican National Identity.

In the first chapter, Beezley looks at how the character known as El Negrito came to be “one of the most famous marionettes of nineteenth-century puppet theater”. El Negrito, an Afro-American usually portrayed as a Veracruz cowboy, personified the attitudes of nationalistic Mexicans in the nineteenth century, with his mocking of the French and Maximilian, his temper tantrums, his infidelity, his wit and his resistance to the American invaders.
beezley - coverFrom a geographic perspective, chapter two is the book’s most interesting. The chapter opens by looking at the development of maps which “like symbolic physical features and regional individuals, portrayed Mexico with diversity as the salient attitude”. He describes two 18th century maps, drawn specifically for clerical travelers, highlighting altitude (and therefore climate) and language (ethnicity), but lacking scales, physical features or other landmarks. The modern era of Mexican map-making began with Alexander von Humboldt, and was extended later in the 19th century by others including Antonio García Cubas.

The production of maps necessarily included decisions as to which landmarks, places and features were most important. It also prompted clearer definitions of national boundaries, in both the north and south. In Beezley’s words, “This question of borders had political significance, and both cultural and social dimensions as Mexicans believed the boundaries divided their civilized society from the barbarians beyond.”

Chapter 2 then examines the role of almanacs and lotería (lottery cards), the quintessential Mexican parlor game, in helping to foment national attitudes. Almanacs were “a source of popular or local history and collective memory”. They gave potted summaries of the lives of the saints and martyrs, lists of holy days, images and biographies of political leaders and so on.

Lottery cards shared stereotypical views of objects and characters, often related to local stories. Beezley says that the version played in Campeche eventually gained the greatest popularity. The images used in Campeche formed the basis for the earliest commercially produced sets of cards when Clemente Jacques (a French immigrant and founder of the eponymous food processing brand)  first launched his range of culinary products, from chiles, olive oil and mole sauce to beans, jams and honey, and founded his own printing business to print his own labels. Jacques promoted his brand at the world’s fairs in Chicago (1893) and St. Louis (1904), using printed decks of lotería cards as a form of advertising. His cards became the basis for the modern packs of lotería cards sold throughout Mexico. Many of the most common images have multiple associations, some even including an overtly sexual double meaning. Some figures such as El Borracho (The Drunk) and El Valiente (The Brave One) and La Sirena (The Siren/adultery) are not associated with a particular region or place. Others such as The Scorpion and The Toad are readily associated with specific geographic regions or states: Durango and Guanajuato respectively. Almanacs and lotería cards helped reinforce a sense of national identity while recognizing regional and ethnic differences.

In Chapter 3, Beezley focuses on how celebrations of Mexican Independence gradually came to assume a massive significance for national identity. Independence came in 1821, but it was not until 1869 that annual celebrations of Independence Day really took off. On September 16, 1869, the Mexico City-Puebla railway line was inaugurated, beginning an exciting new era for transportation, which was to have far-reaching effects. During the presidency of Porfirio Díaz, Mexico celebrated its centenary of Independence, an event marked with banquets, parades and the opening to the public of a hastily-restored section of “The Pyramids” at the archaeological site of Teotihuacan. Beezley outlines how the popular perception of Mexico’s patron saint, the Virgin of Guadalupe, changed in less than a century from “the terrifying emblem of Padre Miguel Hidalgo’s insurrection, and the patron of downtrodden, rebellious Mexicans, to the patron saint of the dictatorship’s elite.”

Chapter 4 looks at the role of itinerant puppet theater in molding Mexico’s national identity. The largest and most famous single troupe was the Rosete Aranda troupe, formed by two Italian immigrants in 1850. The troupes went from strength to strength in the next half-century. By 1880, the Rosete Aranda company had 1,300 marionettes and by 1900 a staggering 5,104. Their creativity knew few bounds, and by undertaking annual tours around the country, they helped influence opinions and attitudes. Incidentally, their need to undertake annual tours was in keeping with the established principles of central place theory. As described in Geo-Mexico, the same principles apply in the case of traveling circuses.

In the hierarchy of central places, each step up sees a smaller number of places, each providing a wider range of goods and services, and serving a larger market area. This occurs because for a service to be provided efficiently there must be sufficient threshold demand in the central place and its surrounding hinterland to support it. For this reason we do not find new car dealers, heart surgeons or ballet schools in every small village. These activities can only survive in much larger centers where there is sufficient demand. Individual residents are not prepared to travel far in order to access a service of relatively low value. This poses a challenge for services such as puppet shows which are unable to command a high ticket price, but which need large numbers of potential viewers (a large threshold population) if they are to succeed. This quandary can be resolved by moving from one mid-sized center to another throughout the year, gaining access to a new audience in every location.

Needless to say, the invention of modern communications systems such as television means that this is no longer entirely true, except for live performances.

Beezley’s entertaining romp through Mexican popular culture and its links to national identity is well worth reading. It may not discuss all aspects of how Mexico’s national identity developed during the 19th century, but it provides numerous valuable insights into how a country of such diversity gradually acquired a clearer sense of national identity and purpose.

Where to buy:

Mexican National Identity. Memory, innuendo and popular culture, by William H. Beezley (link is to Sombrero Books’ amazon.com page).
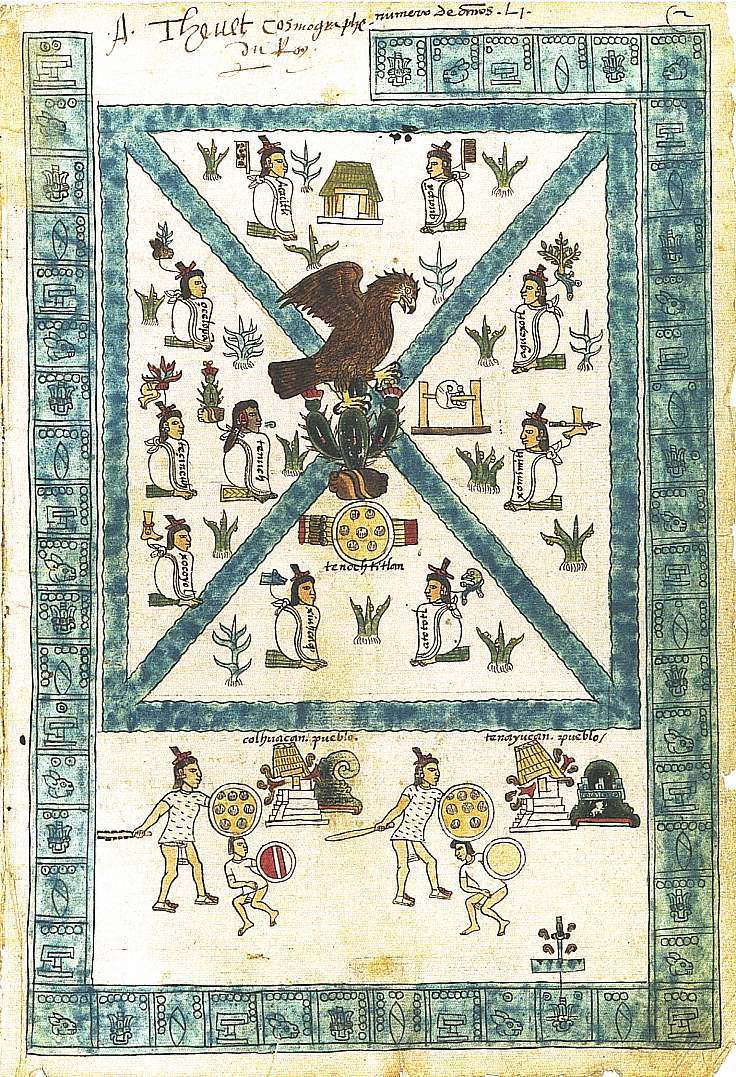
Aug 292011
 

In a previous post–Ciudad Juárez faces economic fallout from the effects of the war on drugs–we looked at how violence in one border city has adversely affected the local economy, causing many businesses to close. The violence has also resulted in many people migrating away from the city. How many have moved? There is limited evidence to quantify the movement, but one demographer believes 40,000 have fled Ciudad Juárez to the U.S. as a result of drug-war violence since 2008.

Ciudad Juárez is not the only city from which people have moved as a result of the security situation. According to some demographers, the “Mexican exodus” comprises at least 125,000 individuals who have chosen to move away from the border area, and perhaps as many as 200,000. An interesting website–Mexodus– features some quality student journalism that examines some of the personal stories involved.

In its own words, “Mexodus is an unprecedented bilingual student-reporting project that documents the flight of middle class families, professionals and businesses to the U.S. and safer areas of México because of soaring drug cartel violence and widespread petty crime in cities such as Ciudad Juárez.” The project, partly funded by the Ethics and Excellence in Journalism Foundation, involved nearly 100 student journalists from four universities:

The collaborative nine-month venture resulted in more than 20 short articles, videos and slideshows relating to the on-going exodus of working families from border cities.

What makes the Mexodus project so interesting is that it is based on highly personal stories, ranging from families who paid ransom money to kidnappers to businessmen who chose to flee rather than pay protection money to safeguard their property. Some of the articles focus on the motives and decision-making processes of people who chose to stay rather than leave.

Mexodus is a valuable resource about the effects of drug-war violence on the lives of people in Mexico’s border cities, and on their decision to stay or leave.


Which cities have the best and worst water systems in Mexico?

 Books and resources  Comments Off on Which cities have the best and worst water systems in Mexico?
Aug 182011
 

The Water Advisory Council (CCA), a Mexican NGO specializing in water research, education and policy, has published its 2011 report on Mexico’s water management, sewerage and sanitation. The report looks at data for 50 Mexican cities, each of which has a population in excess of 250,000.

The report —Gestión del Agua en las Ciudades de México (Water Management in Mexican Cities)— uses data for 20 variables to develop the following 10 indicators: drinking water coverage; drainage and sewerage coverage; continuity and extension of services; productivity; metering; physical efficiency; business efficiency; operating income; wastewater treatment; and institutionalization.

In terms of overall performance, the city of León came top, followed by Saltillo, Monterrey, Mexicali, Aguascalientes, Cancún and Tijuana. Of the top six, three (Saltillo, Aguascalientes and Cancún) are managed by private operators, while León, Mexicali and Tijuana are public water systems. There is clearly no discernible difference between the performance of private operators and the best public systems. Towards the bottom of the rankings, all the cities have public water systems. The worst-ranking cities include several in the State of Mexico, as well as others in the south and southeast of the country.

For water quality, the leader was Ciudad Victoria, followed by Colima, Monterrey, León, Torreón, Tepic and Hermosillo. The ten worst were Villahermosa, Cuernavaca, Acapulco, Oaxaca, Xalapa, Chetumal, Chilpancingo, Celaya, Chimalhuacán and Campeche.

For efficiency, the leader was Saltillo, followed by León, Monterrey, Tijuana and Aguascalientes. The least efficient were Ecatepec, Campeche, Villahermosa, Celaya, Chilpancingo and Chimalhuacán.

The report says that where the private sector is involved, the important issues are transparent tenders; clear, balanced and flexible contracts; effective controls to prevent abuse; legal certainty; and effective regulation with stable, long-term regulating agencies.  The authors also emphasize the importance of pricing that reflects costs, and of removing the payment exemptions currently given to government agencies.

The Water Advisory Council argues that the Federal Agency for Environmental Protection (PROFEPA) should be in charge of all water monitoring, though its powers need strengthening to ensure it can fully carry out its mandate.