admin

Sep 142015
 

Happy birthday, Mexico! On 16 September 2015, Mexico celebrates the 205th anniversary of its independence from Spain.

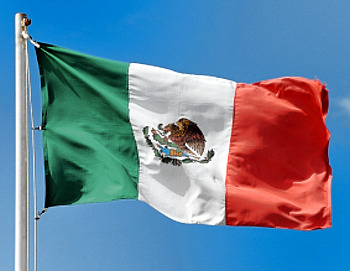
Mexican flag

When was Mexico’s War of Independence?

The long struggle for independence began on 16 September 1810; independence was finally “granted” by Spain in 1821.

Want some map-related geographic trivia associated with the War of Independence?

Events in the War of Independence called for an accurate map of Lake Chapala, Mexico’s largest natural lake. The cartographer for this map was José María Narváez, whose major contributions to Mexican cartography in succeeding decades have largely been forgotten.

The first truly national map, compiled in 1857-1858 from a meticulous reconciling of the work of numerous local cartographers, was drawn by Antonio García Cubas. García Cubas did not graduate from university until a few years after completing this map!

Nationalism and the start of Mexico-USA migration, but not in the direction you might think…

Following independence, the rush was on to draw an accurate map of all of Mexico’s territory. Mexico’s boundaries following independence were very different to today. Flows of migrants linking the USA to Mexico at that time were from the USA to Mexico, the reverse of the direction of more recent flows, which have seen millions of Mexicans migrate north looking for work:

Some national symbols are not quite what you might think, either!

The story of the national emblem (used on coins, documents and the flag) of an eagle devouring a serpent, while perched on a prickly-pear cactus, is well known. Or is it?

Why is “El Grito” held on the night of 15 September each year?

In 1910, then president Porfirio Díaz decided that the centenary of Mexican independence should be celebrated in style. One of the reasons why the “traditional” Grito (“shout”) is made on 15 September each year, rather than on the morning of 16 September (when Father Miguel Hidalgo apparently gathered his parishioners in revolt) is because 15 September 1910 happened to be Díaz’s 80th birthday. Why not have one big bash and celebrate both president and country at the same time? Even though the Mexican Revolution broke out later that year (and Díaz was later exiled to Paris), Mexico continues to start its annual independence-day celebrations on the evening of 15 September.

Not to be confused with Cinco de Mayo (5 May)

Many people incorrectly assume that Cinco de Mayo (5 May) is Mexico’s independence day. The Cinco de Mayo has nothing to do with Independence, but everything to do with a famous victory over the French. It commemorates the Battle of Puebla, fought on May 5, 1862. The battle marks Mexico’s only major military success since independence:

Independent country, independent book:

Mexico has come a long way in 200 years, but amazingly, to the best of our knowledge, Geo-Mexico: the geography and dynamics of modern Mexico, is the first-ever book in English focused exclusively on the nation’s varied and fascinating geography.

¡Viva Mexico!

Mexican flag

Sep 102015
 

We have seen numerous examples in previous posts of Mexico’s astonishingly diverse attractions for international tourism. Having succeeded in attracting mass tourism (e.g. Cancún, Ixtapa, Huatulco), Mexico has sought to diversify its tourism appeal by developing niche markets for visitors with special interests, such as cuisine, adventure tourism, historic sites and health-related holidays.

Mexico’s tourism development agency, FONATUR, recently announced it is seeking help from Spain’s leading cultural tourism firm, Paradores de Turismo, to establish a network of Paradores (luxury hotels in historic buildings) in Mexico. Frequent travelers to Spain will be more than familiar with the Paradores system there which offers visitors the chance to stay in some unique historical buildings without sacrificing too many creature comforts.

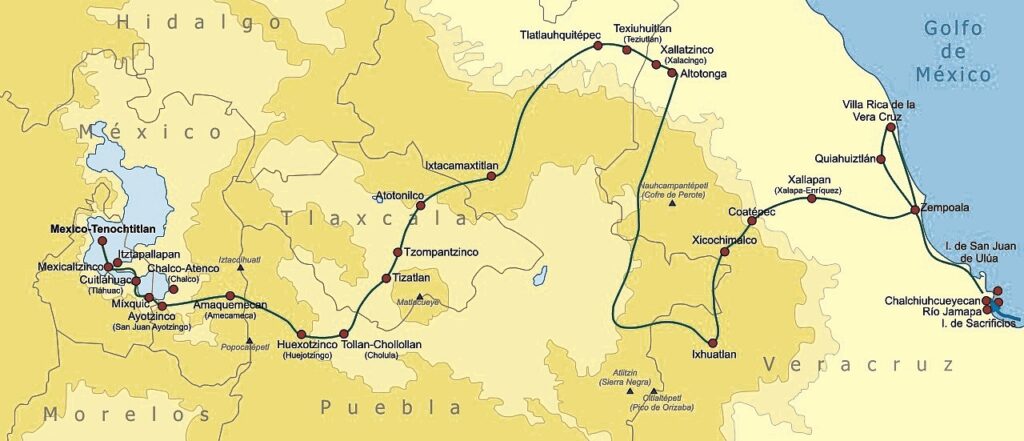
Route followed by Cortés, 1519-1521. Credit: Wikimedia Commons.

Route followed by Cortés, 1519-1521. Credit: Wikimedia Commons. Click to enlarge.

In Mexico, a “History Tourism Plan” is being developed by FONATUR and the Federación de Haciendas, Estancias y Hoteles Históricos de México. In the first stage, an inventory will be compiled of the best existing haciendas, monasteries and other historic buildings that already are, or could be converted to, hotels. At the same time, experts will be discussing which “routes” offer the best combinations and provide most interest to tourists. Routes will be developed to highlight specific themes.

The first route to be proposed is The Route of Cortés, linking properties in five states: Veracruz, Puebla, Tlaxcala, State of Mexico and the Federal District (see map). This is a timely idea given that the 500th Anniversary of the arrival of Cortés and his journey to central Mexico comes in 2019.

Related posts:

Will UNESCO give World Heritage status to Lake Chapala?

 Books and resources, Other  Comments Off on Will UNESCO give World Heritage status to Lake Chapala?
Sep 072015
 

We don’t often champion causes in these pages, but are more than willing to lend our support to a campaign hoping to persuade UNESCO to declare Lake Chapala a “World Heritage” site. The campaign appears to have stalled, and deserves more support.

The following 6-minute video (English subtitles) from 2008 sets the scene for those unfamiliar with the area:

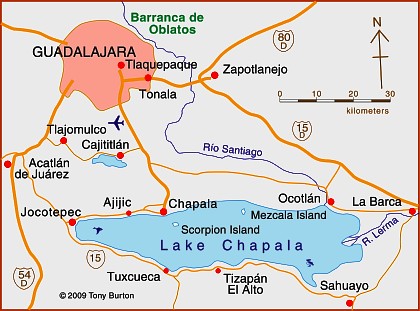
Where is Lake Chapala?

Map of Lake Chapala

Map of Lake Chapala. Credit: Tony Burton; all rights reserved.

Why should Lake Chapala be declared a World Heritage site?

Natural history: it is Mexico’s largest natural lake and home to some unique endemic fauna.

Cultural and historic significance: it is a sacred site for the indigenous Huichol Indian people. Specifically, the southernmost “cardinal point” in their cosmology is XapaWiyemeta, which is Scorpion Island (Isla de los Alacranes) in Lake Chapala.

In the nineteenth century, as Mexico fought for its independence from Spain, Lake Chapala was the scene of a truly heroic struggle, centered on Mezcala Island, between the Royalist forces and a determined group of insurgents. It proved to be a landmark event, since after four years of fighting, an honorable truce was agreed.

At the very end of the nineteenth century, influential families from Mexico and from overseas “discovered” Lake Chapala. For several years, Mexico’s then president, Porfirio Díaz, made annual trips to vacation at the lake. As the twentieth century progressed, the area attracted increasing numbers of authors, poets and artists, many of them from abroad, including such greats as D.H. Lawrence, Tennessee Williams, Witter Bynner, Charles Pollock and Sylvia Fein. (To discover more of the literary and artistic characters associated with Lake Chapala, please see this on-going series of mini-biographies.)

Today, it is the single largest retirement community of Americans anywhere outside of the USA.

Is this enough to qualify Lake Chapala for World Heritage status? I don’t know, but it certainly seems worth a shot!

Posts related to Lake Chapala:

Tourism in the Lake Chapala (Ajijic, Chapala, Jocotepec) and the Lerma-Chapala basin:

Want to read more?

For general introduction and background to this area, see the first eight chapters of my Western Mexico: A Traveler’s Treasury (4th ed, 2013). In the words of Dale Palfrey, reviewing the book for the Guadalajara Reporter, “First published in 1993, the revised and expanded fourth edition of “Western Mexico”… opens with what qualifies as the most comprehensive guide to the Lake Chapala region available in English.“

For a more in-depth account of the history of the Lake Chapala region up to 1910, see my Lake Chapala Through the Ages, an anthology of travelers’ tales. It features informative extracts from more than fifty original sources, linked by explanatory text and comments, together with brief biographies of the writers of each extract. They include some truly fascinating characters… see for yourself!

Both books are available as regular print books, or in Kindle and Kobo editions.

Mexico’s food and beverage multinationals continue to expand

 Updates to Geo-Mexico  Comments Off on Mexico’s food and beverage multinationals continue to expand
Sep 032015
 

Mexico’s seven leading food and beverage multinationals have invested a total of 7.42 billion dollars overseas in the past five years. The investments include acquisitions of other firms, building new plants and enlarging or remodeling existing plants.

The seven firms are:

  • Coca-Cola Femsa
  • Grupo Bimbo
  • Arca Continental
  • Gruma
  • Sigma Alimentos
  • Grupo Lala
  • Grupo Herdez

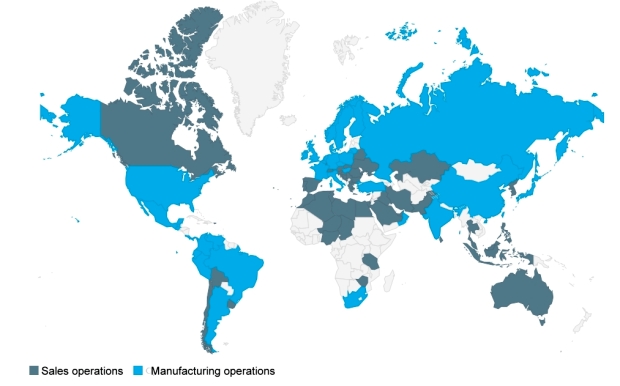
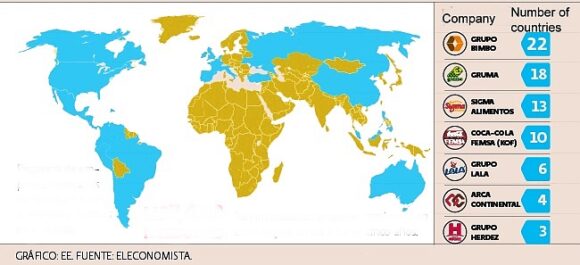
In terms of the number of countries where they have a presence, the two most globalized food and beverage firms in Mexico are Grupo Bimbo and Gruma, which are in 22 and 18 countries respectively (see map). Both firms are now quite dependent on foreign earnings. About 61% of Bimbo’s revenues, and almost 70% of Gruma’s revenues, originate from outside Mexico. Both firms have the longest reach of any of the food and beverage multinationals: Bimbo as far as China, and Gruma in Australia.

Mexican food-related multinationals

Mexican food-related multinationals are present in all the countries colored blue

In this post, we take a quick look at each of these seven firms and their recent activity abroad:

Femsa, based in Monterrey, is the world’s largest bottler of Coca-Cola products, with 45 plants in Latin America, including Colombia, Brazil and Venezuela, as well as 19 plants in the Philippines. It spent 1.855 billion dollars to buy Brazilian firm Spaipa, and a further 258 million dollars on building a new plant there (its tenth plant in Brazil), as well as 688.5 million dollars for 51% of the Coca-Cola Company in the Philippines. Femas also operates the OXXO chain of convenience stores, the largest such chain in Latin America.

Grupo Bimbo is the world’s largest bread maker and the biggest bread seller in the USA. It is the world’s 4th largest food company behind only Nestle, Kraft, and Unilever. Bimbo has 85 plants in the USA and Canada, 39 in Mexico, 32 elsewhere in Latin America, 10 in Europa and one in Asia. It has expanded primarily via acquisitions. It bought Canada Bread in 2014 for 1.66 billion dollars. In 2011, U.S. agencies authorized its purchase of Sara Lee for 709 million dollars. It also bought Bimbo Iberia (Spain) for 160 million dollars in 2011. It is now awaiting approval from Spanish regulatory authorities to complete its purchase of Panrico for 210 million dollars.

Gruma (main brands Maseca and Mission) is the world’s largest producer of corn flour and tortillas. It has 79 production plants worldwide and operates in North America, Europe, Asia and Oceanía. Gruma recently bought Azteca Foods Europe (Spain) for 48 million dollars. In 2014, it bought Mexifoods (Spain) for 15 million dollars. It also owns Albuquerque Tortilla Company. Gruma has also invested in new factories, including a 50-million-dollar plant in California, opened in 2010, as well as a new factory in Russia costing a similar amount.

Arca Continental, the second largest Coca-Cola bottler in Latin America, has 35 plants in the region. It purchased a milk products firm, Holding Tonicorp (Ecuador), in 2014 for 400 million dollars, and spent around 330 million dollars in 2012 to acquire two snack food firms: Wise Foods (USA) and Inalecsa (Ecuador).

Sigma Alimentos (cold cuts, cheese, yoghurts and other milk products) has 67 production facilities in total, including (in addition to Mexico) the U.S., Costa Rica, El Salvador, Spain, France, Italy, Netherlands, Belgium and Portugal. It recently bought Spanish firm Campofrío for 345 million dollars.

Grupo Lala (milk products) has 18 production plants in Mexico and Central America. It recently bought Nicaraguan firm Eskimo (ice-cream and other milk products) for around 53.2 million dollars.

Grupo Herdez has 13 plants in Mexico, one in the USA and one in Chile. It recently bought Helados Nestlé in Mexico.

What these firms have in common is that they specialize in making products that are relatively easy to adapt to local tastes (glocalization). They have also started their expansions outside Mexico by focusing initially on markets with familiar languages and culture before venturing further afield.

As interesting as where the companies ARE is where the companies are NOT. Astonishingly, the map suggests that no Mexican food-related multinational yet has a toe-hold in any country in Africa, for example.

Related posts:

Mexico’s tourism development policies: a model for the world?

 Mexico's geography in the Press  Comments Off on Mexico’s tourism development policies: a model for the world?
Aug 272015
 

Mexico welcomed a record number of tourist last year: 29.1 million visitors, a 20.5% increase over 2013. The number of tourists is projected to grow 8% this year. Most tourists visiting Mexico come from the U.S., followed by Canada, U.K., Colombia and Brazil. During the first six months of 2015, the average expenditure/tourist was 865 dollars.

Mexico is the top international destination for U.S. tourists and according to U.S. Commerce Department data, visits to Mexico by U.S. tourists rose 24% in 2014 to a record 25.9 million, despite U.S. travel warnings relating to parts of the country. Figures from the Mexican side of the border suggest a more modest, though still substantial, increase of 11.8% in U.S. tourists entering the country. The differences in the figures reflect slight differences in definitions and methodology.

Just how did Mexico achieve its tourism success? The answer appears to be a combination of its fortuitous proximity to the USA allied with some smart policy decisions. This helps to explain why the Organisation for Economic Cooperation and Development (OECD) has chosen Mexico as the basis for developing a transferable model to demonstrate the potential of tourism in international development. The in-depth study, to be published next year, will focus on the economic and political aspects of international tourism.

Related posts:

The geography of the Spanish language: how important is Spanish around the world?

 Books and resources, Other  Comments Off on The geography of the Spanish language: how important is Spanish around the world?
Aug 242015
 

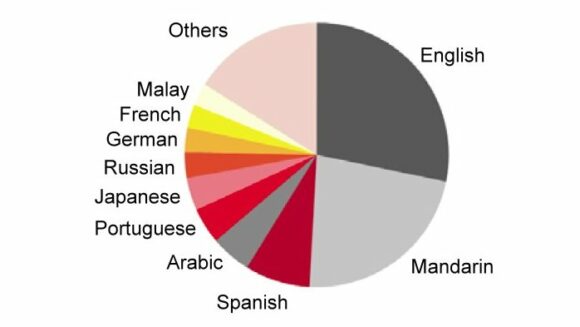
The Index of Human Development ranks Spanish as the second most important language on earth, behind English but ahead of Mandarin.

Spanish is the third most widely used language on the internet (graph), although less than 8% of total internet traffic takes place in Spanish. Spanish is the second most used language on Facebook, a long way behind English but well ahead of Portuguese.

Languages used on the Internet (2015). Source: Internet World Stats

Languages used on the Internet (2015). Source: Internet World Stats

According to El español, una lengua viva – Spanish, a living language, a report from the Instituto Cervantes in Spain (which promotes the Spanish language abroad via language classes and cultural events) there are about 559 million Spanish speakers worldwide. This figure includes 470 million native speakers and an additional 89 million who have some command of the language.

While Mexico remains the world’s largest Spanish-speaking country, with about 121 million Spanish speakers, second place belongs to the USA, followed by Colombia. The USA has an estimated 41 million native speakers of Spanish plus 11 million who are bilingual; Colombia has 48 million Spanish-speakers.

In terms of economic importance, the report’s authors calculate that Spanish speakers contribute 9.2% of the world’s GDP. About two-thirds of Spanish-linked GDP is generated in North America (USA, Canada and Mexico) and the European Union, while Latin America (excluding Mexico) accounts for 22%.

The main concentrations of Spanish speakers in the USA are in the states of New Mexico (47% of the population), California and Texas (both 38%), and Arizona (30%). 18% of New Yorkers speak Spanish and, somewhat surprisingly, more than 6% of Alaskans are also Spanish speakers. Interestingly, the US Census Office estimates that by 2050, the USA will have 138 million Spanish speakers and could then overtake Mexico as the largest Spanish-speaking nation in the world. This assumes that current predictions for Mexico’s population increase over the next 35 years hold true.

Want to learn more?

Related posts:

Chiapas map and index page

 Index page  Comments Off on Chiapas map and index page
Aug 202015
 

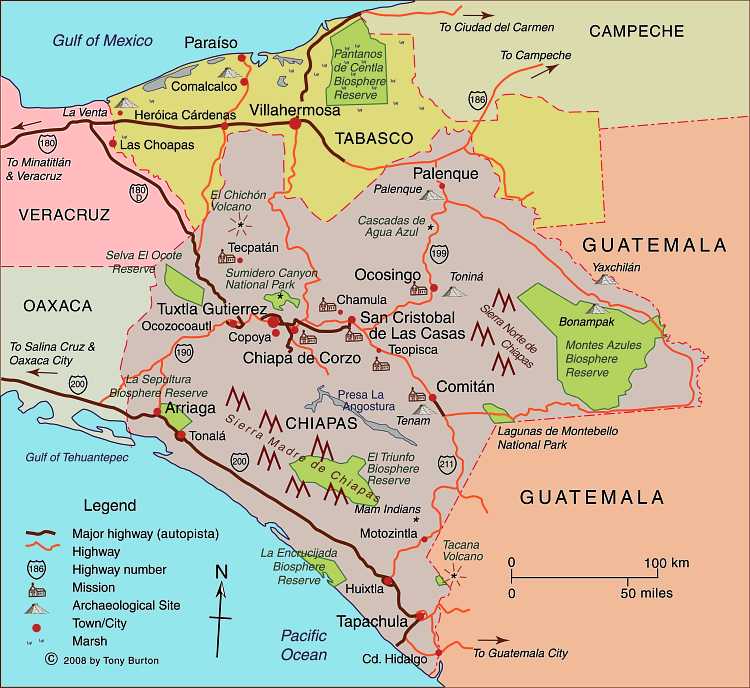
This Chiapas map and index page lists the most interesting posts on Geo-Mexico related to the southern state of Chiapas, and also links to a selection of articles about agriculture and poverty that place Chiapas in the national context.

mapchiapas

Map of Chiapas. Click here for interactive map of Chiapas on Mexconnect.com.

Geological background

Indigenous communities:

About 20% of the 4.8 million people living in Chiapas belong to one or other of the state’s numerous indigenous groups. Development and cultural issues relating to indigenous communities in Chiapas are many and varied as can be seen in the following articles:

Tourism:

Chiapas has huge tourism potential, apart from the Mayan site of Palenque, the state capital Tuxtla Gutiérrez, and the beautiful colonial city of San Cristóbal de las Casas (the former capital).

Mexico’s list of Magic Towns has long included the San Cristóbal de las Casas, but now boasts two more recent additions in Chiapas:

Chiapas is also the site for a (proposed) different type of tourist development:

Agriculture in Chiapas:

Posts which refer to Chiapas in the context of national data on agricultural production include:

Poverty and inequality in Chiapas

Chiapas is recognized as one of the poorest states in Mexico: Articles containing recent data on this topic:

Other topics:

Water in Mexico: a human right that is currently subsidized and wasted

 Other  Comments Off on Water in Mexico: a human right that is currently subsidized and wasted
Aug 172015
 

Two recent articles in OOSKAnews, a publication dedicated to news in the water industry, have profound implications for Mexico’s water supply situation. The first (10 July 2015) is a report of a meeting in Guanajuato of national water and water treatment specialists (Segundo Encuentro Nacional de Áreas Técnicas  de las Empresas de Agua y Saneamiento de México).

Selected quotes from the report include,

Mexico’s legal framework for water is out of date and does not reflect the country’s current reality…

Nationwide, water users only pay about 20% of the cost of production; 80% of water costs are subsidized, a situation that is not sustainable…

Legal reforms aimed at protecting human rights with regard to water had harmed service providers, who cannot cut off service to customers who fail to pay their bills.”

The report also comments on the on-going El Zapotillo dam project on the Rio Verde in Jalisco state, saying that it,

is a priority for President Enrique Pena Nieto’s administration, despite ongoing delays and legal conflicts. The $1.24 billion dollar project was approved in 2005 and is more than 80% complete. However, residents of Temacapulín, Acasico and Palmarejo have been fighting construction of the dam, which would flood their villages.”

sacmex

The second report focuses on Mexico City and the estimate by Ramón Aguirre Díaz, the head of Mexico City’s Water System (SACMEX), that fixing leaks in the city’s potable water distribution network would cost around US$430 million. This is a huge cost when compared to the system’s annual budget for maintenance and improvement of infrastructure of about US$135 million.

Aguirre claims that 40% of available water is lost because of leaks in the network. SACMEX is launching a program in 2016 to provide a long-term solution to the problem. In a press interview, the official said that, “A city like ours should be able to supply every citizen by producing 26 cubic meters/second, but currently our system requires 30.5 cubic meters/second”.

The sections of the city with the most severe losses are those like Coyoacán and Tlalpan built on the soft sediments of the former lake-bed, as well as those such as Miguel Hidalgo, Cuauhtémoc, and Benito Juárez, where the supply pipes are more than 70 years old. Combined, these areas house over 2.5 million people.

Aguirre also outlined the progress made in bringing reliable access to potable water to all 1.8 million inhabitants of Iztapalapa, one of the poorest and most densely populated sections of the city. Some 72,000 residents in Iztapalapa lack piped water supply to their homes, and therefore have to depend on provision from tanker trucks. Even those who do have access to piped water have to cope with inadequate pressure, poor water quality and frequent supply outages.

According to Aguirre, the city administration will meet its goal of reliable access to piped water for all of Iztapalapa by 2018. Reaching this point requires the construction of 22 water treatment plants and various other major infrastructure modernization projects.

Related posts:

Aug 132015
 

Like many of our readers, we love looking at maps. It is always interesting to study maps compiled by cartographers working in different countries and different languages. It can also be a great way to learn some new words and phrases in a foreign language.

world-atlas-spanish

This latest resource is therefore well worth recommending. It is an outstanding Spanish language World Atlas, accessible online as a series of three pdf files:

The lavishly illustrated atlas was prepared by experts from the Geography Institute of Mexico’s National University (UNAM). It is aimed at high school students and the maps are complemented by carefully selected info-graphics and informative text.

Exploring these maps is a great way for native English speakers to improve their Spanish language geographic vocabulary!

Related posts:

 Tagged with:

Mexico City’s Drinking Water Fountains

 Other  Comments Off on Mexico City’s Drinking Water Fountains
Aug 102015
 

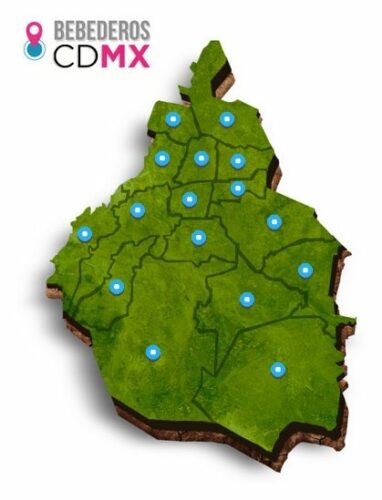
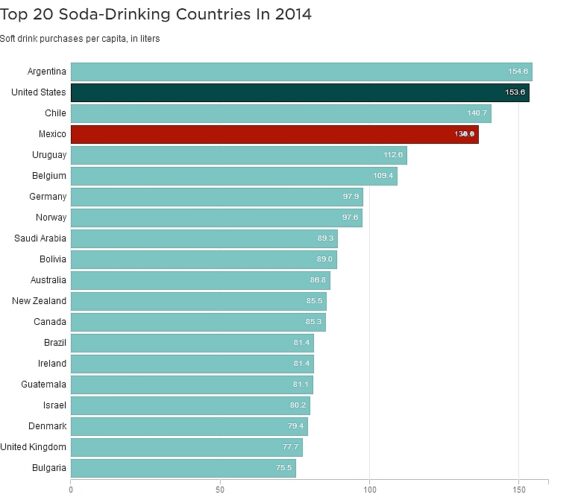
Earlier this summer, Mexico City’s Water System (SACMEX) inaugurated a network of 230 drinking fountains installed in public spaces across the city. The fountains are part of the city’s initiative to curb reliance on bottled water. (Mexicans consume more bottled water per person than any other country in the world).

water-fountains-mexico-city

Click for interactive map of Mexico City water fountains

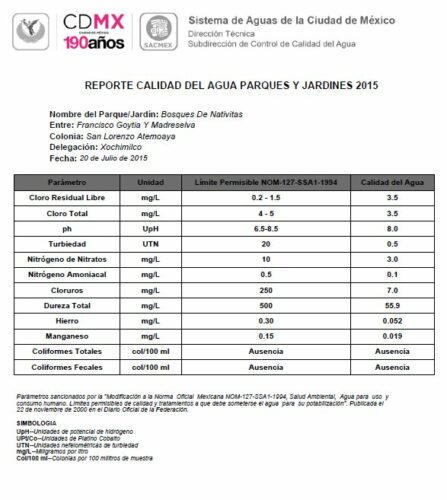
The sites for the fountains were selected taking local water quality into account. An interactive website enables residents and visitors alike to find the locations of the fountains, and offers up-to-date information about the water quality parameters.

water-quality-xochimilco-july-2015.

Sample water quality report – Xochimilco, July 2015 [Click to enlarge]

Water from all the fountains is being tested on a regular basis to ensure that it complies fully with official water quality standards.

Related posts:

Mexico has highest rate of death from lightning strikes in the Americas

 Other  Comments Off on Mexico has highest rate of death from lightning strikes in the Americas
Aug 062015
 

Last year, three Mexico City climate researchers published a comprehensive study of the 7300+ deaths due to lightning in Mexico during the period 1979 to 2011.

In “Deaths by Lightning in Mexico (1979–2011): Threat or Vulnerability?“, G. B. Raga, M. G. de la Parra and Beata Kucienska examined the distribution of fatalities due to lighting, looking for links to population density, vulnerability and other factors.

The number of deaths from lightning averaged 230 a year for the period studied. Given Mexico’s population, this means a rate of 2.72 fatalities from lightning for every million people. This is the highest rate in the Americas.

Fatalities were not distributed evenly. Seven of Mexico’s 32 states accounted for 60% of all lightning fatalities. Almost one-quarter of all deaths from lightning occurred in the State of México. Other states with high rates included Michoacán, Oaxaca and Guanajuato.

More than 45% of all deaths from lightning were young males under the age of 25 (with those aged 10 to 19 at particular risk). Overall, far fewer females died from lightning than males, though for females, too, the highest rates were for the under-25 age group.

Most deaths happened in the first half of the rainy season, between June and August, when thunderstorms are most likely.

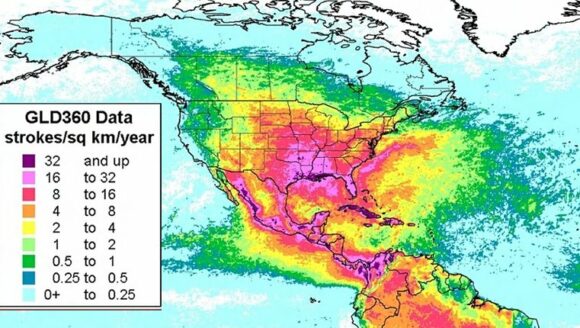
Lightning incidence, North America, 2012-2014

Lightning incidence, North America, 2012-2014. Credit: Vaisala

What do all these numbers mean?

The incidence of lightning strikes in not equal across the country. For example, in the period 2012-2014 (see map) there were far more lightning events in in central and southern Mexico than in the northern part of the country and the Baja California Peninsula. This means that there is no clear connection between deaths by lightning and population density. However, neither is there a clear connection between deaths by lightning and the places where most lightning strikes occur.

The key factor is not just how likely a lightning strike is to occur in a particular place but also how vulnerable the local populace is. Some sectors of the population are much more vulnerable than others. Those working outdoors, for example, are at higher risk than those working indoors. This makes rural workers more vulnerable than urban workers. It also makes younger people more vulnerable than older people.

Education and awareness also play a part. Many countries have seen a dramatic fall in deaths from lightning as a direct result of launching campaigns to make people more aware and provide education about safety precautions. In the USA, fewer than 40 people now die each year from lightning, compared to about 400 in the 1930s, when the population was smaller.

For this reason, the study also concluded that the large number of deaths in Mexico is partly due to “the government’s failure to implement education and prevention strategies in communities living and working in vulnerable conditions”. Sadly, this means that there will probably be further tragic incidents similar to the one that took the lives of several members of the same family last month in the remote mountainous community of Mesa Cuata in Guanajuato.

Reference:

G. B. Raga, M. G. de la Parra, and Beata Kucienska, 2014: “Deaths by Lightning in Mexico (1979–2011): Threat or Vulnerability?”. Weather, Climate & Society, 6, 434–444.

Related posts:

Mexico’s tallest waterfalls

 Other, Updates to Geo-Mexico  Comments Off on Mexico’s tallest waterfalls
Aug 032015
 

As we saw in “How long is Mexico’s coastline?“, geographical “facts” and “records” are often not quite as simple to determine as might appear at first sight.

Take waterfalls for example. Mexico’s “highest” waterfalls are not necessarily the same as Mexico’s “tallest” waterfalls, since height refers to elevation, rather than stature. I’m not sure which is Mexico’s highest waterfall, but assume it is likely to be a small waterfall near the summit of one of Mexico’s many major volcanic peaks.

Mexico’s tallest waterfall, on the other hand, is well-known, or is it? Older sources still list the Cascada de Basaseachic in the Copper Canyon region of northern Mexico as the country’s tallest waterfall. That waterfall is 246 meters (807 feet) tall, according to geographer Robert Schmidt, a calculation subsequent confirmed by measurements made by members of a Mexican climbing expedition.

This short Postandfly video shows the Basaseachic Waterfall from the air:

The Basaseachic Waterfall is normally considered to operate year-round, though very little water flows over it on some occasions during the dry season.

In terms of total drop, however, and if we include waterfalls that are seasonal, the Basaseachic Waterfall is overshadowed by the nearby Cascada de Piedra Bolada (Volada). The Piedra Bolada Waterfall, has a total drop of 453 meters (1486 feet), but flows only during the summer rainy season. It is much less accessible, and its true dimensions were only worked out for the first time by an expedition as recently as 1995 by members of the Speology Group of Ciudad Cuauhtémoc, led by Carlos Lazcano.

This latter sections of this amateur video of the Piedra Bolada Waterfall show some of the amazing scenery in this remote area of Mexico:

Curiously, there is some debate as to whether this waterfall should be called Cascada de Piedra Volada (which would translate as the “Flying Stone Waterfall”) or Cascada de Piedra Bolada (“Round Stone Waterfall”). According to members of the Speology Group of Ciudad Cuauhtémoc, its true name is definitely Piedra Bolada, a name referring to a spherical stone, and used in addition for the local stream and for the nearest human settlement.

So, which is Mexico’s tallest waterfall? Well, it all depends…

Related posts:

Repainting the walls of Palmitas in Pachuca leads to reduced crime

 Mexico's geography in the Press  Comments Off on Repainting the walls of Palmitas in Pachuca leads to reduced crime
Jul 302015
 

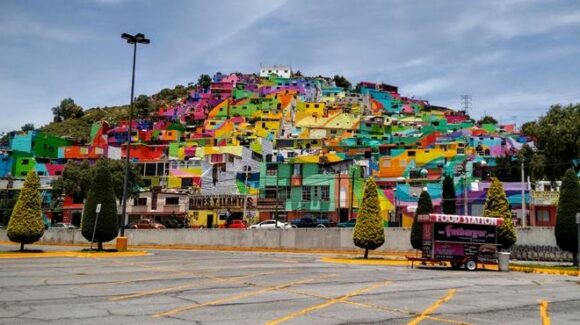
Palmitas is a small, densely-populated neighborhood in the city of Pachuca, the capital of the state of Hidalgo in central Mexico. It has a reputation for higher than average levels of deprivation, crime and violence.

An innovative social development project, based on artistic transformation, has turned Palmitas over the past few months into a rainbow-hued, quasi-kaleidoscopic, example of urban renewal.

palmitas-foto-jorge-gonzalez

Palmitas, 2015. Photo credit: Jorge González / UNIÓN Hidalgo

The project involved four main players: an art collective (“Germen Crew”), the city government, Comex (a major national paint manufacturer) and a youth organization that was previously better known for its graffiti art.

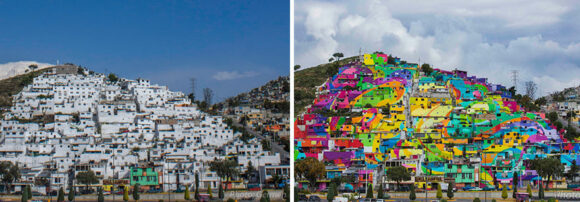
The youths joined “Germen Crew” and painted 209 houses, some 20,000 square meters of facade in total, into a single rainbow mural. The specialized materials used, supplied by Comex, have provided maximum long-term protection for the dwellings while turning the streets into ribbons of color. The greatest challenge was that many of the exterior walls were in a very rough shape, and some had never been properly finished or protected.

The “macro mural” has been called the “world’s largest” in some news reports. This title is hotly disputed; other contenders include a mural in Berlin and the Pueblo Levee Project in Colorado.

According to streetartnews, the community involvement in this project from start to finish, led to positive effects on 452 families (1808 people), and a dramatic fall in youth violence, to the point of almost eradicating it.

All the homes were first painted white to symbolize the unity of the community, that all community members are equal, and that all members of the community would benefit from the urban renewal. This pair of photos shows before and after images of Palmitas:

crew-germen-graffiti-town-mural-palmitas

Alongside the months of paintings, numerous community events were held to foment participation and a sense of local ownership of the project.

This short video on Youtube (Spanish) describes the project:

The colorful Palmitas project is an unusual and interesting example of urban improvement, urban renewal or urban regeneration.

Comex has said that it will support similar urban renewal projects elsewhere in Mexico that beautify the local settings and help improve people’s lives, so please report back if you find a similar project happening in your neighborhood.

Related posts:

The Trans-Isthmus mega-project

 Mexico's geography in the Press  Comments Off on The Trans-Isthmus mega-project
Jul 272015
 

A huge industrial development plan looks set to get underway shortly in the narrow Isthmus of Tehuantepec in southern Mexico. The low-lying Isthmus of Tehuantepec separates the Chiapas Highlands and the low Yucatán Peninsula from the rest of Mexico. The Isthmus was once considered as an alternative location to Panama for a trans-continental canal.

During Mexico’s internal Reform War (1858‑60), between the liberals, led by Benito Juárez, and the conservatives, both sides encountered serious financial problems. At one point in this war, the liberals accepted an offer from the USA to receive four million pesos in exchange for the USA having the “right of traffic” across the Isthmus of Tehuantepec “in perpetuity”. Fortunately, this treaty was never ratified by the US Senate.

Proyecto-Transistmico

In recent years, the Tehuantepec area has received massive investments in wind power, with several major wind farms already operational and more on the drawing board. The latest plans will build on those investments to provide upgraded infrastructure meeting the preconditions for industrial development.

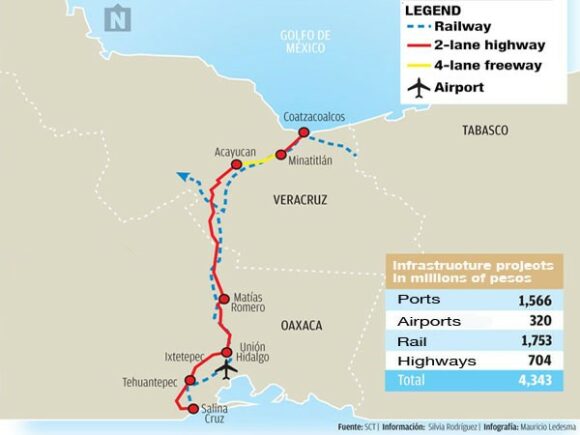
The 300 million dollars allocated to the first phase of the Trans-Isthmus Project will improve railroads, highways, airports, and the ports of Coatzacoalcos on the Gulf Coast and Salina Cruz on the Pacific Coast (see map).

During the second phase, private sector financing will add industrial development areas, which should boost the area’s contribution to national GDP from 2% to 4.5%, and raise the regional GDP/person to $10,000 a year, close to the national average.

The federal government has designated this region as a special economic zone, offering several fiscal incentives to new enterprises. Chinese investors have already expressed interest in building a 200-million-dollar steel manufacturing plant in the isthmus, utilizing nearby iron ore reserves to produce 3 million tons of steel a year.

Posts related to the same general area of Mexico:

Historic photo of the month: Mexico City cave-dwellers

 Other  Comments Off on Historic photo of the month: Mexico City cave-dwellers
Jul 232015
 

A shout out to Marcia Ambler for sharing, via email, her memories of Mexico City in the 1950s. Among other things, she recalled how she lived as a child with her family, “in a suburb of Mexico City, where there was a deep barranca with people who lived as cliff dwellers in the barranca walls. There was also a cave nearby with a deep drop which I went in with my friends.”

Her email brought back some fond personal memories of Mexico City from the late 1970s and early 1980s. Shortly after I moved to the city, Time Life published The Great Cities: Mexico City, by John Cottrell. I found this book fascinating at the time, and a quick re-read earlier this week confirms that it still well worth looking for (inexpensive copies available via Abebooks) if you are interested in what makes one of the world’s largest cities tick.

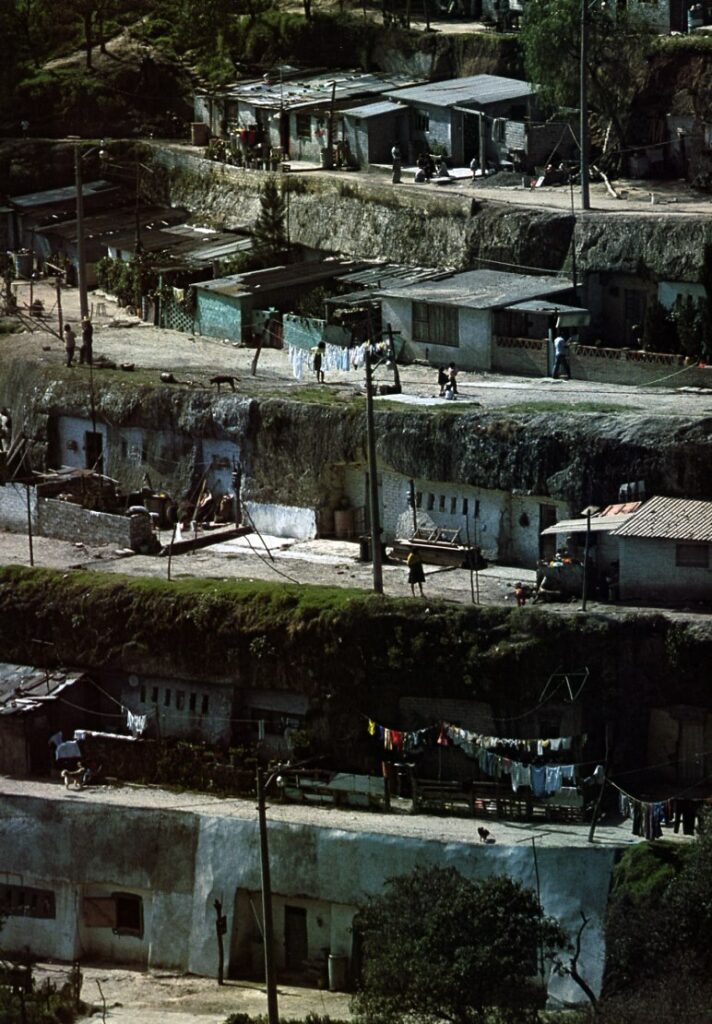
Mexico City cave dwellers. Photo by from The Great Cities: Mexico City" (Time Life books).

Mexico City cave dwellers. Photo by Harold Sund in “The Great Cities: Mexico City” (Time Life, 1979).

Like most Time Life books, it is lavishly illustrated, which brings me back to the caves and cave dwellers, since one of the photos (above), by Harold Sund shows the area that Marcia remembers, and which was also my first introduction to the curious world of relatively modern-day troglodytes in Mexico City.

Sund’s photo shows the Belén de las Flores community, relatively close to western end of Chapultepec Park, though there may well have been, and almost certainly were, several similar settlements elsewhere. This short newspaper article, from the Bangor Daily News in 1978, describes the “year-round comfort” that can be enjoyed in such caves.

I haven’t had the opportunity to revisit this area of Mexico City for more than thirty years, so I’m anxious to know what it looks like now.

Sincere thanks, Marcia, for your message which certainly took me on a trip down memory lane!

Source of photo:

  • John Cottrell. 1979. The Great Cities: Mexico City (Time Life Books, 1979). Photography by Harold Sund.

Related posts:

Latest additions to Mexico’s Protected Natural Areas

 Mexico's geography in the Press, Updates to Geo-Mexico  Comments Off on Latest additions to Mexico’s Protected Natural Areas
Jul 202015
 

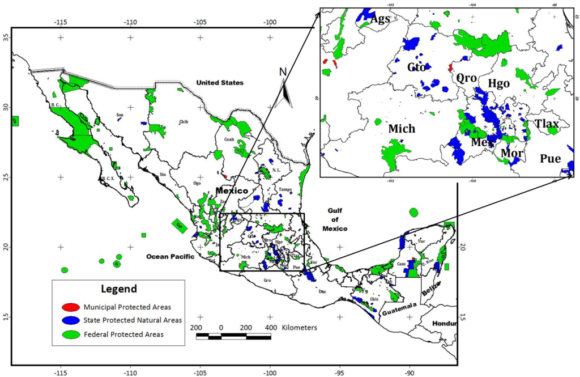
Alejandro del Mazo Maza, head of Mexico’s Commission for Protected Natural Areas (Áreas Naturales Protegidas), says that the formal decrees for seven additional PNAs (Protected Natural Areas) will be published shortly. In some cases, the decrees apply to areas whose status as protected areas was first announced months or even years ago.

The seven new additions are in the north and northwest regions of the country:

  • the Marismas Nacionales biosphere reserve in Sonora
  • Monte Mojino (protected area of flora and fauna), Sonora
  • the Sierra de Tamaulipas biosphere reserve
  • the Playa Boca de Apiza sanctuary in Colima
  • the Islas del Pacífico of Baja California reserve
  • the Semiarid Desert reserve of Zacatecas
  • the Sierras la Giganta y Guadalupe reserve in Baja California Sur

Mexico currently has 177 PNAs (in various categories), and the new additions bring that total to 184.

In addition, preparatory studies are underway to establish two additional biosphere reserves, for the Mexican Caribbean and the Gulf of California (Sea of Cortés).

Mexico's Protected Areas (Gallina, 2012)

Mexico’s Protected Areas (Gallina, 2012)

The Commission of PNAs is working hard to complete formal management plans for every PNA – environmental, social and economic issues. At present, only 97 of the 177 PNAs have such plans in place, with the latest plans published only weeks ago for:

For example, the management program for the whale shark reserve authorizes a maximum of 160 whale-watching boats in an effort to ensure sustainability.

Source of Map:

Sonia Gallina, 2012. “Is Sustainablity Possible in Protected Areas in Mexico? Deer as an Example of a Renewable Resource.” Sustainability 2012, 4 (10), 2366-2376

Related posts:

Mexico has a 2015 population of 121 million people

 Updates to Geo-Mexico  Comments Off on Mexico has a 2015 population of 121 million people
Jul 162015
 

The latest population estimates released by the National Population Council (Conapo) to coincide with World Population Day show that Mexico has a population in mid-2015 of 121,783,280. Of this total, almost 43 million (35.4%) are adolescents, between 10 and 29 years of age.

A spokesperson for Conapo drew attention to the fact that Mexico still needs to do more to overcome gender inequality in fields such as education, salaries and working conditions.

Related posts:

Recent eruptions of Colima Volcano, el Volcán de Colima

 Mexico's geography in the Press  Comments Off on Recent eruptions of Colima Volcano, el Volcán de Colima
Jul 122015
 

Colima Volcano (aka el Volcán de Colima or el Volcán de Fuego) continues to erupt, displaying its fiery temper by throwing massive plumes of ash and smoke several kilometers into the air. One recent eruption caused a plume of ash seven kilometers high.


Following the eruptions of 10 and 11 July 2015 (see video clip from Webcams de México), a state of emergency has been declared by the state of Colima in 5 municipalities: Colima, Comala, Coquimatlán, Cuauhtémoc and Villa de Álvarez. This enables rapid access to state and federal funds in preparing to cope with any potential disaster.

A precautionary evacuation has been ordered of all communities within a 12-kilometer radius of the volcano’s crater. The 50-60 residents of the closest community to the volcano, La Yerbabuena, live barely eight kilometers (five miles) away from the crater. Five centimeters (two inches) of ash fell on La Yerbabuena in the past few days.

Authorities are concerned that heavy summer rains could generate dangerous and very fast-moving lahars. Lahars are mudflows of volcanic ash, pumice and rocks; they can travel at velocities of up to 100 km/h and move huge boulders and objects as large as houses.

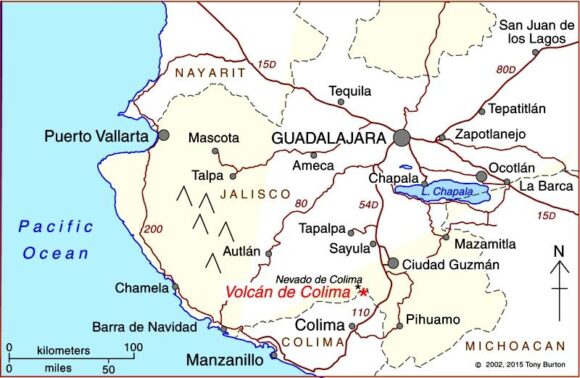
Where is Colima Volcano (Volcán de Colima)?

Location of Colima Volcano

Location of Colima Volcano (Volcán de Colima). Credit: Tony Burton / Geo-Mexico

The volcano is one of the westernmost volcanoes in Mexico’s Volcanic Axis, which straddles the country from west to east. Colima Volcano’s summit is only 8 km (5 miles) from the inactive Nevado of Colima volcano, Mexico’s sixth-highest peak, which rises 4260 m (13,976 ft) above sea level. (Lovers of geographical trivia should note that, despite their names, the summits of both volcanoes are actually located in the state of Jalisco, not in the state of Colima.)

Colima Volcano is considered one of Mexico’s most dangerous volcanoes. Numerous villages in its shadow keep a wary eye on its level of activity, and emergency evacuations have become a regular event over the past fifty years.

How high is Colima Volcano?

The elevation of Colima Volcano is officially given as 3820 m (12,533 ft) above sea level. In the past 400 years, it has been the most active volcano in Mexico, having erupted at least 30 times since 1576. Recent activity means that this exact height may no longer be correct.

The eruption of Colima Volcano on 21 January 2015, shown in this short video, is typical of recent activity.

How often does it erupt?

Historically, the eruptions of the volcano have fallen into a definite cyclical pattern with periods of activity, each lasting about 50 years, interspersed with periods of dormancy. The first cycle of activity (after the Spanish arrived in Mexico) was between 1576 and 1611. Major eruptions occurred in 1680 and 1690, and further complete cycles occurred between 1749 and 1818, and from 1869 to 1913.

The current eruption cycle

Most geologists agree that current activity is part of the fifth cycle, which began in 1961. Judging by past performance, we should be nearing the end of this cycle, though volcanoes can be extremely unpredictable, so don’t bet your house on this happening within the next decade.

Activity has intensified in the past couple of years. In early 2013, we reported that Colima Volcano had erupted, destroying a lava dome first created in 2007 and later that year we looked at how Popocatapetl Volcano and Colima Volcano continued to erupt. At that time, experts monitoring the volcano were reporting up to 200 eruptive events a day, with numerous minor emissions of lava. Colima Volcano has been exhibiting four distinct types of volcanic activity in recent years:

  • lava dome growth
  • explosive eruptions
  • flank collapse
  • lava flows.

In early 2015, activity began to intensify, with several spectacular eruptions, sending ash and dust up to 8 or 9 kilometers (5-6 miles) into the air. Ash fell on towns up to 25 kilometers (15 miles) away from the volcano, in locations including Tuxpan, Zapotiltic and Ciudad Guzmán, but with no loss of life, or significant property damage.

The volcano can be viewed via this permanent fixed webcam operated by Webcams de Mexico. Below the main image on that site are links to 1-minute time-condensed videos showing the past 24 hours of activity.

Three maps (PDF format, Spanish-language keys and text) showing the areas likely to be affected by the volcanic hazards associated with Colima Volcanocan be found via this webpage of Mexico’s National Center for Disaster Prevention (Centro Nacional de Prevención de Desastres, CENAPRED). :

The area around the Colima Volcano is described in more detail in chapter 15 of my Western Mexico, a Traveler’s Treasury (4th edition; Sombrero Books, 2013).

Related posts:

Jul 092015
 

The Jalisco state government has released an informative 5-minute video highlighting some of the reasons why Jalisco is one of the best locations in Mexico for farming, business and tourism.

The video can be viewed on Facebook: Esto es Jalisco. This is Jalisco.

Following opening shots showing some of the diverse landscapes of the state, including the Piedrotas at Tapalpa, the majestic Volcán de Colima (whose summit is actually in Jalisco, not Colima) and the Horseshoe Falls near the Dr. Atl park on the northern edge of Guadalajara, the video’s subtitles (in English) turn to techno0logy and innovation. Jalisco is the first state in Mexico to have a Ministry of Innovation, Science and Technology. The state capitol Guadalajara is the center for MIND (Mexican Innovation and Design Center) and was chosen by MIT for the establishment of a Creative Digital City.

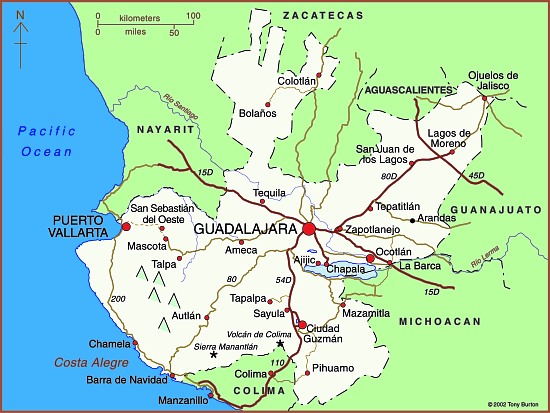
Map of Jalisco state

Map of Jalisco. Copyright 2010 Tony Burton. All rights reserved.

The city also has major cultural and sporting attractions, from libraries to golf courses to hosting international events in the Expo Guadalajara to concerts and its own international film festival. It also hosts the world’s second largest book fair (after Hamburg). Its industrial activity ranges from agro-processing (including tequila) to pharmaceuticals, information technology, automotive and aerospace firms to renewable energy enterprises.

Foreign investment in Jalisco has risen by an average of 17% a year for the past decade, with foreign firms finding the state’s geographic position advantageous for serving central Mexico and with excellent trade links to Asia and the U.S.

The state’s leading coastal resort is Puerto Vallarta, but tourism is also important in the state’s interior. Jalisco has five places with Magic Town status: Lagos de Moreno, San  Sebastian del Oeste, Tapalpa, Mazamitla and Tequila.

Jalisco currently accounts for 6.6% of national GDP and the state government clearly expects this contribution to grow in coming years. This professionally-produced video is an excellent visual introduction to one of Mexico’s most important states.

Related posts:

Mexican artist-geographer helped put Bali on the tourist map…

 Other  Comments Off on Mexican artist-geographer helped put Bali on the tourist map…
Jul 062015
 

In an earlier post – Mexico in the USA: Pacific fauna and flora mural in San Francisco – we looked at the beautiful (and very geographic!) mural by Mexican artist José Miguel Covarrubias (1904-1957).

Covarrubias had a lengthy commercial art career as an illustrator of books, designer of theater sets and costumes, and as a caricaturist for magazines including Vanity Fair and The New Yorker, but at heart, he was very much a geographer, with a healthy side-interest in ethnology.

In the mid-1920s, he moved to New York, where he fell in love with a young dancer and choreographer Rosa (Rosemonde) Cowan. The couple traveled together to Mexico, the Caribbean, Africa and Europe. In Mexico, Rosa met Miguel’s friends, including Diego Rivera and his wife Frida Kahlo, and was introduced to photography by Edward Weston.

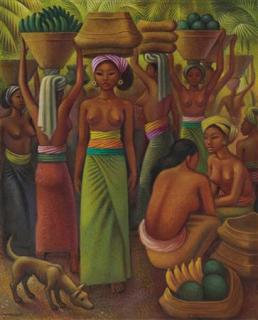
Miguel’s illustrations for advertisers, especially the one he painted for Steinway & Sons pianos, helped speed up the inclusion of Bali, Indonesia, on the world tourist map. Miguel’s piano artwork won the 1929 National Art Directors’ Medal for color painting. After Miguel and Rosa married in 1930, they used the prize money to take an extended honeymoon to Bali.

Miguel Covarrubias: "Offering of Fruits for the Temple", Bali, 1932

Miguel Covarrubias: “Offering of Fruits for the Temple”, Bali, 1932

The couple loved Bali and quickly became interested in the local language and culture. Three years later, in 1933, Miguel was awarded a Guggenheim Fellowship, and the couple returned to Bali, also visiting Java, India and Vietnam. Miguel’s art and Rosa’s photographs were key ingredients in the success of Island of Bali (1937).

The book was released in New York at a particularly propitious time, just as interest in far-flung tourism was being fired up by travel firms. The book coincided with, and refueled, a craze among well-to-do New Yorkers to visit the island. The rest of the world soon followed, and Bali’s tourist future was guaranteed.

Island of Bali is “still regarded by many as the most authoritative text on Bali and its fascinating people. Included is a wealth of information on the daily life, art, customs and religion of this magical ‘Island of the Gods.'” For more about the book, see Miguel Covarrubias: Island of Bali. on Chris Morrison’s blog Thirty-Two Minutes.

Miguel Covarrubias’s later books included Mexico South (1946); The Eagle, the Jaguar, and the Serpent – Indian Art of the Americas; North America: Alaska, Canada, the United States (1954); and Indian Art of Mexico and Central America (1957).

Related posts:


Ground-breaking mapping of Mexico’s drug war

 Mexico's geography in the Press  Comments Off on Ground-breaking mapping of Mexico’s drug war
Jul 022015
 

During the 2006-2012 federal administration, it was possible to map the incidence of crime across the country, with data readily available at both the state and the municipal level. The current administration of President Enrique Peña Nieto has diverted press attention away from the drugs-related violence, arguing that press coverage only serves to give more publicity to the bad guys. Unfortunately, that decision means that it has now become next to impossible to get regularly updated data for, or be able to map, the patterns of criminal activity.

This is one of the inevitable caveats that limits the future application of the ground-breaking methods (using data from 2007 to 2011), developed by Jesús Espinal, a quantitative analyst at the National Institute of Genomic Medicine in Mexico City,and Hernán Larralde, statistical physicist at the National University (UNAM). Their work is described in “Mapping Mexico’s deadly drug war“, in Science magazine.

Mapping by Jesús Espinal Enríquez in Science magazine. Click to enlarge.

Mapping by Jesús Espinal Enríquez in Science magazine. Click to enlarge.

Essentially, they took official data for the location and date of all drug-related homicides in Mexico. They built a complex month-by-month network looking for temporal correlations in the homicide numbers between different cities. “If cities shared a death rate higher than 70 casualties per 100,000 inhabitants in a year and were less than 200 kilometers apart, Larralde and Espinal linked them together on their map to tease out broader geographical patterns.”

The results (summarized by the maps) are interesting. They show the rapid spatial spread of violence during the administration of Felipe Calderón as his government waged its war on drug cartels. The map for 2011 suggests that violence may have been finally becoming less widespread and becoming more focused on a relatively limited number of places.

Two major points are worth emphasizing. First (and as we have repeatedly pointed out in previous posts on this subject), the incidence of violent crime, including homicides, is certainly not similar across the entire country. Some states have much higher homicide rates than others; some municipalities have much higher rates than others. Some parts of the country, including several important tourist areas, have witnessed little or no drug-related violence.

Second, there is no evidence that the spread of violence between 2007 and 2011 occurred by continuous “contagious” diffusion (i.e. that it gradually spread from a single central point or a limited number of central points). The work of these authors supports the contention that the drugs-related activity in Mexico could, and did, increase simultaneously in cities far apart. This is only suggesting a coincidence in timing, and is certainly not proof of any causal connection. A small number of cities, such as Ciudad Juárez, Acapulco, Culiacán, Monterrey, Tampico and
Tijuana, appear as nodes in the network.

This approach may offer some help to policy makers as they consider alternative approaches to combating drugs-related violence, but, as the article makes clear, it does not necessarily mean that the best policy is to attack the cartels in the central hub cities. Aiming at the heart of a major cartel might reduce violence for a time, but could also lead to the formation of numerous smaller splinter groups with different ideals and methods. For example, after the leadership of the Gulf Cartel was dismantled in 2010, the cartel’s former enforcing arm, the Zetas took over, introducing a wave of more extreme violence.

Related posts:

Mexico’s webcams

 Books and resources  Comments Off on Mexico’s webcams
Jun 292015
 

There are thousands of webcams operating in Mexico offering armchair geographers the opportunity to see up-to-date images of active volcanoes, megacities, archaeological sties, small towns and tourist resorts.

Many of the major webcams are listed at Webcams de México, which has several great features once you’ve chosen a particular webcam, including access to prior images for any date and time, or the ability to compile an instant time-lapse video covering any period of time.

Links to webcams listed at Webcams de México:

Explore Mexico via its webcams! Enjoy!

Related posts:

The geography of Mexican farming, agriculture and food production: index page

 Index page  Comments Off on The geography of Mexican farming, agriculture and food production: index page
Jun 222015
 

This index page lists the major posts on Geo-Mexico related to agriculture, farming and food production. Additional agriculture-related posts can easily be found via our tag system.

Post highlighted in red are new additions to the index since the last time it was published.

Enjoy!

General posts related to agriculture and agricultural products:

Individual crops and products:

Other Geo-Mexico index pages:

Community-based ecotourism in La Ventanilla, Oaxaca: success or failure?

 Other  Comments Off on Community-based ecotourism in La Ventanilla, Oaxaca: success or failure?
Jun 182015
 

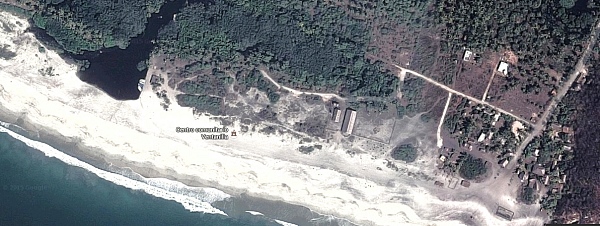
Ecotourism at La Ventanilla on the coast of Oaxaca, a small community of about 100 inhabitants, located between the beach resorts of Puerto Escondido and Puerto Angel, began more than twenty years ago. It is based on trips run by local guides through the mangroves lining a lagoon on the Tonameca River; the area’s wildlife includes iguanas, birds, crocodiles and sea turtles.

The main local cooperative that conducts tours is called Servicio Ecoturisticos de La Ventanilla (La Ventanilla Ecotourism Services). Income from its tours supports reforestation and other ecological projects, including a greenhouse for mangrove reforestation and a nursery to hatch and raise crocodiles for release on Uma Island, in the lagoon. A breakaway co-operative, Cooperativa Lagarto Real, also runs some local excursions, though its profits do not contribute to local conservation efforts.
La Ventanilla (Google Earth)

La Ventanilla (Google Earth)

Most visitors to La Ventanilla come only for the day; the small local community offers only limited services or accommodations for tourists. The community of La Ventanilla is often held up as a shining example of how a well-implemented “assistive conservation” ecotourism approach can combine environmental conservation with economic sustainability, while enhancing the local quality of life.

But is this apparent success story quite as idyllic as usually portrayed in the mainstream press? Dr. David Vargas-del-Río, a researcher at ITESO in Guadalajara, sets out to explore this question in his recent article, “The assistive conservation approach for community-based lands: the case of La Ventanilla”, published in the December 2014 issue of The Geographical Journal. The article is based on Vargas-del-Río’s doctorate thesis at the UPC University, Barcelona.

As Vargas-del-Río explains, “The assistive conservation approach includes strategies for conserving community-based lands based on a complex combination of traditional and modern scientific knowledge. It enjoys broad legitimacy and seems promising for conserving territories with autochthonous populations. However, as a novel strategy, it has been applied mostly to societies and environments that are fragile in conservationist terms.”

The author explores how there has been a gradual shift in the protection of natural areas from ‘top-down’ to ‘bottom-up’ models of environmental management, before turning to his case-study of La Ventanilla. La Ventanilla lends itself to such a case study since an assistive conservation approach was first implemented there more than twenty years ago, More than sufficient time to allow for some follow-up evaluation. His eventual conclusion is that while assistive conservation approaches sound good in theory, they may, over time, make local ecologies “more vulnerable to social and environmental degradation, especially as traditional management institutions once responsible for ecological integrity become obsolete”.

In reviewing the background literature, Vargas-del-Río asserts that there are “three broad critical currents” of criticism of the assistive conservation approach. These include the potential adverse impacts of utilizing protected areas for tourism. The provision of attractions, installations and other services, leads to “new dynamics, impacts and transformations” in terms of tourism providers, and may result in “competition between local actors and powerful tourism agents, both conventional and emergent.” Potential issues include changes in local consumption and behavior patterns, and the view that nature and local culture are commodities.

Just how was this manifested in the context of La Ventanilla?

Initial effects of the assistive conservation approach in La Ventanilla were positive. Restrictions were placed, and enforced, on “activities considered ‘disruptive’; that is, hunting, selling local species, harvesting turtle eggs, and felling mangrove trees…”The cooperative soon won praise for its environmental responsibility and received more funds from the government to conduct volunteer conservation projects, including reforestation in the mangroves, a deer reserve, a turtle egg nursery, and areas for iguanas, among other initiatives. Hence, it continued to receive financial and moral power which it exercised over the rest of the population, while promoting conservation and tourism over traditional uses.”

Following extensive fieldwork in the community, Vargas-del-Río found, “a marked tendency towards spatial segregation, social fragmentation, inequality and speculation; phenomena that have emerged as a direct result of the ‘conservation’ initiative with its nature-based tourism activities and imposed environmental restrictions.”The La Ventanilla Ecotourism Services Cooperative (CSELV) is “controlled by six local leaders who own the lands where the cooperative’s main assets are located, handle all accounts, and elaborate support and funding applications.” Other members of the co-operative are “simple wage earners”.

Inequality triggered by the project led to segregation, in terms of housing quality, in the central area of the community. A group of nine disgruntled members of the initial co-operative, broke away in 2004 and founded a second co-operative, Lagarto Real. They “disregarded the management plan”, “sabotaged some conservation and ecotourism initiatives undertaken in this sub-zone, and set up restaurants, shops and camping sites of their own that lacked the ‘green’ image that others were marketing.” The growth of ecotourism has led to land speculation, including a controversy over the construction and (illegal) sale of a small hotel built on communal property.

The island of Uma is controlled by the original co-operative and no longer accessible for traditional activities such as agriculture. There has been a dramatic shift in economic activities. “Agriculture and fishing are now practiced by just 7% of inhabitants and represent an important source of income for only 10.7% of households. In contrast, tourism-related activities occupy 34.7% of the people, represent 70.1% of the economically active population, and are the main source of income for 67.9% of households.”

Vargas-del-Río concludes that previous assessments failed “to take into account slow, gradual changes”. One outcome has been “a higher risk of land degradation in social and environmental terms as the local society fragments, inequality increases, more actors (external and local) strive to profit from the territory, and regulation becomes more difficult.”

In conclusion, “assistive approaches modify ways of approaching nature, restrict traditional uses in favour of tourism, weaken local management institutions and degrade environmental and social relations.” The assistive approach “undermines the cultural, economic and local environment while creating new spaces for consumption.”

Source:

David Vargas-del-Río, 2014. “The assistive conservation approach for community-based lands: the case of La Ventanilla”, The Geographical Journal, Vol. 180 #4 (December 2014) 377–391.

Related posts:

Jun 152015
 

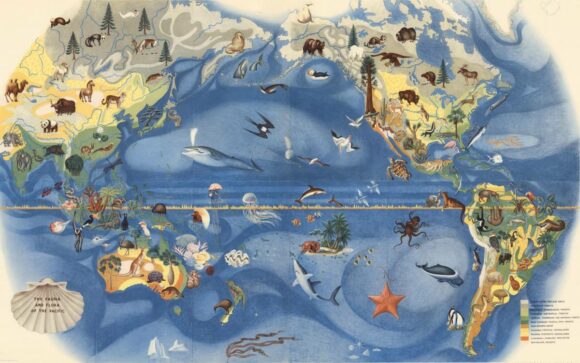
Visitors to the De Young Museum in San Francisco can admire a wonderful mural showing the fauna and flora of the Pacific, painted by Mexican artist José Miguel Covarrubias (1904-1957) for the city’s 1939-1940 Golden Gate International Exposition on Treasure Island in San Francisco Bay.

Covarrubias Mural of the Pacific

Covarrubias Mural of the Pacific (Click image to enlarge)

Following conservation work performed by experts in Mexico, the mural is currently on loan to the De Young Museum from its owners, San Francisco’s Treasure Island Development Authority.

While the De Young Museum website continues to describe this mural as “one of a six-part series of fanciful, larger-than-life-size maps created by noted Mexican artist Miguel Covarrubias”, we sincerely doubt that these murals were ever really “larger-than-life-size”!

The mural is one of the five remaining murals painted by José Miguel Covarrubias for the exposition. The whereabouts of a sixth mural, which completed the series known as “Pageant of the Pacific”, are unknown.

The details are exquisitely painted, and the mural is as beautiful as it is educational.

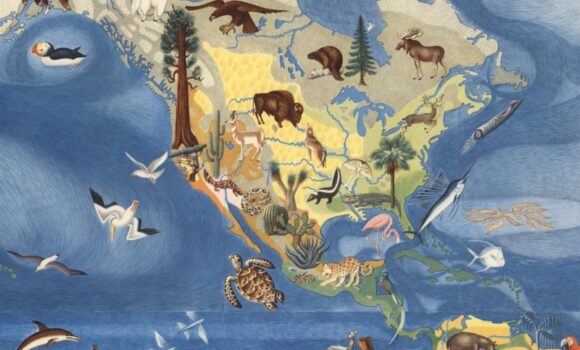
covarrubias-flora-fauna-north-america-sm

Covarrubias: Mural of the Pacific (detail)

As ever-erudite Jon Haeber writes in his blog post about this mural, painted “at a critical juncture in America’s history”, its artist “was a confidante of Mexican greats Diego Rivera and Frida Kahlo. As a caricaturist for Vanity Fair and The New Yorker, it could easily be assumed that Covarrubias is largely ignored by fine art historians, but he was an anthropologist and geographer as much as he was an artist, which gave him a unique respect among art aficionados… Not only are they an informative lesson in Geography, but they are also a great piece of history – to say nothing about their creator.” [http://www.terrastories.com/bearings/covarrubias-art-forms-pacific viewed June 2015]

Covarrubias was indeed a geographer and ethnologist. Among other works, he authored Island of Bali (1937); Mexico South (1946); The Eagle, the Jaguar, and the Serpent – Indian Art of the Americas; North America: Alaska, Canada, the United States (1954); and Indian Art of Mexico and Central America (1957).

The temporary structures on Treasure Island were subsequently demolished and Covarrubias’ six murals sent to the American Museum of Natural History in New York. When they were brought back to California in the late 1950s, the series was missing the mural entitled “Art Forms of the Pacific Area”. The titles of the five surviving murals are The Fauna and Flora of the Pacific, Peoples, Economy, Native Dwellings, and Native Means of Transportation.

The River Santiago and the Juanacatlan Falls: from the “Niagara of Mexico” to the “Silent River”

 Books and resources, Mexico's geography in the Press  Comments Off on The River Santiago and the Juanacatlan Falls: from the “Niagara of Mexico” to the “Silent River”
Jun 112015
 

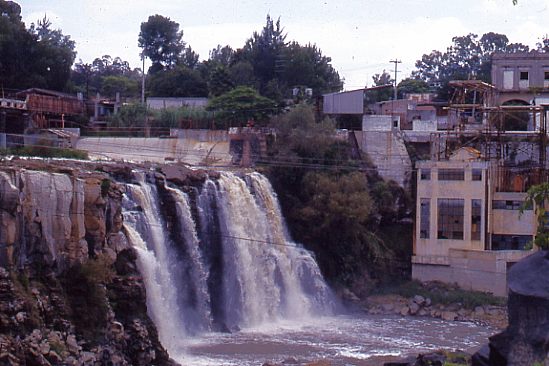
In summer 1987, while living in Guadalajara, I entertained a fellow UK geographer, who arrived with a long list of places he wanted to visit. Over the next few weeks, we ticked them off one by one. Near the end of his visit, he asked why I hadn’t yet taken him to see the famous Juanacatlán Falls, the “Niagara of Mexico”, despite them being in his “top ten” places to see. “OK”, I said, “let’s go!”

Traffic was heavy and as we drove across Guadalajara, I could see his impatience building. Finally, he asked me, “Where are they? How close are we?” I replied that we were “fairly close” but that I was absolutely certain that he would recognize them before they came into sight. A few minutes later and he screwed up his nose and said, “Ughh. What’s that smell?” “See?”, I said triumphantly, “I knew you’d recognize them before you saw them!”

Juanacatlán Falls in 1989. Photo: Tony Burton. All rights reserved.

Juanacatlán Falls in 1989. Photo: Tony Burton. All rights reserved.

Even thirty years ago, long before NAFTA, the Juanacatlán Falls were a sorry sight (and source of a worse smell). Since then, and since NAFTA, they have only become worse. These once-majestic falls, the first Mexican landscape on a postage stamp back in 1899, have been reduced to a trickle of foul-smelling effluent. At the start of the twentieth century, the falls provided hydro-electric power for Guadalajara and turned the wheels of a cotton and woolen mill, the ruins of which now stand to one side.

A recent piece of investigative journalism about the River Santiago, the river which created these waterfalls, makes for disturbing reading. It provides plenty of evidence that the rapid increase in factories along the river, mainly post-NAFTA, may have provided 50,000 new jobs, but has also led to worsening water quality to the point where exposure to the river presents a serious public health risk.

In “River of Death“, Steve Fisher lays bare the terrible reality faced by those living and working close to the river. This is a harrowing tale, with heart-rending testimony from several local residents. On a positive note, the related video, Fusion Investigates: Silent River (below) describes how Sofía Enciso and her family have defied death threats and are determined to confront the factories responsible, while demanding that the relevant authorities take action to enforce federal water quality regulations, and start to clean up the river.

Perhaps the most telling single statistic is that precisely zero companies were fined for failing to comply with water discharge regulations between 2005 and 2011.

In the video, the mayor of El Salto, the main town near the Juanacatlán Falls, claims that the river has become polluted in the past thirty years. I guess he must be too young to remember that they were seriously polluted long before that.

Is it too much to hope that the government, corporations and society in the El Salto area can all come together to remedy this appalling tale of willful mismanagement? Local residents are right to insist on the enforcement of existing water quality regulations and on the implementation of remedial measures to reverse the decline of this major river and its once-famous waterfalls. Even more importantly, urgent measures are needed to reverse the deteriorating public health situation faced by all those living or working nearby.

Related posts:

Jun 082015
 

Mexico’s official online database of all the country’s roads and highways has just been updated. As of May 2015, Mexico has a total of 322,859 kilometers of roads and highways.

They are all shown on a map accessed via this web-page. [Link to http://www.imt.mx/micrositios/sistemas-de-informacion-geoespacial/servicios-tecnologicos/red-nacional-de-caminos/ver-datos.html no longer working.]

Mexico's major highways (Fig 17-3 of Geo-Mexico, the geography and dynamics of modern Mexico).

Mexico’s major highways, 2009 (Fig 17-3 of Geo-Mexico, the geography and dynamics of modern Mexico). All rights reserved.

Here is a summary of some of the more useful statistics found in the database:

  • 158,180 km of paved highways, including
    • 48,685 km of federal highways,
    • 92,590 km of state highways
    • 9412 km of toll highways
  •  36,139 km of urban roads
  • 118,812 km of rural (unpaved) roads.

The highway network connects 25,844 places, and has links to 39 ferry routes. It also includes 847 toll stations, 3476 bridges and 178 tunnels.

According to the report, Mexico currently has 6480 gas stations. However, this number is expected to increase rapidly in the next few years as competitors enters a market over which PEMEX previously held a monopoly, prior to recent energy reform laws.

If you are planning to drive across Mexico, then the online system at http://ttr.sct.gob.mx/mappir/ will give you routes, distances and estimated times and costs.

Further reading:

Earthshots: Satellite Images of Environmental Change: Angangueo, Mexico

 Books and resources  Comments Off on Earthshots: Satellite Images of Environmental Change: Angangueo, Mexico
Jun 042015
 

In 2015, the USGS published a series of satellite images of environmental change [no longer online] of the area around the town of Angangueo in the eastern part of the state of Michoacán (very close to the border with the State of México) and the mountainous hillsides covered in pine-fir forest where the migrating Monarch butterflies spend their winters.

The pine-fir forests are found at an elevation of around 3000 meters (10,000 feet) above sea level. The butterflies congregate in a small number of locations, forming massive clumps on the trees. Any major disturbance, such as a windstorm or excessive snow, can cause the loss of (literally) millions of Monarchs. The overwintering Monarchs need just the right range of temperatures. On the one hand, they must not be so cold that they freeze or are not warm enough to flutter in search of food and water. On the other hand, if it is too warm, they may burn through their energy reserves or need to replenish too much moisture. The canopy of the pine-fir forest provides some protection, but even a partial thinning of this canopy will change the microclimate beneath.

In this post, we will will take a quick look at the images of Chincua reserve. This reserve includes the location where overwintering congregations of Monarch butterflies were reported for the first time in the mid-1970s. This is one of the areas where conservationists fear that the pine-fir forest (appearing vibrant red in the images) may have suffered too much clearing and thinning, which may have altered the area’s microclimate and made it unsuitable for successful overwintering.

When looking at the images, bear in mind that:

    • Red signifies healthy vegetation.
    • Landsat images are always taken in mid-morning, so shaded northwest slopes look darker. Shadows can vary slightly from one month to the next.
    • The images show forest clearance, but do not reveal forest thinning. The consequences of forest thinning (the removal of individual trees) may be just as significant in the context of the annual Monarch butterfly migration.
Satellite images of Chincua reserve, 1986, 2000 and 2011.

Satellite images of Chincua reserve, 1986, 2000 and 2011. Click to enlarge.

In the 2000 image, the Chincua reserve shows some rashy gray areas just above and to the right of the center of the image. These gray areas are not visible on the 1986 image. This may be evidence of a fire, or some other kind of clearing. The 2011 image seems to indicate that the vegetation in that area has recovered, at least to some extent.

A truly detailed examination of these images is beyond the scope of this short post, but high-resolution images (which can be downloaded from the USGS site) will repay a closer study. See, for example, the satellite images of Pelon.

Finally, it is worth remembering that the Monarch as a species is not endangered. There is, indeed, a year-round population of Monarchs in central and western Mexico that is non-migratory owing to the ready availability of milkweed, the only plant on which female Monarchs lay their eggs, throughout the year. It is only the butterfly migration that is considered an “endangered phenomenon”, and all three countries involved (Canada, USA and Mexico) have now instituted programs to try to ensure its long-term success.

Satellite monitoring of the areas of importance to the Monarch butterfly should help identify the key areas on which conservation efforts need to be focused.

Related posts:

Mexican-themed garden wins gold at UK’s Chelsea flower show

 Mexico's geography in the Press  Comments Off on Mexican-themed garden wins gold at UK’s Chelsea flower show
Jun 012015
 

The U.K. has declared 2015 as the “Year of Mexico” and is hosting numerous cultural and trade events this year related to Mexico. Not to be outdone, a Mexican-themed Pavilion exhibit has won gold at the prestigious Chelsea Flower Show, held in London in May. The show is organized each year by the Royal Horticulture Society and was first held more than a century ago.

The gold-medal winning garden design in 2015 was based on a very unusual garden created in Mexico by the eccentric Englishman Edward James at “Las Pozas” (the Pools), the home he built near Xilitla in the state of San Luis Potosí. James (1907-1984) was a sponsor of the surrealist art movement, as well as a surrealist artist in his own right. His entire estate in Mexico became his canvass for a marvelously-creative collection of sculptures and follies set in luxuriant, semi-tropical jungle.

The winning garden at Chelsea, entitled “Surreal Pillars of Mexico,” was designed by Jon Wheatley and sponsored by HSBC and the U.K.’s National Dahlia Collection. The dahlia is Mexico’s national flower:

“Surreal Pillars of Mexico” had a circular structure and pillars that emulated Edward James’s garden in Mexico. It included 50 different types of dahlias, surrounded by over 100 plants and vegetables such as lettuce, cactus and the exotic agave plant.

New varieties of dahlias, first described in Mexico in 1529, had been developed via selective breeding and propagation programs even in pre-Columbian botanical gardens. The dahlia arrived in the U.K. in the early nineteenth century, via Spain and only after several unsuccessful attempts at introducing it. The National Dahlia Collection in the U.K. cultivates and promotes the flower; all the varieties existing in the U.K. originated from just three types of dahlias.

The Year of Mexico to the United Kingdom includes more than 100 separate exhibitions, concerts, festivals, academic workshops and artistic residencies; as well as trade missions, research projects, grants and scholarships. These shows will highlight the creativity of Mexican writers and artists, while also showcasing the country’s history and its modern-day industrial strength.Events are being held at a number of cities, including London, Cardiff, Edinburgh, Belfast, Manchester, Oxford, Liverpool and Birmingham.

Related posts:

May 282015
 

Remittances sent home by Mexican migrants (almost all of them residing in the USA) rose to $2.26 billion in March 2015, 7.6% higher than the same month a year earlier. This was the highest monthly figure since May 2012, and the highest ever figure for March.

The average remittance sent to Mexico in March 2015 was $311.30, the highest figure since July 2012, and the number of transfers was 7.25 million.

The March figure brought the total remittances for the first quarter of this year to $5.7 billion, 4.9% higher than the same period in 2014.

Workers in California sent remittances worth $1.59 billion home during the first three months of this year, more than the workers in any other state. Texas came in second place with $763.9 million and Illinois placed third at $199.3 million.

The three main receiving states in Mexico were:

  • Michoacán – $603 million
  • Jalisco – $539 million
  • Guanajuato – $509 million

For an introduction to the topic of remittances, with links to some of the key posts on this blog, see

A comprehensive index page listing all the posts oon Geo-Mexico related to migration and remittances can be found at Migration and remittances: an index page.